. 2014 Mar 17:5:3495.
doi: 10.1038/ncomms4495.

FoxP3+ regulatory T cells promote influenza-specific Tfh responses by controlling IL-2 availability

Affiliations

FoxP3+ regulatory T cells promote influenza-specific Tfh responses by controlling IL-2 availability

Beatriz León et al. Nat Commun. .

Abstract

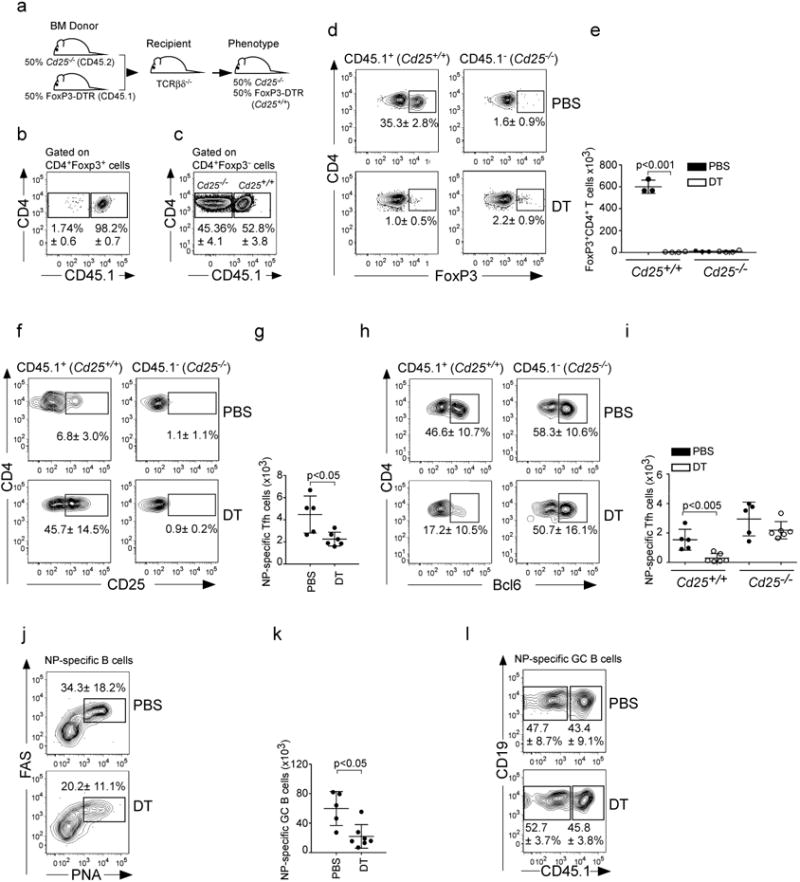
Here, we test the role of FoxP3(+) regulatory T cells (Tregs) in controlling T follicular helper (Tfh) and germinal centre (GC) B-cell responses to influenza. In contrast to the idea that Tregs suppress T-cell responses, we find that Treg depletion severely reduces the Tfh cell response to influenza virus. Furthermore, Treg depletion prevents the accumulation of influenza-specific GCs. These effects are not due to alterations in TGFβ availability or a precursor-progeny relationship between Tregs and Tfh cells, but are instead mediated by increased availability of IL-2, which suppresses the differentiation of Tfh cells and as a consequence, compromises the GC B response. Thus, Tregs promote influenza-specific GC responses by preventing excessive IL-2 signalling, which suppresses Tfh cell differentiation.


Figures

Figure 1
Figure 1. Treg depletion compromises GC B cell responses to influenza
(a-f) B6 and FoxP3-DTR mice were infected with PR8, administered DT on days 0, 4 and 7 after infection and cells from the mLN were analyzed on day 10. The frequency (a) and number (b) of CD4+ T cells that expressed FoxP3 were determined by flow cytometry. The frequency (c) and number (d) of CD19+CD138-PNA+CD38lo GC B cells was determined by flow cytometry. The frequency of NP-specific CD19+ B cells (e, top row) and the frequency of NP-specific CD19+PNA+CD38lo GC B cells (e, bottom row) were determined by flow cytometry. (f) The number of NP-specific CD19+PNA+CD38lo GC B cells was calculated. Data in all panels are representative of five independent experiments (mean ± s.d of 5 mice). P values were determined using a two-tailed Student's t-test.
Figure 2
Figure 2. Influenza-specific Tfh cells are found in mLN but not the lung
(a-d) B6 mice were infected with PR8 and cells were analyzed by flow cytometry on day 10. (a) The frequency of PD-1hiCXCR5hi Tfh cells and PD-1loCXCR5lo Teff cells in the NP-specific CD4+ T cells from the mLN. (b) Bcl6 expression on PD-1hiCXCR5hi and PD-1loCXCR5lo NP-specific CD4+ T cells. (c) The frequency of PD-1loCXCR5lo Teff cells in the NP-specific CD4+ T cells from the lung. (d) Bcl6 expression on NP-specific CD4+ T cells obtained from the lungs and mLNs. (e) B6 mice were infected with PR8 and the number of NP-specific CD4+Bcl6hiPD-1hiCXCR5hi cells in the mLN was calculated at the indicated times. Data are shown as the mean ± SD (n=4-5 mice/point). Data are representative of three independent experiments.
Figure 3
Figure 3. Treg depletion compromises influenza-specific Tfh cell responses
(a-e) B6 and FoxP3-DTR mice were infected with PR8, administered DT on days 0, 4 and 7 after infection and the frequency (a) and number (b) of NP-specific CD4+ T cells in the mLN was determined by flow cytometry. The frequency of PD-1hiCXCR5hi cells (c, top row) and the frequency of Bcl6hi cells (c, bottom row) in the NP-specific CD4+ T cell population in the mLN was determined by flow cytometry and the numbers of NP- specific CD4+Bcl6hiPD-1hiCXCR5hi cells (d) and NP-specific CD4+Bcl6loPD-1loCXCR5lo cells (e) in the mLN were calculated. (f-g) B6 and FoxP3-DTR mice were infected with PR8, administered DT on days 0, 4 and 7 after infection and the frequency (f) and number (g) of NP-specific CD4+ T cells in the lungs on day 10 were determined by flow cytometry. Data are representative of five independent experiments (mean ± s.d of 5 mice per group). P values were determined using a two-tailed Student's t-test. (h-j) B6 and FoxP3-DTR mice were infected with PR8, administered DT on days 6 and 10 and the expression of Bcl6 in NP-specific CD4+ T cells (h), the number of NP-specific CD4+Bcl6hiPD-1hiCXCR5hi cells (i) and the number of NP-specific CD4+Bcl6loPD-1loCXCR5lo cells (j) was determined in the mLN on day 12. Data are representative of two independent experiments (mean ± s.d of 4-5 mice per group). P values were determined using a two-tailed Student's t-test.
Figure 4
Figure 4. Tfh cells do not originate from Foxp3-expressing precursors
(a) B6 mice were infected with PR8 and the expression of FoxP3 on total CD4+ T cells NP-specific CD4+PD-1hiCXCR5hi and NP-specific CD4+PD-1loCXCR5lo cells from the mLN were analyzed by flow cytometry on day 10. (b-d) B6 mice were irradiated and reconstituted with a 50:50 mix of BM from B6 (CD45.1) and FoxP3-DTR donors (CD45.2). Reconstituted mice were infected with PR8, administered DT on days 0, 4 and 7 after infection the frequency of CD4+FoxP3+ cells (b), the frequency of NP-specific CD4+PD-1hiCXCR5hi cells (c) and the frequency of CD4+PD-1hiCXCR5hi cells (d) from CD45.1 or CD45.2 donors was determined by flow cytometry. Data are representative of three independent experiments (mean ± s.d of 4-5 mice per group). (e-f) B6 mice were infected with PR8 and the frequency of PD-1hiCXCR5hi cells in CD4+ FoxP3- or CD4+ FoxP3+ T cells (mean ± s.d of 5 mice per group) (e) and the expression of Bcl6 in NP-specific CD4+ cells and CD4+FoxP3+ cells (f) were determined by flow cyometry on day 10. All data were obtained after gatingon CD19- cells. Data are representative of five independent experiments
Figure 5
Figure 5. TGF-β blockade does not affect influenza-specific Tfh or GC B cell responses
(a-g) B6 mice were infected with PR8 and treated with 250 μg of anti-TGF-β or isotype- matched control antibody on days 0 and 5 and the frequency (a) and number (b) of NP- specific CD4+ T cells, the expression of Bcl6 on NP-specific CD4+ T cells (c), the frequency (d) and number (e) of NP-specific CD4+PD-1hiCXCR5hi cells was determined by flow cytometry on day 10 in the mLNs. (f-g) B6 mice were infected with PR8 and treated on days 0 and 5 with 250 μg of anti-TGF-β or control antibody and the number of CD19+PNA+CD38loCD138- GC B cells (f) and the number of NP-specific CD19+PNA+CD38lo GC B cells (g) in the mLNs was determined by flow cytometry on day 10. Data are representative of three independent experiments (mean ± s.d of 4-5 mice per group).
Figure 6
Figure 6. Increased IL-2 production and CD25 expression in Treg depleted mice
(a-b) B6 and FoxP3-DTR mice were infected with PR8, administered DT on days 0, 4 and 7 and, on day 10, cells from the mLN were re-stimulated in vitro and the frequencies of IFNγ-producing CD4+ cells (a) and IL-2-producing CD4+ cells (b) were determined by intracellular staining. (c) B6 mice were infected with PR8 and the frequency of NP- specific CD4+CD25+ T cells was determined by flow cytometry in the mLN on days 7 and 10 after infection. (d-e) B6 and FoxP3-DTR mice were infected with PR8, administered DT on days 0, 4 and 7 and the frequency of NP-specific CD4+CD25+ cells (d) and the frequency of CD4+CD25+FoxP3- cells (e) was determined by flow cytometry in the mLN on 10 after infection. Data are representative of three independent experiments (mean ± s.d of 4-5 mice per group). P values were determined using a two- tailed Student's t-test.
Figure 7
Figure 7. Excessive IL-2 signaling after Treg depletion inhibits Tfh cell responses
(a-c) Irradiated TCRβδ-/- mice were reconstituted with a 50:50 mix of BM from Cd25-/- donors (CD45.2) and FoxP3-DTR donors (CD45.1). Reconstituted mice were infected with PR8 and the percentages of CD45.1+ and CD45.1- cells within the CD4+FoxP3+ cells (b) and the CD4+FoxP3- T cells (c) determined by flow cytometry on day 10. (d-l) Irradiated Tcrbd-/- mice were reconstituted with a 50:50 mix of BM from Cd25-/- donors (CD45.2) and FoxP3-DTR donors (CD45.1), infected with PR8, treated with either PBS or DT and the frequency (d) and number (e) of CD4+FoxP3+ cells derived from either CD45.1 or CD45.2 donors was determined by flow cytometry on day 10. The frequency of CD4+CD25+ in NP-specific cells (f) derived from either CD45.1 or CD45.2 donors was determined by flow cytometry on day 10. The number of total NP-specific CD4+Bcl6hiPD-1hiCXCR5hi cells (g) was calculated on day 10. The frequency of CD4+Bcl6hi in NP-specific cells (h) derived from either the CD45.1 or CD45.2 donors was determined on day 10. The number of NP-specific CD4+Bcl6hiPD-1hiCXCR5hi cells (i) derived from either the CD45.1 or CD45.2 donors was determined by flow cytometry. The frequency (j) and number (k) of NP-specific CD19+FAS+PNA+ GC B cells was determined on day 10. The frequency of NP-specific B cells derived from either the CD45.1 or CD45.2 donors (l) was determined by flow cytometry on day 10. Data are representative of four independent experiments (mean ± s.d of 5-7 mice per group). P values were determined using a two-tailed Student's t-test.

Comment in

References

    1. Goodnow CC, Vinuesa CG, Randall KL, Mackay F, Brink R. Control systems and decision making for antibody production. Nature immunology. 2010;11:681–688. - PubMed
    1. Vinuesa CG, Linterman MA, Goodnow CC, Randall KL. T cells and follicular dendritic cells in germinal center B-cell formation and selection. Immunological reviews. 2010;237:72–89. - PubMed
    1. Crotty S. Follicular helper CD4 T cells (TFH) Annual review of immunology. 2011;29:621–663. - PubMed
    1. Yu D, Vinuesa CG. The elusive identity of T follicular helper cells. Trends in immunology. 2010;31:377–383. - PubMed
    1. Allen CD, Okada T, Cyster JG. Germinal-center organization and cellular dynamics. Immunity. 2007;27:190–202. - PMC - PubMed