. 2014 May;15(5):473-81.
doi: 10.1038/ni.2849. Epub 2014 Mar 16.

Costimulation via the tumor-necrosis factor receptor superfamily couples TCR signal strength to the thymic differentiation of regulatory T cells

Affiliations

Costimulation via the tumor-necrosis factor receptor superfamily couples TCR signal strength to the thymic differentiation of regulatory T cells

Shawn A Mahmud et al. Nat Immunol. 2014 May.

Abstract

Regulatory T cells (Treg cells) express members of the tumor-necrosis factor (TNF) receptor superfamily (TNFRSF), but the role of those receptors in the thymic development of Treg cells is undefined. We found here that Treg cell progenitors had high expression of the TNFRSF members GITR, OX40 and TNFR2. Expression of those receptors correlated directly with the signal strength of the T cell antigen receptor (TCR) and required the coreceptor CD28 and the kinase TAK1. The neutralization of ligands that are members of the TNF superfamily (TNFSF) diminished the development of Treg cells. Conversely, TNFRSF agonists enhanced the differentiation of Treg cell progenitors by augmenting responsiveness of the interleukin 2 receptor (IL-2R) and transcription factor STAT5. Costimulation with the ligand of GITR elicited dose-dependent enrichment for cells of lower TCR affinity in the Treg cell repertoire. In vivo, combined inhibition of GITR, OX40 and TNFR2 abrogated the development of Treg cells. Thus, expression of members of the TNFRSF on Treg cell progenitors translated strong TCR signals into molecular parameters that specifically promoted the development of Treg cells and shaped the Treg cell repertoire.


Figures
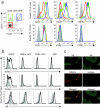
Figure 1
Figure 1. Expression of GITR, OX40, and TNFR2 on thymic Treg progenitors and GITR-L, OX40-L, and TNF on APCs in the thymic medulla
(a) Thymocytes from adult (6-10 week old) female or male Foxp3-GFP mice were stained with antibodies against the indicated TNFRSF members in conjunction with antibodies against CD4, CD8, and CD25. In the left panel, conventional (non-Treg) CD4SP thymocytes were gated as CD4+CD8CD25Foxp3 (red lines), Treg progenitors as CD4+CD8CD25+Foxp3 (green lines), and mature thymic Treg cells were CD4+CD8CD25+Foxp3+ (blue lines). The histograms to the right display the expression of TNFRSF within the indicated populations as compared to isotype-stained controls (gray shaded histograms). Data are representative of at least three separate experiments (n ≥ 3). (b) Expression analysis of the specific TNFSF ligands GITR-L, OX40-L, and TNF was conducted by flow cytometry on collagenase- and DNase I-digested thymii harvested from 6-8 week old male or female mice, which were magnetically depleted with anti-CD45 for enrichment of mTEC or enriched with anti-CD11C for DCs. Histograms show the expression of GITR-L (top), OX40-L (middle), and total TNF (membrane + intracellular, bottom) within the indicated populations gated as follows: mTEC (CD45EpCAM+UEA1+), SIRPα+ cDC (CD11c+B220SIRPα+CD8α), CD8α+ cDC (CD11c+B220SIRPαCD8α+), and pDC (CD11c+B220+). Data are representative of thymic DC or mTEC isolations pooled from 3-4 mice in at least three separate experiments (n ≥ 3). (c) Frozen thymic sections from 6-12 week old female or male mice were stained with anti-Keratin 5 (K5-FITC, green), anti-OX40-L or isotype control (PE, red), and corresponding images were merged (yellow) to evaluate the spatial distribution of TNFSF ligands within the thymus. (10X magnification, white bars represent 100 um; n=3, one of three independent experiments).
Figure 2
Figure 2. Treg progenitors express select TNFRSF members in direct proportion to TCR signal strength
(a) Six-to-twelve week old female or male Nur77-GFP reporter mice were used to evaluate the role of TCR signal strength on the expression of TNFRSF members. Treg progenitors were plotted on the basis of their expression of GITR and OX40 (left), and quartile gates representing the spectrum of expression of these receptors were evaluated for Nur77-GFP expression in the corresponding histograms (right). Data are representative of four separate experiments (n = 4). (b) Raw values for GITR, OX40, TNFR2, and CD27 on Treg progenitors were plotted versus Nur77-GFP expression. Lines represent the correlation between x and y variables and were used to calculate Pearson correlation coefficients (r). Correlation data for GITR are representative of 8 separate experiments (n = 8), for OX40 from 4 experiments (n = 4), for TNFR2 from 3 experiments (n = 3), and for CD27 from 3 experiments (n =3). (c) Histograms derived by gating on Treg progenitors from Cd4Cre × Tak1FL/FL mice (abbreviated as Tak1 KO, black histograms) and their wild type littermates (B6 background; gray shaded histograms; top panel) or Cd28−/− mice (black histograms) and their wild type littermates (BALB/c; gray shaded histograms; lower panel) are plotted demonstrating the expression of GITR, OX40, TNFR2, and CD27. (d) Cumulative data show the relative expression of GITR, OX40, TNFR2, and CD27 on Treg progenitors from TAK1-deficient and CD28-deficient mice in comparison to wild type littermates. Raw MFI values obtained from each mouse after gating on CD25+Foxp3 Treg progenitors were divided by the average MFI obtained from all wild type mice for normalization amongst separate experiments (mean ± SEM, for Tak1 KO experiments n ≥ 4 from at least two separate experiments, and for Cd28−/− n ≥ 3 from one experiment on the BALB/c background and n ≥ 3 from one experiment on the B6 background, see Supplementary Fig. 2, * P < 0.001).
Figure 3
Figure 3. TNFRSF agonists enhance conversion of Treg progenitors to Foxp3+ Treg cells
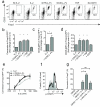
(a,b) Thymii from six- to eight-week old female or male Foxp3-GFP mice were harvested, pooled, and depleted of CD8SP, DP, and non-T cells prior to sorting purified CD4+CD25+Foxp3-GFP Treg progenitors. Sorted cells were incubated in culture with or without IL-2 (1 U/mL) and 100 nM of the indicated TNFRSF agonists for 72 hours prior to flow cytometric analysis to determine the fraction of cells that acquired Foxp3-GFP during the course of the incubation (mean ± SEM from three independent experiments, n = 3, * P < 0.05). (c) The expression of CD25 amongst Foxp3-GFP Treg progenitors after stimulation with IL-2 and GITR-L–Fc is plotted as fold change in geometric mean fluorescence intensity (gMFI) over IL-2 treatment alone (mean ± SEM derived from seven independent experiments, n = 7, * p < 0.05). (d) CD25 expression was measured as gMFI in the Foxp3-GFP+ gate after a 72h stimulation with IL-2 and GITR-L–Fc (mean ± SEM from three independent experiments, n = 3, * P < 0.05). (e) The efficiency of Treg progenitor maturation with or without TNFRSF costimulation in response to a range of IL-2 concentrations is shown (mean ± SEM from three independent experiments, n = 3). (f) Intracellular staining for p-STAT5 was performed after stimulating sorted Treg progenitors with IL-2 and/or TNFRSF agonists for 24 hours. Data are representative of one of two independent experiments (n = 2). (g) Shown are the percentages of sorted Treg progenitors that converted to Foxp3-GFP+ Treg cells during a 72h incubation with IL-2 and GITR-L–Fc or IL-2 and the pan-caspase inhibitor, z-VAD-FMK, using DMSO (v/v) as a vehicle control (mean ± SEM derived from three independent experiments, n = 3, * P < 0.05).
Figure 4
Figure 4. GITR- or OX40-deficiency imposes a modest cell-intrinsic thymic Treg developmental block
Bone marrow was harvested from 8-12 week old female or male (a) Gitr −/− or (b) Ox40 −/− mice (CD45.2; also known as Tnfrsf18 and Tnfrsf4, respectively) and age- and sex-matched congenic recipients and depleted of mature lymphocytes. Donor cells were mixed prior to engraftment into sublethally irradiated adult Rag2 −/− mice by IV injection. Ten to 18 weeks later thymii and spleen were analyzed for Treg development and homeostasis by flow cytometry. (a,b) Shown are the percentages of CD45.2+ vs. CD45.1+ cells occupying gates that identify conventional T cells (CD25Foxp3), Treg progenitors (CD25+Foxp3), and mature thymic Treg cells (CD25+Foxp3+) normalized to the ratio of CD45.2+ vs. CD45.1+ within total CD4SP thymocytes. Results in panel a are from 10 individual chimeras from two independent experiments; results in panel b are from 12 individual chimeras from three separate experiments (mean ± SEM, P < 0.05 values calculated by ANOVA with Bonferroni’s multiple comparison test).
Figure 5
Figure 5. Antibody neutralization of TNFSF members in thymic organ cultures inhibits Treg development and the acquisition of maturation markers
Neonatal Foxp3-GFP thymic lobes from one day-old pups were separated and plated in organ cultures with isotype controls or neutralizing antibodies to GITR-L, OX40-L, and CD70, or the combination of anti-GITR-L, OX40-L, CD70, and TNFR2. After 14 days, lobes were dissociated and Treg development was analyzed by flow cytometry. (a) A representative comparison of CD4SP thymocytes from isotype- vs. antibody-treated thymic lobes is shown. (b) Shown are the percentages of CD25+Foxp3+ Treg cells amongst total CD4SP thymocytes (mean ± SEM, n=21 over four experiments for isotype controls, n=16 over three experiments for anti-GITR-L, OX40-L, and TNF; n=5 over two experiments for anti-GITR-L, OX40-L, CD70, and TNFR2; * p < 0.05 calculated by ANOVA with Bonferroni’s multiple comparison test). (c,d) The expression of CD25, Foxp3, CD73, and FR4 expression in CD4+Foxp3+ cells from TOCs treated with isotype control antibodies- (solid gray) or TNFSF neutralizing Abs treated (open black) is displayed in the histograms and corresponding bar graphs below (n=16 from three independent experiments, mean ± SEM). P-values were generated using paired, two-tailed T tests ( * P < 0.0001).
Figure 6
Figure 6. GITR, OX40, and TNFR2 redundantly drive Treg development in vivo
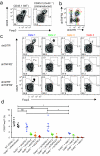
(a) Bone marrow from 8-12 week old male or female CD45.2+ Ox40 −/− mice was harvested and prestimulated with IL-3, IL-6, and SCF prior to retroviral transduction with vectors encoding dominant negative GITR (dnGITR) and TNFR2 (dnTNFR2). Cells were mixed with congenically marked CD45.1+ control marrow and engrafted into adult sublethally irradiated Rag-deficient hosts for 10-12 weeks prior to analysis by flow cytometry. Representative flow cytometry plots derived by gating on CD45.1 WT or CD45.2 (Ox40−/−) cells which were negative for GFP and Thy1.1 (untransduced) show the percentages of CD25Foxp3 conventional CD4SP cells, CD25+Foxp3 Treg progenitors, and CD25+Foxp3+ Treg cells amongst CD4SP thymocytes. (b) To evaluate dose-dependent effects of inhibiting multiple TNFRSF on Treg development, Ox40−/− (CD45.2+) thymocytes were plotted for their expression of dnGITR (GFP) and dnTNFR2 (Thy1.1) and gates were drawn on cells expressing increasing levels of GFP, Thy1.1, or both. Gates are labeled 1 through 4 and colored in blue, green, orange, and red, respectively. (c) Cells derived from gates in panel (b), representing increasing expression of dnGITR, dnTNFR2, or both, were evaluated for CD25 and Foxp3 expression to determine the frequencies of conventional CD4SP, Treg progenitors, and mature Treg cells within each gate (d) Cumulative data from one of three independent experiments are shown in the scatter plot below (mean ± SEM, n=6, * P < 0.05 as determined by 1-way ANOVA using Bonferroni’s multiple comparison test). For a summary table of all statistical comparisons see Supplementary Table 1.
Figure 7
Figure 7. Excess TNFSF ligand broadens the Treg repertoire to contain a greater fraction of cells with a lower affinity for self
(a) Treg progenitors from 6-8 week old female or male Foxp3-RFP × Nur77-GFP dual reporter mice were isolated by cell sorting and stimulated in culture for 72h with 1 U/ml IL-2 and increasing concentrations of agonist GITR-L–Fc. Shown are stacked histograms displaying Nur77-GFP levels amongst converted Foxp3-RFP+ Treg cells. (b) Cumulative data from three independent experiments (n = 3) show a dose-dependent relationship between GITR-L–Fc concentration (x-axis) and the Nur77-GFP MFI (y-axis) within converted Foxp3-RFP+ Treg cells (as normalized to the value obtained with IL-2 treatment alone; mean ± SEM, n=3).

References

    1. Klein L, Hinterberger M, Wirnsberger G, Kyewski B. Antigen presentation in the thymus for positive selection and central tolerance induction. Nat Rev Immunol. 2009;9:833–844. - PubMed
    1. Stritesky GL, Jameson SC, Hogquist KA. Selection of self-reactive T cells in the thymus. Annu Rev Immunol. 2012;30:95–114. - PMC - PubMed
    1. Brunkow ME, et al. Disruption of a new forkhead/winged-helix protein, scurfin, results in the fatal lymphoproliferative disorder of the scurfy mouse. Nat Genet. 2001;27:68–73. - PubMed
    1. Wildin RS, et al. X-linked neonatal diabetes mellitus, enteropathy and endocrinopathy syndrome is the human equivalent of mouse scurfy. Nat Genet. 2001;27:18–20. - PubMed
    1. Yamanouchi J, et al. Interleukin-2 gene variation impairs regulatory T cell function and causes autoimmunity. Nat Genet. 2007;39:329–337. - PMC - PubMed

Publication types

MeSH terms

Substances