. 2014 Apr;32(4):341-6.
doi: 10.1038/nbt.2850. Epub 2014 Mar 16.

Genome-guided transcript assembly by integrative analysis of RNA sequence data

Affiliations

Genome-guided transcript assembly by integrative analysis of RNA sequence data

Nathan Boley et al. Nat Biotechnol. 2014 Apr.

Abstract

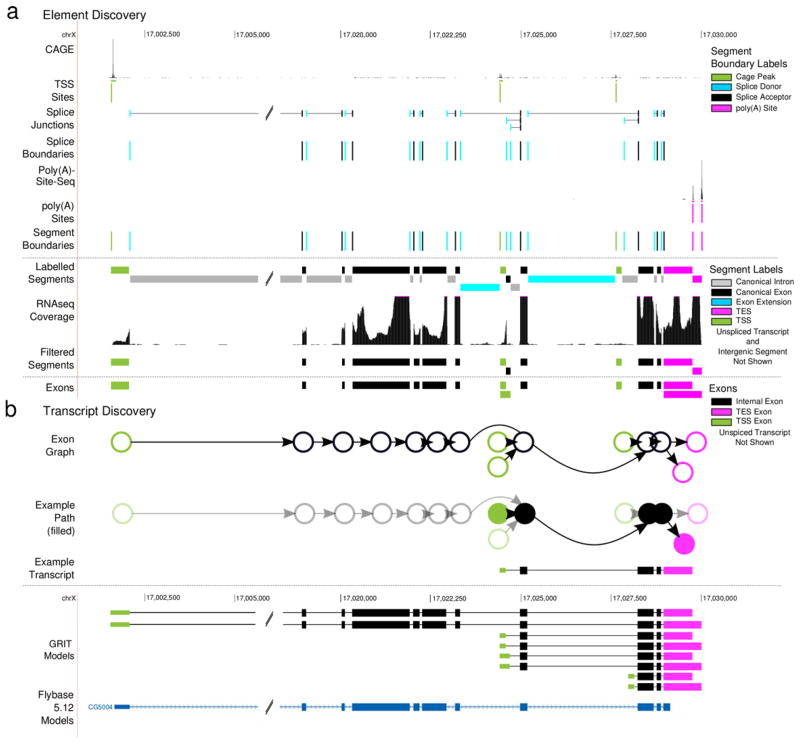
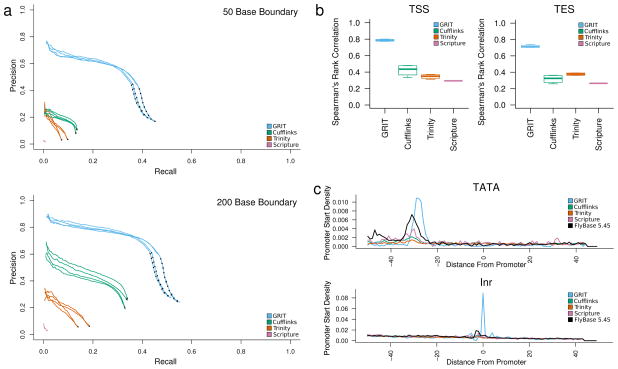
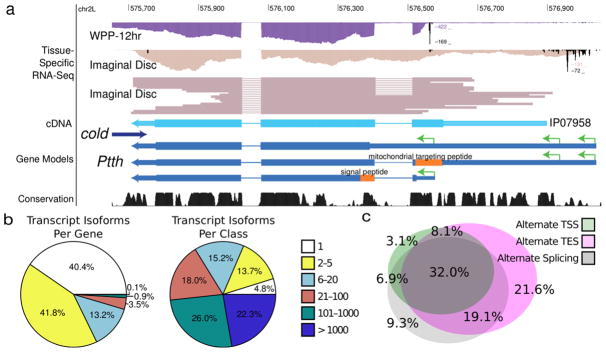
The identification of full length transcripts entirely from short-read RNA sequencing data (RNA-seq) remains a challenge in the annotation of genomes. Here we describe an automated pipeline for genome annotation that integrates RNA-seq and gene-boundary data sets, which we call Generalized RNA Integration Tool, or GRIT. Applying GRIT to Drosophila melanogaster short-read RNA-seq, cap analysis of gene expression (CAGE) and poly(A)-site-seq data collected for the modENCODE project, we recovered the vast majority of previously annotated transcripts and doubled the total number of transcripts cataloged. We found that 20% of protein coding genes encode multiple protein-localization signals and that, in 20-d-old adult fly heads, genes with multiple polyadenylation sites are more common than genes with alternative splicing or alternative promoters. GRIT demonstrates 30% higher precision and recall than the most widely used transcript assembly tools. GRIT will facilitate the automated generation of high-quality genome annotations without the need for extensive manual annotation.


Conflict of interest statement

Competing financial interests

The authors declare no competing financial interests.

Figures

Figure 1
Figure 1. Element discovery overview
(a) Exon discovery. For each gene segment we identify CAGE peaks; segment the gene region using the CAGE peaks, splice boundaries and poly(A) sites; label the segments based upon their boundaries; filter intron segments with low RNA-seq coverage; and build labeled exons from adjacent segments. (b) Transcript discovery. For each gene, we construct a graph where each node is an exon discovered in (b), and each edge is a junction. Then, each candidate transcript is identified with a single path through this directed graph that begins with TSS node, and ends with a TES node.
Figure 2
Figure 2. Comparison with existing tools
(a) Recall and precision analysis. We compared the set of transcript isoforms discovered by GRIT, Cufflinks, Scripture and Trinity to the FlyBase annotation. A transcript was identified as a match if the internal structure was the same, and the distal boundaries were, variously, within 50 and 200 bp of one-another. (b) FPKM versus CAGE and poly(A)-site-seq counts. For each sample, we calculated the Spearman rank correlation between estimated transcript FPKMs and raw CAGE and poly(A)-site-seq read counts within 50 bp of each annotated promoter/poly(A) site. (c) Motif analysis. For each sample, we considered the sequence within 50 bp of annotated promoters. A position was considered a TATA motif hit if it matched the sequence “T-A-T-A-A”, and an Inr motif match if it matched the sequence “C/T-C/T-A-N-A/T-C/T-C/T”. The plots are aligned with respect to the first base in the annotated promoter, and plot the fraction of promoters that contain a motif match at each position, averaged over replicates.
Figure 3
Figure 3. GRIT annotation of D. Melanogaster
(a) Ptth. The Ptth gene encodes isoforms with multiple proteins due to alternative N-terminal splicing as well as promoter usage. The sample labeled “Imaginal Disc” corresponds to mass isolated tissues enriched more than 50% for imaginal discs. (b) Gene complexity. Although most genes have less than five isoforms, nearly half of transcript isoforms originate in genes that encode 100 or more distinct transcripts. (c) Sources of gene complexity. The Venn digram represents the 59.6% of genes that encode multiple transcript isoforms.

References

    1. Wang Z, Gerstein M, Snyder M. RNA-Seq: a revolutionary tool for transcriptomics. Nature Reviews Genetics. 2009;10 (1):57–63. - PMC - PubMed
    1. Graveley BR, et al. The developmental transcriptome of Drosophila melanogaster. Nature. 2010;471 (7339):473–479. - PMC - PubMed
    1. Mortazavi A, Williams BA, McCue K, Schaeffer L, Wold B. Mapping and quantifying mammalian transcriptomes by RNA-Seq. Nature methods. 2008;5 (7):621–628. - PubMed
    1. Trapnell C, et al. Transcript assembly and quantification by RNA-Seq reveals unannotated transcripts and isoform switching during cell differentiation. Nature biotechnology. 2010;28 (5):511–515. - PMC - PubMed
    1. Grabherr MG, et al. Full-length transcriptome assembly from RNA-Seq data without a reference genome. Nature biotechnology. 2011;29 (7):644–652. - PMC - PubMed

Publication types

LinkOut - more resources