

doi: 10.1038/nmeth.2883.
Epub 2014 Mar 16.
PyClone: statistical inference of clonal population structure in cancer
Affiliations
- PMID: 24633410
- PMCID: PMC4864026
- DOI: 10.1038/nmeth.2883
Item in Clipboard
PyClone: statistical inference of clonal population structure in cancer
Nat Methods.
2014 Apr.
Abstract
We introduce PyClone, a statistical model for inference of clonal population structures in cancers. PyClone is a Bayesian clustering method for grouping sets of deeply sequenced somatic mutations into putative clonal clusters while estimating their cellular prevalences and accounting for allelic imbalances introduced by segmental copy-number changes and normal-cell contamination. Single-cell sequencing validation demonstrates PyClone's accuracy.
Figures
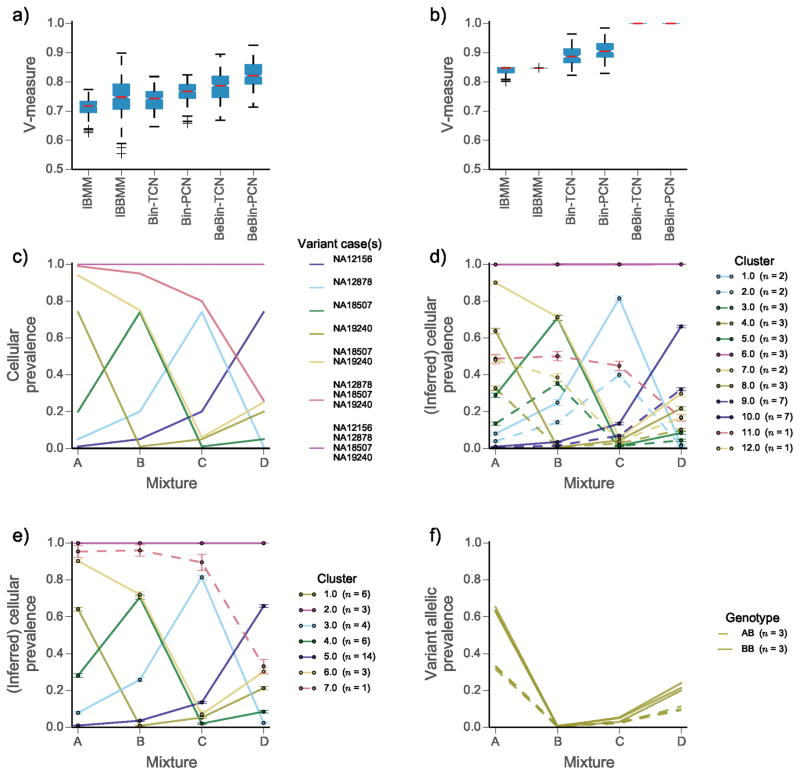
Comparison of clustering performance for the mixture of normal tissues dataset | We compare the infinite Binomial mixture model (IBMM); infinite Beta-Binomial mixture model (IBBMM); PyClone using binomial emission densities and total copy number (Bin-TCN) or parental copy number (Bin-PCN) prior; PyClone using Beta-Binomial emissions and the parental (BeBin-PCN) or total (BeBin-TCN) copy number prior. (a) Comparison of methods when analysing each mixture experiment separately and (b) analysing all four mixtures jointly. (c) Expected cellular prevalence of each cluster across the four mixture experiments. (d) Inferred cellular prevalences and clustering using the IBBMM model and (e) PyClone BeBin-PCN model to jointly analyse all four mixtures. Solid lines (d, e) indicate clusters for which SNVs are predominatly homozygous (BB) and dashed lines indicate clusters for which SNVs are predominatly heterozygous (AB), in the event an equal number of both types of SNVs is present the cluster is drawn as a solid line. (f) Variant allelic prevalence for mutations assigned to cluster 1 by PyClone BeBin-PCN model. Dashed lines represent heterozygous SNVs and solid lines represent homozygous SNVs. (a, b) Whiskers indicate 1.5 the interquartile range, red bars indicate the median, and boxes represent the interquartile range. (d, e) Error bars indicate the mean standard deviation of MCMC cellular prevalences estimates for mutations in a cluster. (d, e, f) The number of mutations n in each cluster is shown in the legend in parentheses.
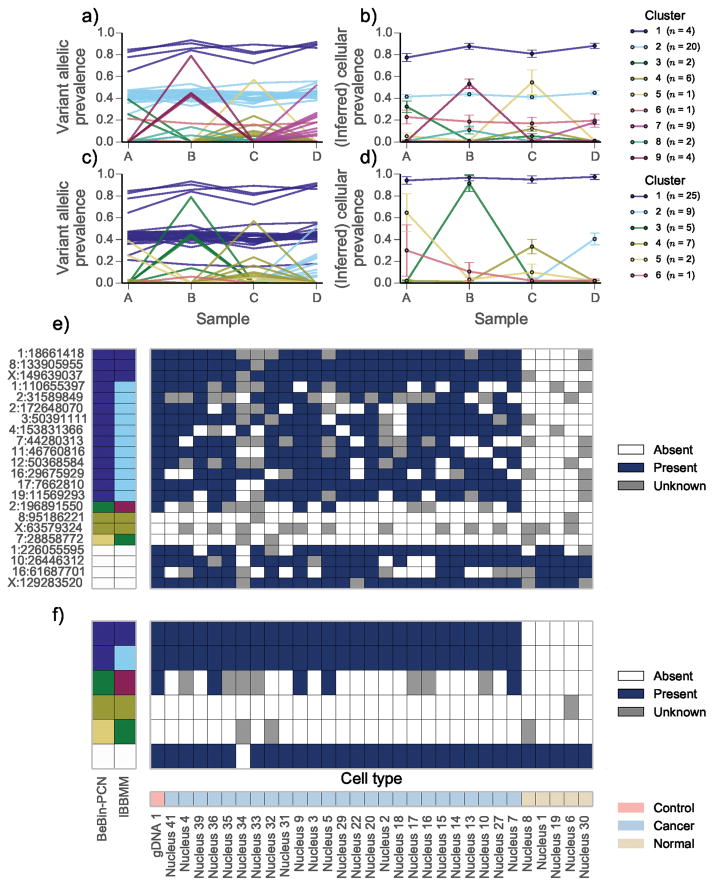
Joint analysis of multiple samples from high grade serous ovarian cancer (HGSOC) 2 | The variant allelic prevalence for each mutation color coded by predicted cluster using the (a) IBBMM and (c) PyClone with BeBin-PCN model to jointly analyse the four samples. The inferred cellular prevalence for each cluster using the (b) IBBMM and (d) BeBin-PCN methods. As in Fig. 1 the cellular prevalence of the cluster is the mean value of the cellular prevalence of mutations in the cluster. (e) Presence or absence of variant allele at target loci in single cells from sample B. Loci with less than 40 reads covering them are coloured gray. Predicted clusters for each method are show on the left, with white cells indicating non-somatic control positions. (f) Presence or absence of IBBMM clusters in single cells from sample B. Clusters were deemed present if any mutation in the cluster was present. (b, d) Error bars indicate the mean standard deviation of MCMC cellular prevalences estimates for mutations in a cluster. The number of mutations n in each cluster is shown in the legend in parentheses.
References
Publication types
MeSH terms
Grants and funding
LinkOut - more resources
Full Text Sources
Other Literature Sources
Molecular Biology Databases
