. 2014 Apr;9(4):311-6.
doi: 10.1038/nnano.2014.32. Epub 2014 Mar 16.

Biogenic gas nanostructures as ultrasonic molecular reporters

Affiliations

Biogenic gas nanostructures as ultrasonic molecular reporters

Mikhail G Shapiro et al. Nat Nanotechnol. 2014 Apr.

Abstract

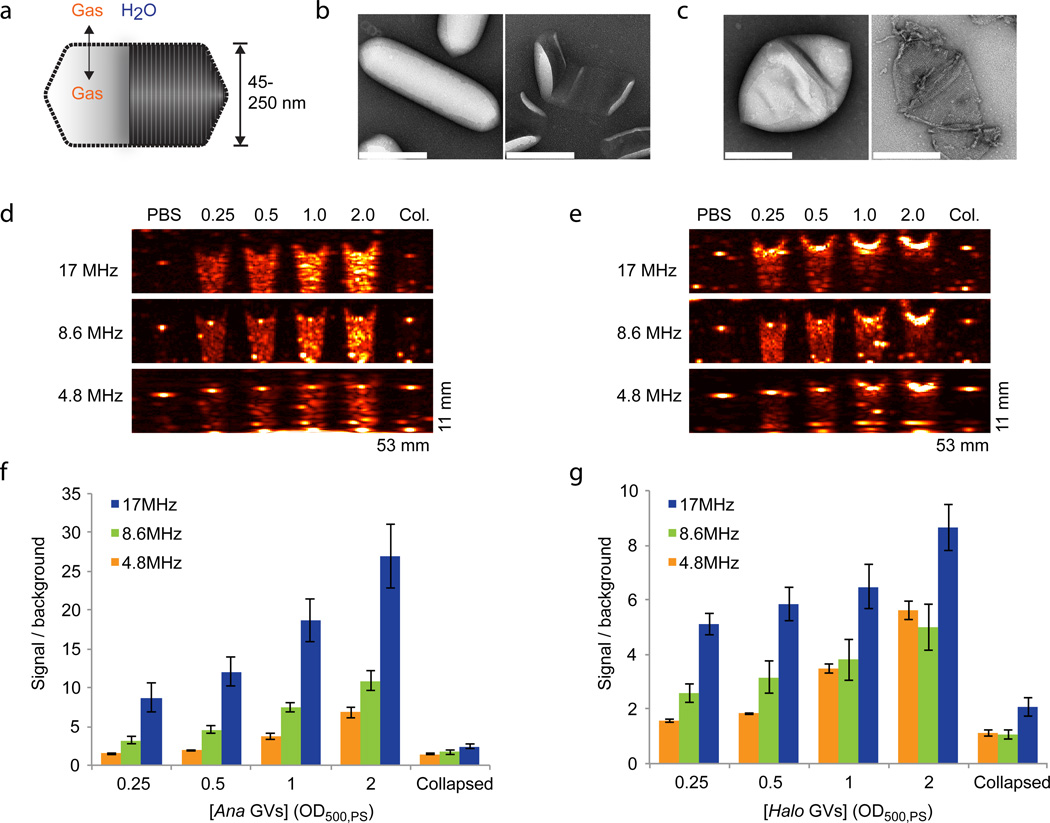
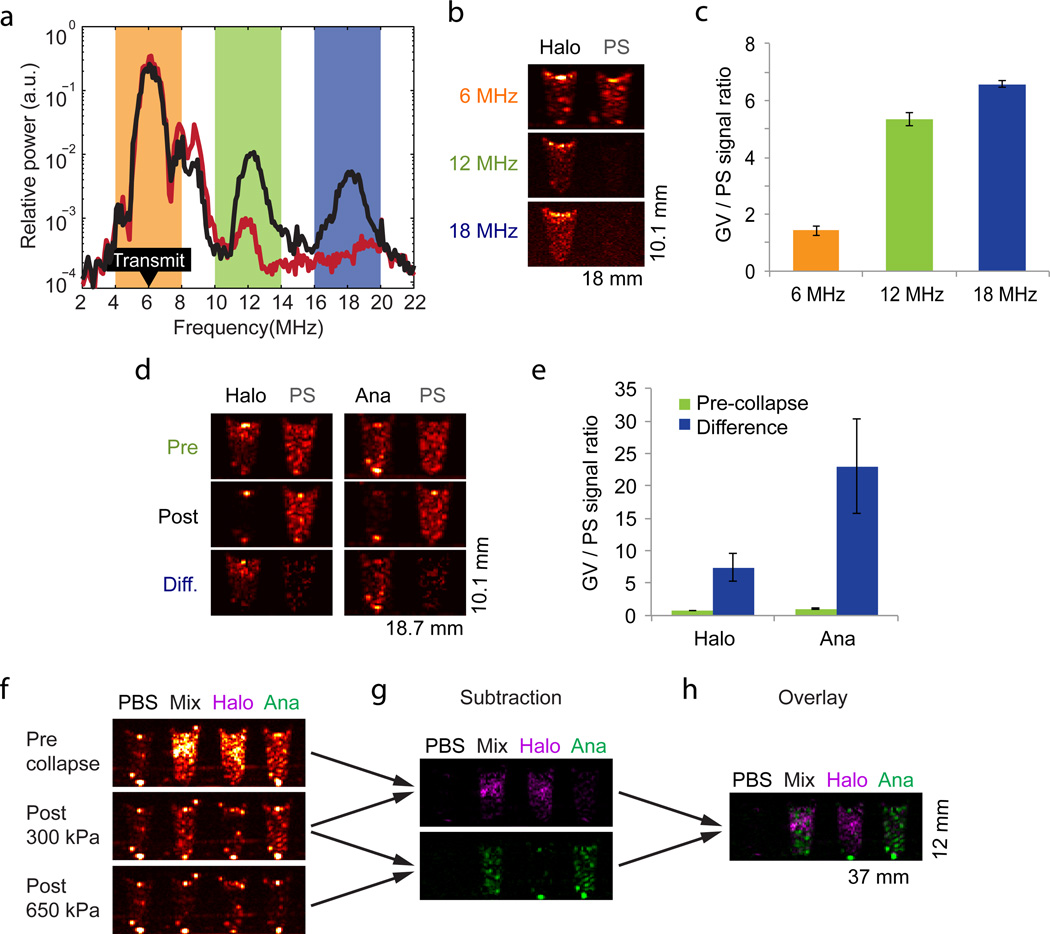
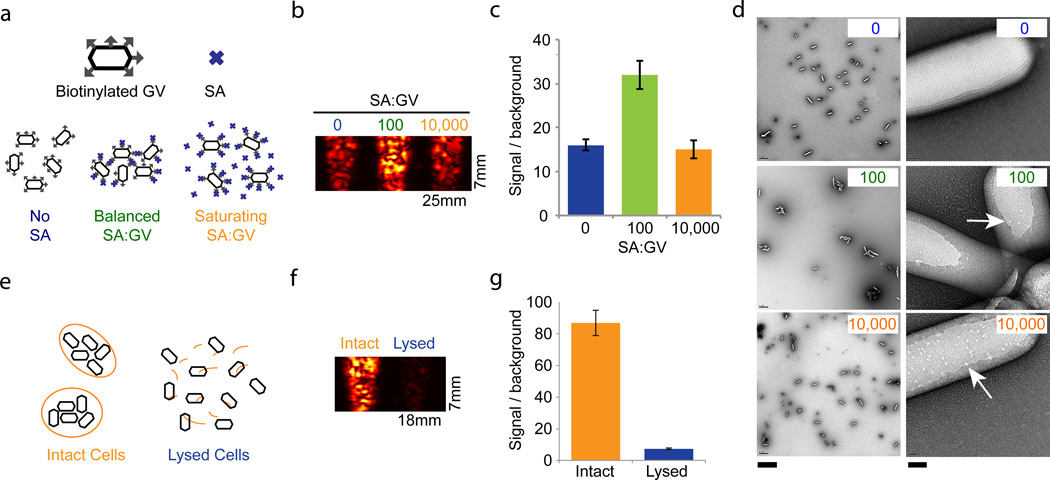
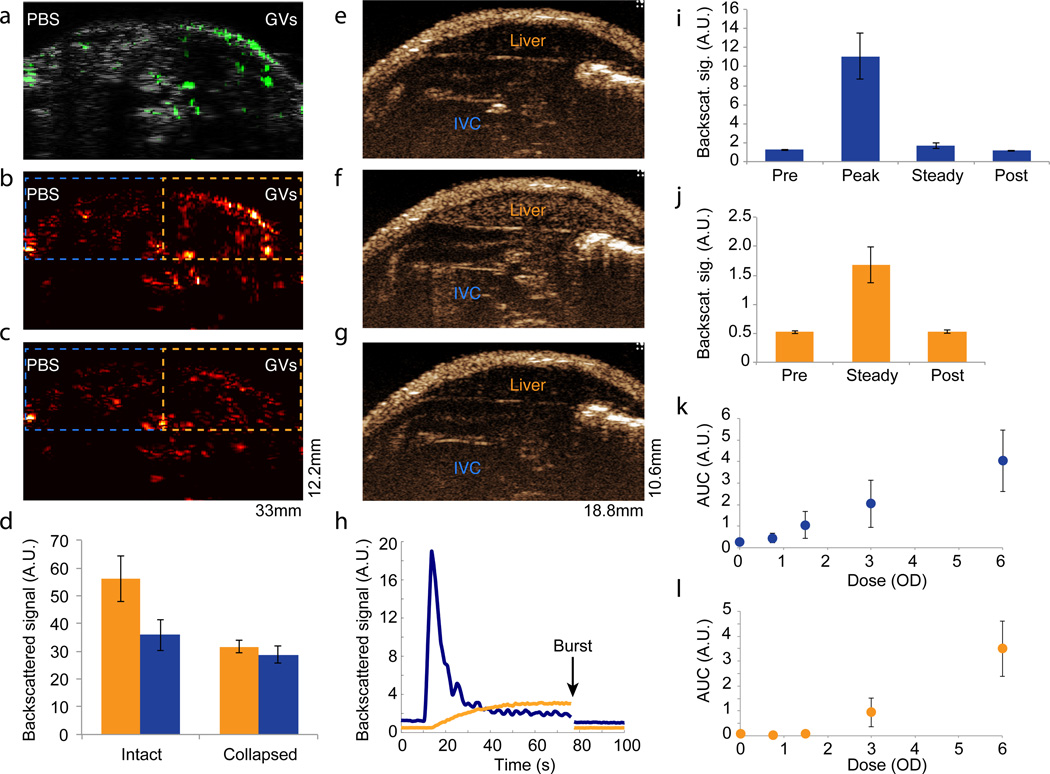
Ultrasound is among the most widely used non-invasive imaging modalities in biomedicine, but plays a surprisingly small role in molecular imaging due to a lack of suitable molecular reporters on the nanoscale. Here, we introduce a new class of reporters for ultrasound based on genetically encoded gas nanostructures from microorganisms, including bacteria and archaea. Gas vesicles are gas-filled protein-shelled compartments with typical widths of 45-250 nm and lengths of 100-600 nm that exclude water and are permeable to gas. We show that gas vesicles produce stable ultrasound contrast that is readily detected in vitro and in vivo, that their genetically encoded physical properties enable multiple modes of imaging, and that contrast enhancement through aggregation permits their use as molecular biosensors.


Figures

Figure 1
Figure 1. Gas vesicles produce ultrasound contrast
a, Diagram of a gas vesicle: a hollow gas nanocompartment (solid shading) surrounded by a gas-permeable protein shell (ribbed shading). b, TEM images of intact (left) and hydrostatically collapsed (right) Ana GVs. c, TEM images of intact (left) and collapsed (right) Halo GVs. All scale bars 200 nm. d, Ultrasound images of a gel phantom containing PBS buffer, Ana GVs at optical densities ranging from OD 0.25 to 2 (concentrations of 150 pM to 1.2 nM) or collapsed Ana GVs (OD 2.0). Images were acquired at multiple frequencies, as indicated. e, Ultrasound images of a gel phantom containing PBS buffer, Halo GVs at optical densities ranging from OD 0.25 to 2 (concentrations of 5 to 40 pM) or collapsed Halo GVs (OD 2.0). Conversion between OD, molar concentration and gas volume fraction is described in the Methods. f, Total backscattered signal relative to PBS at each frequency and Ana GV concentration (N=4 per sample). g, Total backscattered signal relative to PBS at each frequency and Halo GV concentration (N=4 per sample). Detailed image acquisition and analysis parameters are provided in Supplementary Table S1; colour maps for ultrasound images in Supplementary Fig. S9. The size of each field of view is indicated in the lower right corner of the image. All error bars represent ± SEM.
Figure 2
Figure 2. Non-linear imaging and genetic diversity enable enhanced contrast specificity and selective disruption imaging
a, Power spectrum of signal backscattered from Halo GVs (black) and 4.78 µm polystyrene (PS) microspheres (red) in response to 6 MHz transmitted pulses (peak amplitude 98 kPa, labeled “Transmit” in the figure), Each point on the spectrum represents an average of 48 points from 3 samples (16 points per sample). The orange, green and blue highlights correspond to frequency bands used to generate the images in (b). b, Ultrasound images of Halo GVs and PS microspheres acquired with 6 MHz transmission and band-pass filtered around 6, 12 and 18 MHz. c, Ratio of total backscattered signal from Halo GVs and PS microspheres after filtering at the indicated frequencies (N=4). d, Ultrasound images of Halo GVs, Ana GVs and PS microspheres at 8.6MHz acquired before (Pre) and after (Post) destructive collapse with 650 kPa insonation, and the difference (Diff.) between these images. e, Ratio of total backscattered signal from GVs and PS microspheres in pre-collapse and difference images (N=4). The concentrations used in (a)-(e) were OD 0.5 Halo GVs, OD 2.0 Ana GVs and 0.83% w/v polystyrene. f, Ultrasound images of a phantom containing wells with PBS, a mixture of Ana and Halo GVs, or each type of GVs on its own (all GVs at OD 1.0 in PBS), acquired at 8.6 MHz. Top: before collapse. Middle: after collapse at 300 kPa. Bottom: after collapse at 650 kPA. g. Top: difference between the top and middle images in (f), Bottom: difference between the middle and bottom images in (f). h. Overlay of the two images in (g). Detailed image acquisition and analysis parameters are provided in Supplementary Table S1; colour maps for ultrasound images in Supplementary Fig. S9. The size of each field of view is indicated in the lower right corner of the image. All error bars represent ± SEM.
Figure 3
Figure 3. Gas vesicles act as biomolecular sensors and report cellular integrity
a, Illustration of predicted aggregation interactions between surface-biotinylated GVs (hexagons with gray arrows) and streptavidin (SA) at different SA:GV ratios. b, 17 MHz image of OD 1.0 biotinylated Ana GVs mixed with the indicated ratio of SA. c, Integrated signal intensity relative to phantom background corresponding to the SA:GV conditions in (b) (N=4 per condition). d, TEM images of Ana GVs incubated with SA at the indicated molar ratios on the top right hand corner of each panel. At the higher magnification (right), arrows indicate apparent SA molecules on the GV surface. Scale bars 2 µm (left) and 40 nm (right). e, Illustration of GVs (black hexagons) confined inside intact cells (orange) or released following lysis. f, Ultrasound image (17 MHz pulses) of Ana cells treated with water (intact) or with 25% sucrose (lysed). g, Integrated signal intensity relative to phantom background for intact and lysed cells (N=4 per condition). Detailed image acquisition and analysis parameters are provided in Supplementary Table S1; colour bars for ultrasound images in Supplementary Fig. S9. The size of each field of view is indicated in the lower right corner of the image. All error bars represent ± SEM.
Figure 4
Figure 4. Gas vesicles produce ultrasound contrast in vivo
a, Overlay of second harmonic image (6 MHz pulses) in green on a grayscale broadband anatomical image of mouse lower abdomen injected subcutaneously with 150 µL OD 6.0 Halo GVs on the right side and 150uL PBS on the left side. b–c, Second harmonic ultrasound image before (b) and after (c) GV collapse with destructive insonation (650 kPa). Dashed outlines show regions of interest (ROI) used to quantify signals. d. Total back-scatted second harmonic signal from ROIs covering GV-injected (orange) and PBS-injected (blue) tissues, before and after collapse (N=5). e–g. Non-linear contrast images acquired using a high-frequency ultrasound scanner system (operating at 18 MHz and 2% power) of SCID nude mice infused intravenously with 50 µL OD 6.0 Halo GVs. The images show contrast at 4.5 seconds (e) and 64 seconds (f) after the start of infusion, or after the application of a burst pulse (g). The locations of the inferior vena cava (IVC) and liver are indicated with labels. h. Time course of the smoothed average non-linear signal in the IVC (blue) and liver (orange) during infusion. i. Mean average signal intensity in the IVC before (pre) during (peak) and after (steady) infusion, and after the burst pulse (post) (N=5). j. Mean average signal intensity in the liver before (pre) and after (steady) infusion, and after the burst pulse (post) (N=5). k–l. Dose-response relationship of 50 µL Halo GVs infused at OD 0 – 6.0 determined from the area under the curve (AUC) of average contrast in the IVC (k) and liver (l) (N=5). Detailed image acquisition and analysis parameters are provided in Supplementary Table S1; colour maps for ultrasound images in Supplementary Fig. S9. The size of each field of view is indicated in the lower right corner of the image. All error bars represent ± SEM.

Comment in

References

    1. Smith-Bindman R, et al. Use of diagnostic imaging studies and associated radiation exposure for patients enrolled in large integrated health care systems, 1996–2010. JAMA. 2012;307:2400–2409. - PMC - PubMed
    1. Walsby AE. Gas vesicles. Microbiol. Rev. 1994;58:94–144. - PMC - PubMed
    1. Pfeifer F. Distribution, formation and regulation of gas vesicles. Nat. Rev. Microbiol. 2012;10:705–715. - PubMed
    1. Gramiak R, Shah PM, Kramer DH. Ultrasound cardiography - contrast studies in anatomy and function. Radiology. 1969;92:939–948. - PubMed
    1. Ferrara K, Pollard R, Borden M. Ultrasound microbubble contrast agents: fundamentals and application to gene and drug delivery. Annu. Rev. Biomed. Eng. 2007;9:415–447. - PubMed

Publication types

MeSH terms