

Race/ethnicity, nativity and trends in BMI among U.S. adults
- PMID: 24634406
- PMCID: PMC4545289
- DOI: 10.1002/oby.20744
Race/ethnicity, nativity and trends in BMI among U.S. adults
Abstract
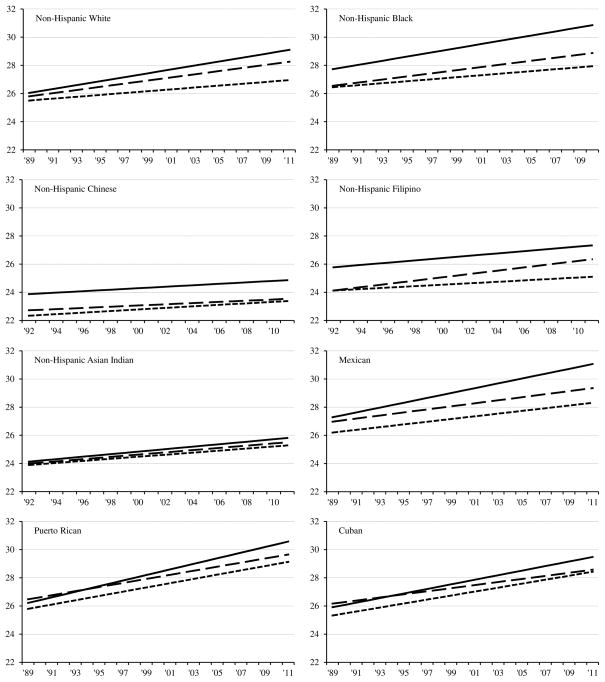
Objective: The average BMI is rising even as the U.S. population grows increasingly diverse. Prior research by examining BMI trends in diverse groups including whites, blacks, Chinese, Filipinos, Asian Indians, Mexicans, Puerto Ricans, and Cubans who are U.S. born, recent immigrants, or long-term immigrants was extended.
Methods: Cross-sectional data from the 1989 to 2011 waves of the National Health Interview Survey (N = 989,273) have been pooled and linear regression models to examine trends in BMI among U.S. adults have been used.
Results: Annual increases in BMI are greatest among U.S.-born Puerto Ricans and Mexicans and slowest among foreign born Chinese. Among the U.S. born in 2011, Chinese adults have an average BMI below the threshold for overweight, whereas blacks, Mexicans, and Puerto Ricans have average BMIs in the obese range. Foreign-born adults average lower BMIs than U.S. born adults in most race/ethnic groups, and nativity disparities generally widen over time. BMI increases across calendar periods rather than birth cohorts.
Conclusion: Our results suggest that calendar period interventions may be particularly useful in reversing rising BMIs in the United States. However, interventions must be tailored to different race/ethnic and nativity groups in order to reduce disparities in body mass.
© 2014 The Obesity Society.
Conflict of interest statement
Figures
References
-
- Health, United States, 2011: with special feature on socioeconomic status and health. National Center for Health Statistics; Hyattsville, MD: 2012. [Accessed 10 December 2012]. http://www.cdc.gov/nchs/data/hus/hus11.pdf. - PubMed
-
- Goel MS, McCarthy EP, Phillips RS, Wee CC. Obesity among US immigrant subgroups by duration of residence. JAMA. 2004;292:2860–2867. - PubMed
-
- Lauderdale DS, Rathouz PJ. Body mass index in a US national sample of Asian Americans: effects of nativity, years since immigration and socioeconomic status. Int J Obes. 2000;24:1188–1194. - PubMed
-
- Lloyd-Jones D, Adams RJ, Brown TM, Carnethon M, Dai S, De Simone G, et al. Heart disease and stroke statistics—2010 update: a report from the American Heart Association. Circulation. 2010;121:e46–e215. - PubMed
Publication types
MeSH terms
Grants and funding
LinkOut - more resources
Full Text Sources
Other Literature Sources
