Clinical Trial
. 2014 Jun;55(6):1150-64.
doi: 10.1194/jlr.M047357. Epub 2014 Mar 16.

Dietary omega-3 fatty acids modulate the eicosanoid profile in man primarily via the CYP-epoxygenase pathway

Affiliations
Clinical Trial

Dietary omega-3 fatty acids modulate the eicosanoid profile in man primarily via the CYP-epoxygenase pathway

Robert Fischer et al. J Lipid Res. 2014 Jun.

Abstract

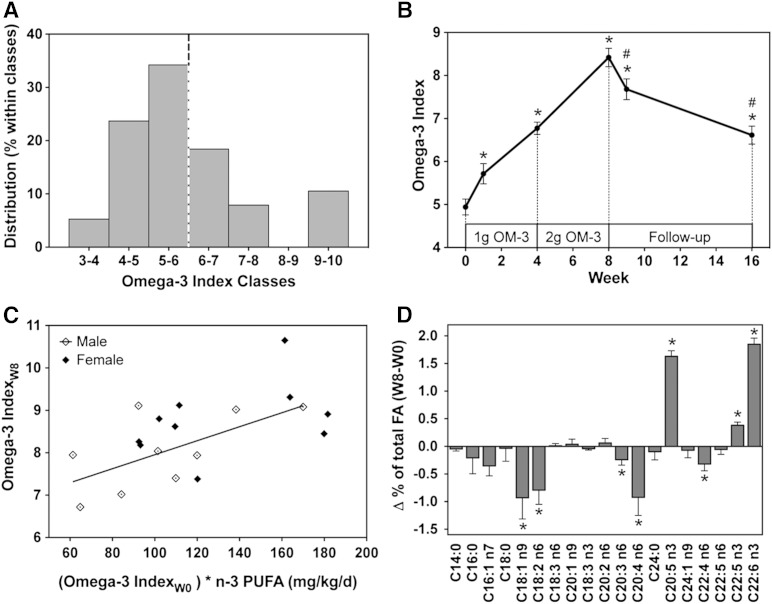
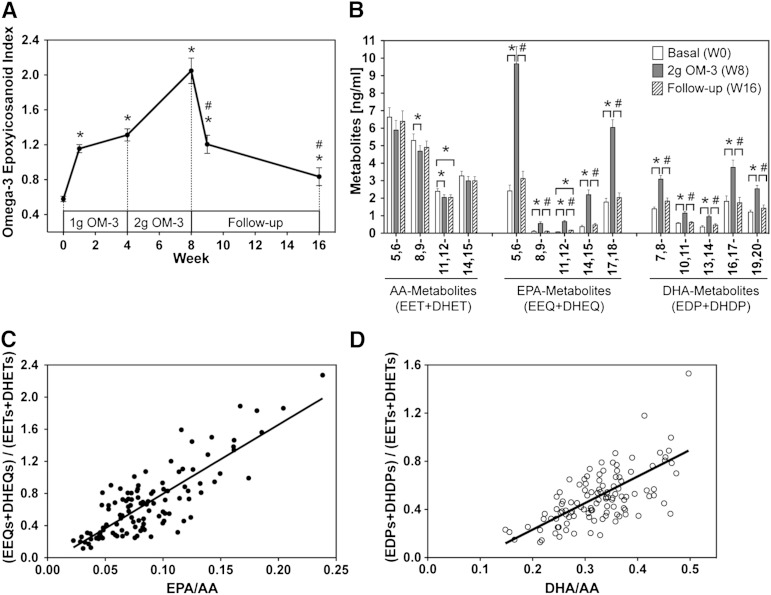
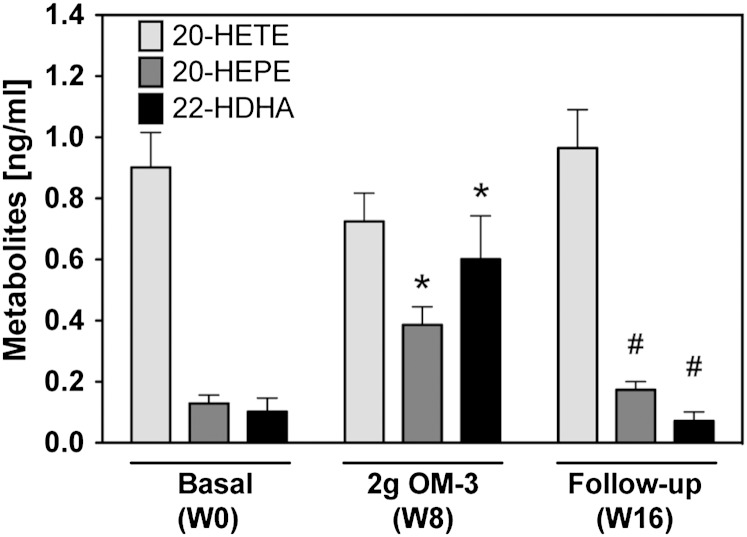
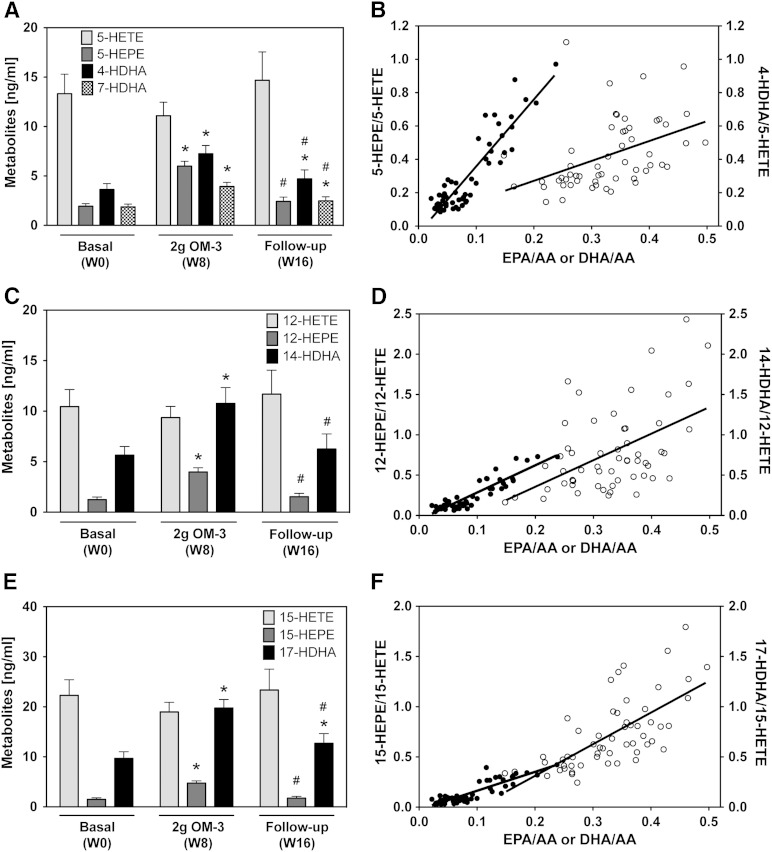
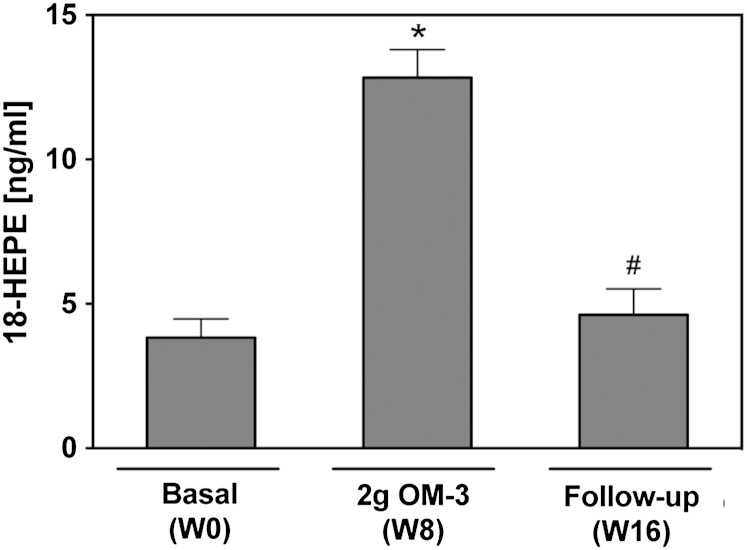
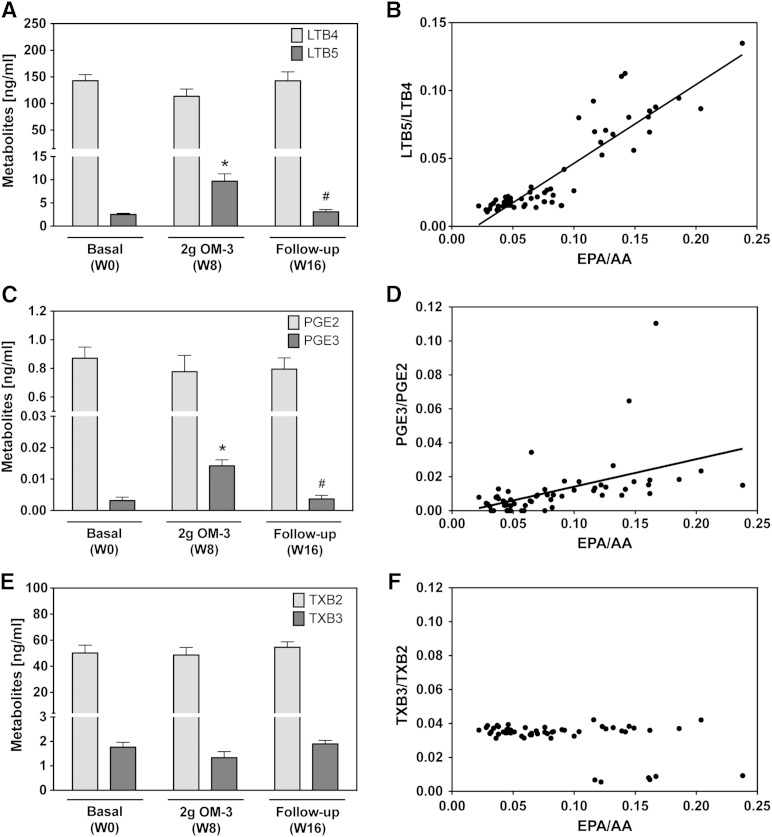
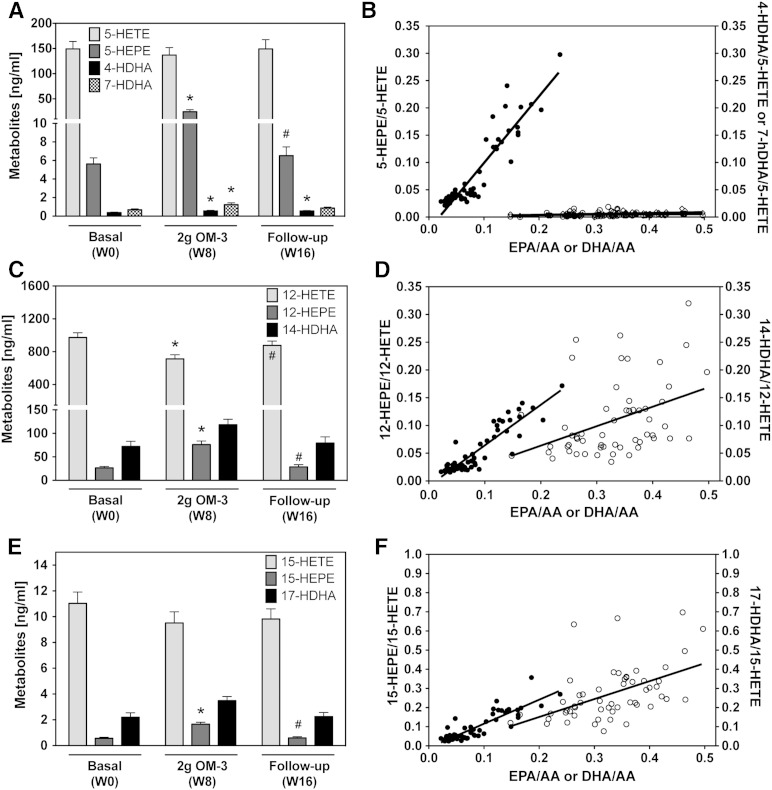
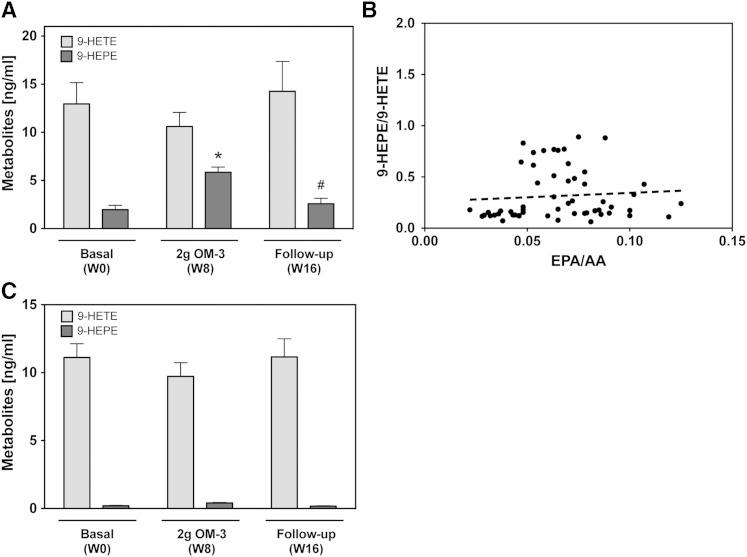
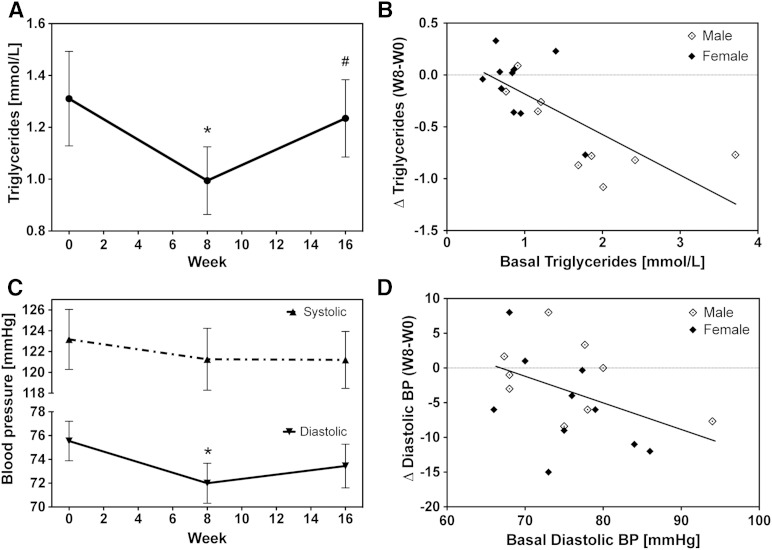
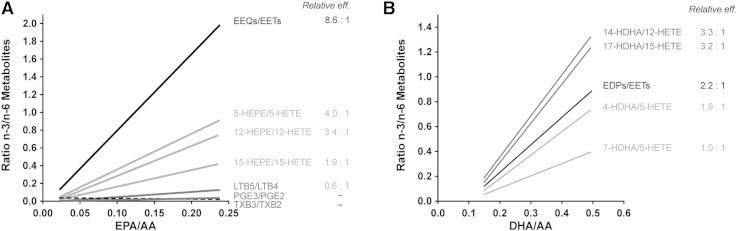
Cytochrome P450 (CYP)-dependent metabolites of arachidonic acid (AA) contribute to the regulation of cardiovascular function. CYP enzymes also accept EPA and DHA to yield more potent vasodilatory and potentially anti-arrhythmic metabolites, suggesting that the endogenous CYP-eicosanoid profile can be favorably shifted by dietary omega-3 fatty acids. To test this hypothesis, 20 healthy volunteers were treated with an EPA/DHA supplement and analyzed for concomitant changes in the circulatory and urinary levels of AA-, EPA-, and DHA-derived metabolites produced by the cyclooxygenase-, lipoxygenase (LOX)-, and CYP-dependent pathways. Raising the Omega-3 Index from about four to eight primarily resulted in a large increase of EPA-derived CYP-dependent epoxy-metabolites followed by increases of EPA- and DHA-derived LOX-dependent monohydroxy-metabolites including the precursors of the resolvin E and D families; resolvins themselves were not detected. The metabolite/precursor fatty acid ratios indicated that CYP epoxygenases metabolized EPA with an 8.6-fold higher efficiency and DHA with a 2.2-fold higher efficiency than AA. Effects on leukotriene, prostaglandin E, prostacyclin, and thromboxane formation remained rather weak. We propose that CYP-dependent epoxy-metabolites of EPA and DHA may function as mediators of the vasodilatory and cardioprotective effects of omega-3 fatty acids and could serve as biomarkers in clinical studies investigating the cardiovascular effects of EPA/DHA supplementation.

Keywords: cytochrome P450; lipidomics; nutrition.


Figures

Fig. 1.
Fig. 1.
Effects of EPA/DHA supplementation on the Omega-3 Index and fatty acid composition in RBCs. A: Frequency distribution of the basal Omega-3 Index in the prescreened group of 38 healthy volunteers. Twenty subjects with an Omega-3 Index ≤6 (dashed line) were included into the study. B: Time- and dose-dependent changes of the Omega-3 Index during the whole course of the study. C: Correlation of the Omega-3 Index achieved after 8 weeks of EPA/DHA supplementation with the product of the baseline Omega-3 Index and the dose per kilogram of body weight. D: Changes in the abundance of individual fatty acids comparing their percentages of total fatty acid in RBCs at week 8 and week 0 of EPA/DHA supplementation. Data are given as mean ± SEM, n = 19. A general linear model for repeated measurements was used for analysis (B, D) and significant changes are indicated as: *P < 0.05 versus basal level [week 0 (W0)] and #P < 0.05 versus maximum treatment [week 8 (W8)]. For dosage dependency (C), a Pearson correlation was performed: r = 0.599, P < 0.01.
Fig. 2.
Fig. 2.
Effect of EPA/DHA supplementation on the profile of circulating CYP-epoxygenase metabolites. A: Time- and dose-dependent changes of the CYP-epoxyeicosanoid index during the whole course of the study. B: Regioisomeric composition of epoxygenase products derived from AA, EPA, and DHA at baseline [week 0 (W0)], after maximal EPA/DHA supplementation [week 8 (W8)], and after discontinuation of supplementation [week 16 (W16)]. C: Correlation of the relative plasma levels of EPA- and AA-derived metabolites with the EPA/AA precursor fatty acid ratio. D: Correlation of the relative plasma levels of DHA- and AA-derived metabolites with the DHA/AA precursor fatty acid ratio. Metabolite levels are given as the sum of the primary CYP-epoxygenase products and the corresponding vicinal diols produced by sEH-mediated hydrolysis of the primary epoxides. Total metabolite levels (free + esterified) were determined after alkaline hydrolysis. Data are given as mean ± SEM, n = 19. A general linear model for repeated measurements was used for analysis (A, B) and significant changes are indicated as: *P < 0.05 versus basal level (W0) and #P < 0.05 versus maximum treatment (W8). For relative efficiencies, a Pearson correlation was performed: y = 8.60x − 0.06; r = 0.826 with P < 0.001 (C) and y = 2.21x − 0.21; r = 0.587 with P < 0.001 (D).
Fig. 3.
Fig. 3.
Effect of EPA/DHA supplementation on the plasma levels of CYP-ω-hydroxylase metabolites derived from AA (20-HETE), EPA (20-HEPE), and DHA (22-HDHA). Metabolite levels were determined after alkaline hydrolysis and thus represent the sum of free and esterified metabolites. Bars show mean ± SEM, n = 19. A general linear model for repeated measurements was used for analysis and significant changes are indicated as: *P < 0.05 versus basal level [week 0 (W0)] and #P < 0.05 versus maximum treatment [week 8 (W8)].
Fig. 4.
Fig. 4.
Effect of EPA/DHA supplementation on the plasma levels of LOX-dependent monohydroxy-metabolites. A, B: Plasma levels of 5-LOX-dependent metabolites derived from AA (5-HETE), EPA (5-HEPE), and DHA (4-HDHA and 7-HDHA) and their relative abundance in correlation with the corresponding precursor fatty acid ratios (filled circles for EPA/AA; open circles for DHA/AA). C, D: Plasma levels of 12-LOX-dependent metabolites derived from AA (12-HETE), EPA (12-HEPE), and DHA (14-HDHA) and their relative abundance in correlation with the corresponding precursor fatty acid ratios (filled circles for EPA/AA; open circles for DHA/AA). E, F: Plasma levels of 15-LOX-dependent metabolites derived from AA (15-HETE), EPA (15-HEPE), and DHA (17-HDHA) and their relative abundance in correlation with the corresponding precursor fatty acid ratios (filled circles for EPA/AA; open circles for DHA/AA). Metabolite levels were determined after alkaline hydrolysis and thus represent the sum of free and esterified metabolites. Bars show mean ± SEM, n = 19. A general linear model for repeated measurements was used for analysis (A, C, E) and significant changes are indicated as: *P < 0.05 versus basal level [week 0 (W0)] and #P < 0.05 versus maximum treatment [week 8 (W8)]. For relative efficiencies a Pearson/Spearman Rho correlation was performed: 5-HEPE/5-HETE, y = 4.02x − 0.04, r = 0.790 with P < 0.001 and 4-HDHA/5-HETE, y = 1.89x − 0.20, r = 0.696 with P < 0.001 (B); 12-HEPE/12-HETE, y = 3.37x − 0.05, r = 0.821 with P < 0.001 and 14-HDHA/12-HETE, y = 3.30x − 0.30; r = 0.493 with P < 0.001 (D); and 15-HEPE/15-HETE, y = 1.87x − 0.02, r = 0.795 with P < 0.001 and 17-HDHA/15-HETE, y = 3.15x − 0.32, r = 0.688 with P < 0.001 (F).
Fig. 5.
Fig. 5.
Effect of EPA/DHA supplementation on 18-HEPE formation. Total plasma levels of 18-HEPE were determined after alkaline hydrolysis. Data are given as mean ± SEM, n = 19. A general linear model for repeated measurements was used for analysis and significant changes are indicated as: *P < 0.05 versus basal level [week 0 (W0)] and #P < 0.05 versus maximum treatment [week 8 (W8)].
Fig. 6.
Fig. 6.
Effect of EPA/DHA supplementation on leukotriene and prostanoid formation after calcium ionophore stimulation. The levels of free metabolites were determined after A23187-mediated stimulation of whole blood samples and thus reflect the metabolic capacity and substrate specificity of the corresponding enzymes expressed in blood cells. A, B: Generated levels of AA-derived LTB4 and EPA-derived LTB5 and the relative abundance of LTB5 and LTB4 in correlation with the EPA/AA precursor fatty acid ratio. C, D: Levels of AA-derived PGE2 and EPA-derived PGE3 and the relative abundance of PGE3 and PGE2 in correlation with the EPA/AA precursor fatty acid ratio. E, F: Levels of AA-derived TXB2 and EPA-derived TXB3 and the relative abundance of TXB3 and TXB2 in correlation with the EPA/AA precursor fatty acid ratio. Data are given as mean ± SEM, n = 19. A general linear model for repeated measurements was used for analysis (A, C, E) and significant changes are indicated as: *P < 0.05 versus basal level [week 0 (W0)] and #P < 0.05 versus maximum treatment [week 8 (W8)]. For relative efficiencies, a Pearson/Spearman Rho correlation was performed: LTB5/LTB4, y = 0.58x − 0.01, r = 0.864 with P < 0.001 (B); PGE3/PGE2, y = 0.16x − 0.002, r = 0.712 with P < 0.001 (D); TXB3/TXB2 no correlation (F).
Fig. 7.
Fig. 7.
Calcium ionophore stimulated monohydroxy-metabolite formation via LOX enzymes. Shown is the formation of free metabolites via 5-LOX (A), 12-LOX (C) and 15-LOX (E) enzymes in whole blood samples at baseline [week 0 (W0)], after maximal EPA/DHA-supplementation [week 8 (W8)], and after discontinuation of supplementation [week 16 (W16)]. Bars represent mean ± SEM, n = 19. A general linear model for repeated measurements was used for analysis (A, C, E) and significant changes are indicated as: *P < 0.05 versus basal level (W0) and #P < 0.05 versus maximum treatment (W8). For relative efficiencies a Pearson/Spearman Rho correlation was performed: 5-HEPE/5-HETE versus EPA/AA: y = 1.2x − 0.02, r = 0.884 with P < 0.001 and 4-HDHA/5-HETE versus DHA/AA, y = 0.01x − 0.00008, r = 0.351 with P < 0.001; 7-HDHA/5-HETE versus DHA/AA: y = 0.02x − 0.0008, r = 0.421 with P < 0.001 (B). 12-HEPE/12-HETE versus EPA/DHA: y = 0.73x − 0.01, r = 0.857 with P < 0.001 and 14-HDHA/12-HETE versus DHA/AA: y = x − 0.35 − 0.01, r = 0.444 with P < 0.001 (D). 15-HEPE/15-HETE versus EPA/DHA: y = 1.26x − 0.01, r = 0.834 with P < 0.001 and 17-HDHA/15-HETE versus DHA/AA: y = 0.93x − 0.03, r = 0.510 with P < 0.001 (F).
Fig. 8.
Fig. 8.
Effect of EPA/DHA supplementation on the formation of nonenzymatic oxidation products. A: Plasma levels of AA-derived 9-HETE and EPA-derived 9-HEPE at baseline [week 0 (W0)], after maximal EPA/DHA supplementation [week 8 (W8)], and after discontinuation of supplementation [week 16 (W16)]. A general linear model for repeated measurements was used for analysis (A, C) and significant changes are indicated as: *P < 0.05 versus basal level (W0) and #P < 0.05 versus maximum treatment (W8). B: Correlation of the plasma 9-HEPE/9-HETE ratio with the EPA/AA precursor ratio. Metabolite levels in (A) and (B) refer to the total amounts of 9-HETE and 9-HEPE as determined after alkaline hydrolysis. C: Presence of free 9-HETE and 9-HEPE in calcium ionophore treated blood samples.
Fig. 9.
Fig. 9.
Effect of EPA/DHA supplementation on clinical risk factors. Shown are the changes in triglyceride levels (A) and blood pressure (C) and their dependencies on the respective basal levels [(B) and (D), respectively]. Data are given as mean ± SEM, n = 19. A general linear model for repeated measurements was used for analysis (A, C) and significant changes are indicated as: *P < 0.05 versus basal level [week 0 (W0)] and #P < 0.05 versus maximum treatment [week 8 (W8)].
Fig. 10.
Fig. 10.
Comparison of the susceptibilities of the three branches of the human AA-cascade to dietary EPA/DHA supplementation. This figure summarizes the linear correlations obtained for the corresponding metabolite precursor fatty acid pairs. The slopes of the correlation lines were taken as a measure for the relative efficiencies by which EPA and AA (A) or DHA and AA (B) were utilized by the different enzymatic pathways of eicosanoid formation.

References

    1. Konkel A., Schunck W. H. 2011. Role of cytochrome P450 enzymes in the bioactivation of polyunsaturated fatty acids. Biochim. Biophys. Acta. 1814: 210–222. - PubMed
    1. Capdevila J. H., Falck J. R. 2002. Biochemical and molecular properties of the cytochrome P450 arachidonic acid monooxygenases. Prostaglandins Other Lipid Mediat. 68–69: 325–344. - PubMed
    1. Funk C. D. 2001. Prostaglandins and leukotrienes: advances in eicosanoid biology. Science. 294: 1871–1875. - PubMed
    1. Buczynski M. W., Dumlao D. S., Dennis E. A. 2009. Proteomics. An integrated omics analysis of eicosanoid biology. J. Lipid Res. 50: 1015–1038. - PMC - PubMed
    1. Kroetz D. L., Zeldin D. C. 2002. Cytochrome P450 pathways of arachidonic acid metabolism. Curr. Opin. Lipidol. 13: 273–283. - PubMed

Publication types