. 2013 Oct;103(6):2052-2086.
doi: 10.1257/aer.103.6.2052.

Understanding the Mechanisms Through Which an Influential Early Childhood Program Boosted Adult Outcomes

Affiliations

Understanding the Mechanisms Through Which an Influential Early Childhood Program Boosted Adult Outcomes

James Heckman et al. Am Econ Rev. 2013 Oct.

Abstract

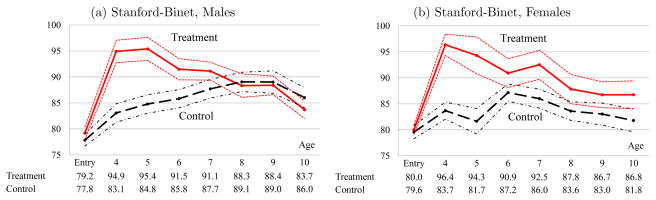
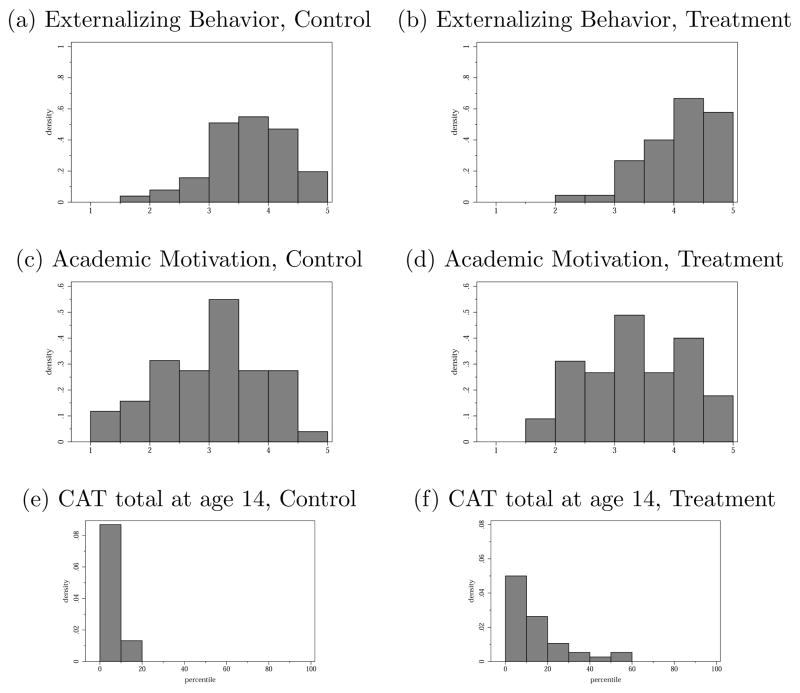
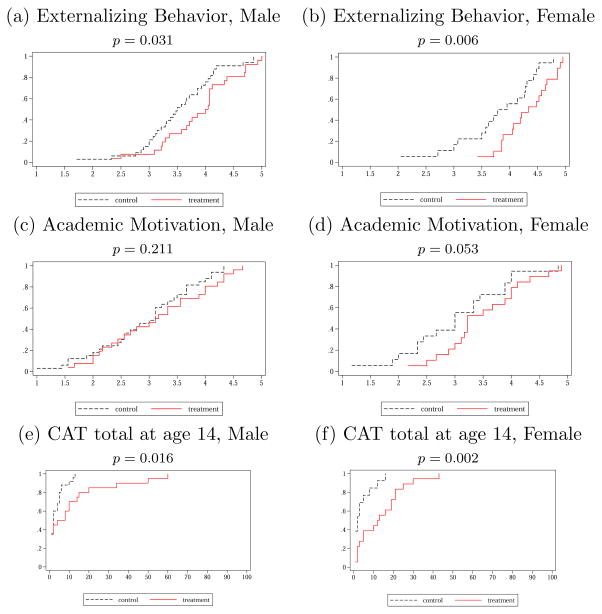
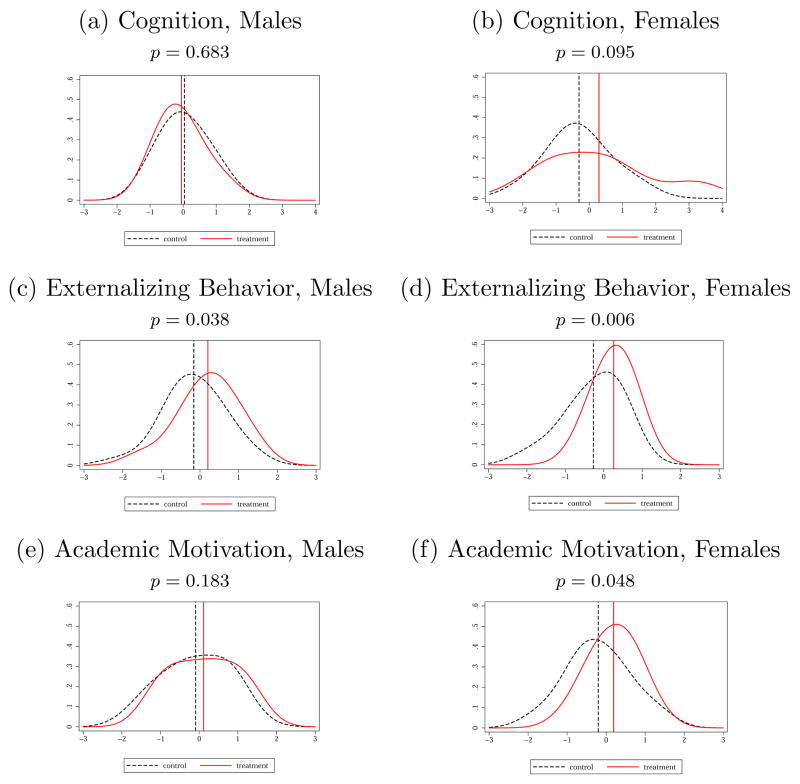
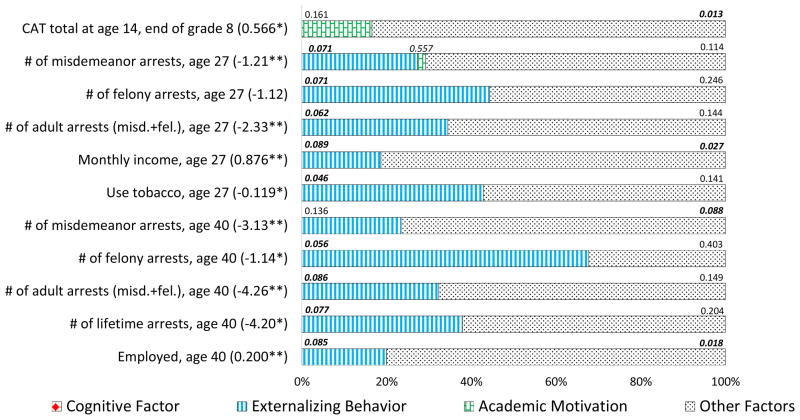
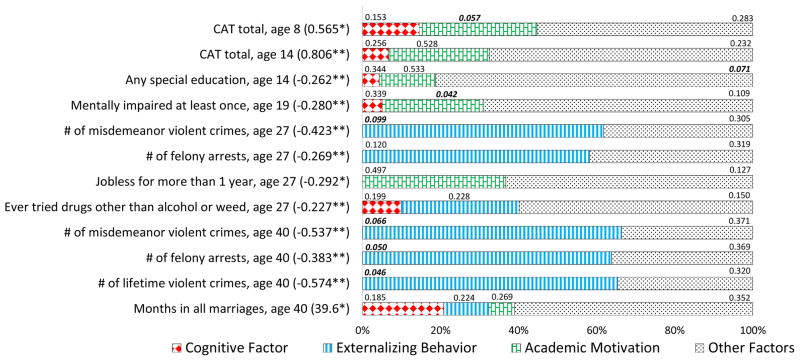
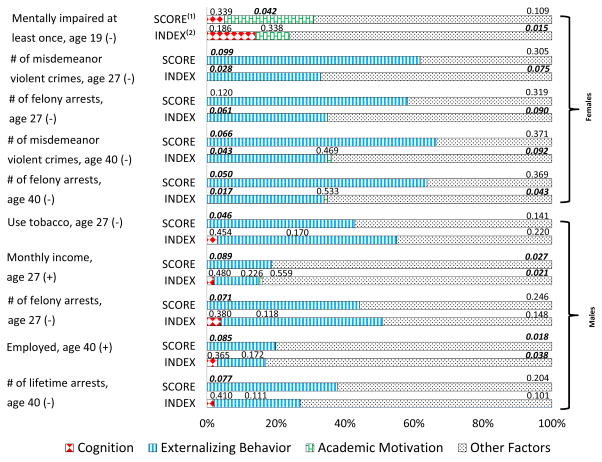
A growing literature establishes that high quality early childhood interventions targeted toward disadvantaged children have substantial impacts on later life outcomes. Little is known about the mechanisms producing these impacts. This paper uses longitudinal data on cognitive and personality traits from an experimental evaluation of the influential Perry Preschool program to analyze the channels through which the program boosted both male and female participant outcomes. Experimentally induced changes in personality traits explain a sizable portion of adult treatment effects.

Keywords: Perry Preschool program; academic motivation; cognitive traits; early childhood interventions; experimentally estimated production functions; externalizing behavior; factor analysis; human capital; human development; personality traits; social experiments.


Figures

Figure 1
Figure 1. Stanford-Binet IQ Test Scores by Gender and Treatment Status
Note: Bold lines display mean IQs. Fine lines represent standard errors for the corresponding means (one standard error above and below). For a detailed description of the cognitive measures and results for other IQ tests, see Web Appendix B. Numbers below each chart are treatment and control mean test scores. See panels (a)–(d) of Figure B.6 of Web Appendix B for comparable graphs on the Leiter and PPVT measures of IQ.
Figure 2
Figure 2. Histograms of Indices of Personality Skills and CAT scores
Note: Indices for Externalizing Behavior and Academic Motivation are unweighted averages of measures listed in Table 2. “CAT” is the California Achievement Test score expressed in percentiles of the general population distribution of the scores. See Web Appendix B.4 for description of the CAT. The one-sided p-values for difference in means between treatments and controls are 0.001, 0.043, and 0.000 for Externalizing Behavior, Academic Motivation, and CAT scores respectively. Histograms are based on the pooled sample of males and females. See Figures C.6 and C.7 of Web Appendix C and Figure B.5 of Web Appendix B for the corresponding gender-specific figures.
Figure 3
Figure 3. Cumulative Distribution Functions of Indices of Personality Skills and CAT scores by Gender
Note: Indices for Externalizing Behavior and Academic Motivation are unweighted averages of measures listed in Table 2. “CAT” is the California Achievement Test score expressed in percentiles of the general population distribution of the scores. Numbers above the charts are one-sided p-values testing the equality of means of the indices for the treatment and control groups.
Figure 4
Figure 4. Spearman’s Rank Correlations between Externalizing Behavior at Ages 7–9 and Number of Arrests by Ages 19, 27, and 40
Note: *** - 1 percent, ** - 5 percent, * - 10 percent significance levels (one-sided tests).
Figure 5
Figure 5. Kernel Densities of Factor Scores
Note: Probability density functions of Bartlett (1937) factor scores are shown. Densities are computed based on a normal kernel. Numbers above the charts are one-sided p-values testing the equality of factor score means for the treatment and control groups. Higher Externalizing Behavior corresponds to more socially desirable behavior. See Web Appendix L for the empirical CDFs of the factor scores (Figure L.5). Vertical lines locate factor score means for treatment and control groups.
Figure 6
Figure 6. Decompositions of Treatment Effects on Outcomes, Males
Note: The total treatment effects are shown in parentheses. Each bar represents the total treatment effect normalized to 100 percent. One-sided p-values are shown above each component of the decomposition. The figure is a slightly simplified visualization of Tables L.10 and L.14 : small and statistically insignificant contributions of the opposite sign are set to zero. See Web Appendix L for detailed information about the simplifications made to produce the figure. “CAT total” denotes California Achievement Test total score normalized to control mean zero and variance of one. Asterisks denote statistical significance: * – 10 percent level; ** – 5 percent level; *** – 1 percent level. Monthly income is adjusted to thousands of year-2006 dollars using annual national CPI.
Figure 7
Figure 7. Decompositions of Treatment Effects on Outcomes, Females
Note: The total treatment effects are shown in parentheses. Each bar represents the total treatment effect normalized to 100 percent. One-sided p-values are shown above each component in each outcome. The figure is a slightly simplified visualization of Tables L.11 and L.15 : small and statistically insignificant contributions of the opposite sign are set to zero. See Web Appendix L for detailed information about the simplifications made to produce the figure. “CAT total” denotes California Achievement Test total score normalized to control mean zero and variance of one. Asterisks denote statistical significance: * – 10 percent level; ** – 5 percent level; *** – 1 percent level.
Figure 8
Figure 8. Decompositions of Treatment Effects by Indices versus Factor Scores
Note: The total treatment effect is normalized to 100 percent. One-sided p-values are shown above each component in each outcome. (1) “SCORE” denotes models where personality traits are measured by factor scores.(1) “INDEX” denotes models where personality traits are measured by indices constructed using unweighted averages over the items. The figure is a slightly simplified visualization of results from Tables L.10, L.11, K.1, and K.2 of the Web Appendix: small and statistically insignificant contributions of the opposite sign are set to zero. See Web Appendix L for detailed information about the simplifications used to produce the figure.

Similar articles

Cited by

References

    1. Achenbach Thomas M. The Child Behavior Profile: I. Boys Aged 6–11. Journal of Consulting and Clinical Psychology in the Schools. 1978;46(3):478–488. - PubMed
    1. Allen Mary J, Yen Wendy M. Introduction to Measurement Theory. Prospect Heights, IL: Waveland Press; 2002.
    1. Almlund Mathilde, Duckworth Angela, Heckman James J, Kautz Tim. Personality Psychology and Economics. In: Hanushek EA, Machin S, Wößmann L, editors. Handbook of the Economics of Education. Vol. 4. Amsterdam: Elsevier; 2011. pp. 1–181.
    1. Almond Douglas, Currie Janet. Human Capital Development before Age Five. In: Ashenfelter Orley, Card David., editors. Handbook of Labor Economics. 4B. North Holland: Elsevier; 2011. pp. 1315–1486. Chapter 15.
    1. Anderson Michael. Multiple Inference and Gender Differences in the Effects of Early Intervention: A Reevaluation of the Abecedarian, Perry Preschool and Early Training Projects. Journal of the American Statistical Association. 2008;103(484):1481–1495.

LinkOut - more resources