

A Source Apportionment of U.S. Fine Particulate Matter Air Pollution
- PMID: 24634604
- PMCID: PMC3951912
- DOI: 10.1016/j.atmosenv.2011.04.070
A Source Apportionment of U.S. Fine Particulate Matter Air Pollution
Abstract
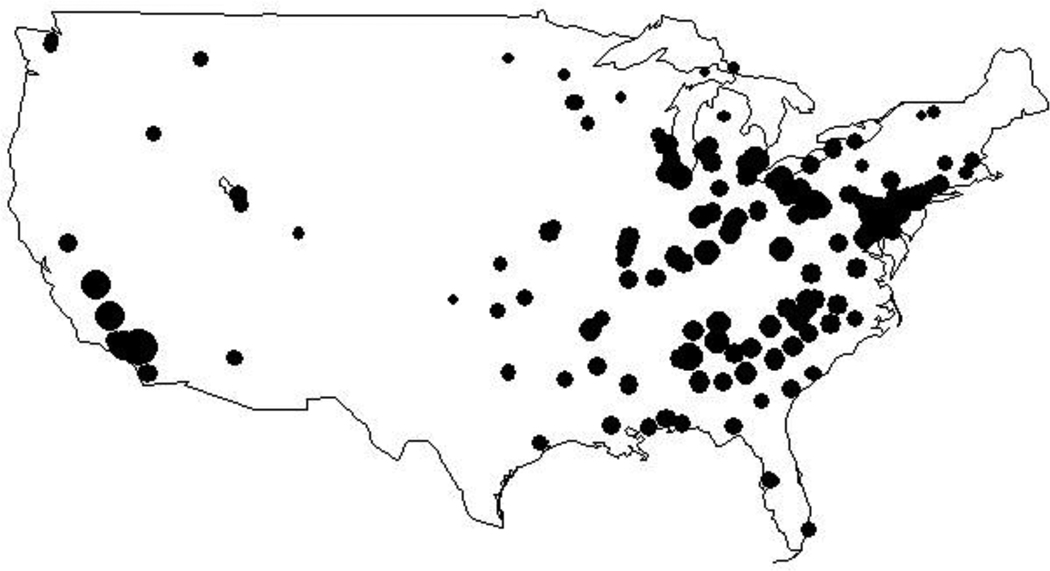
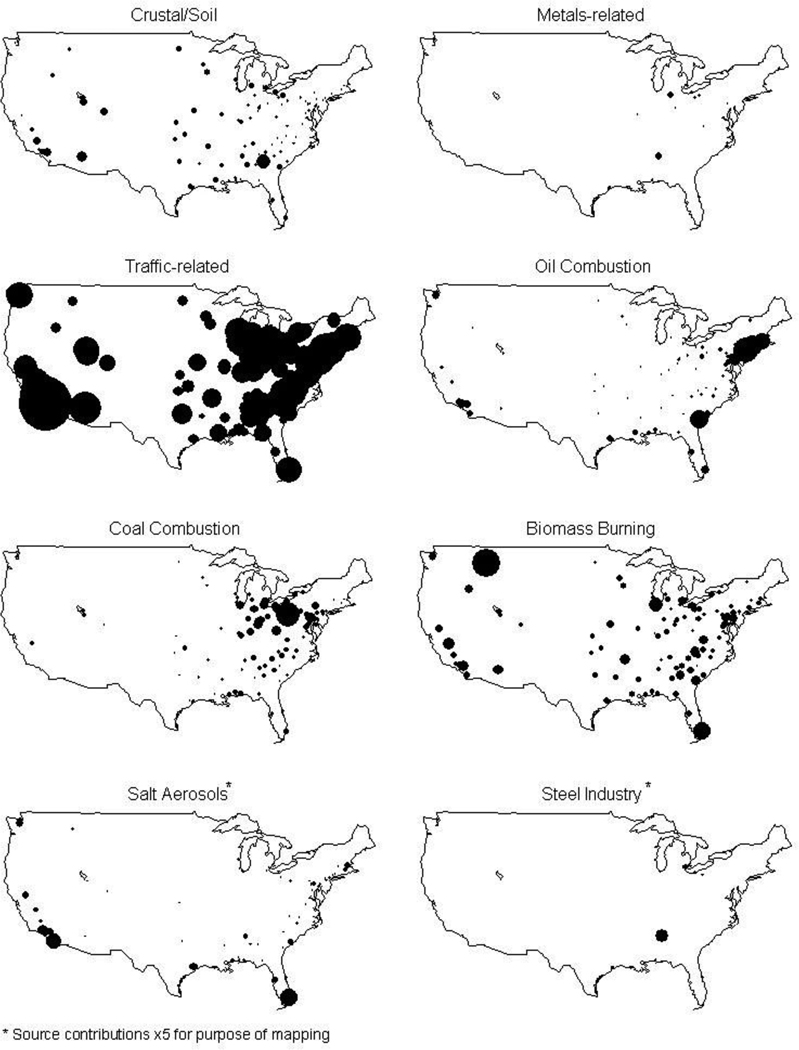
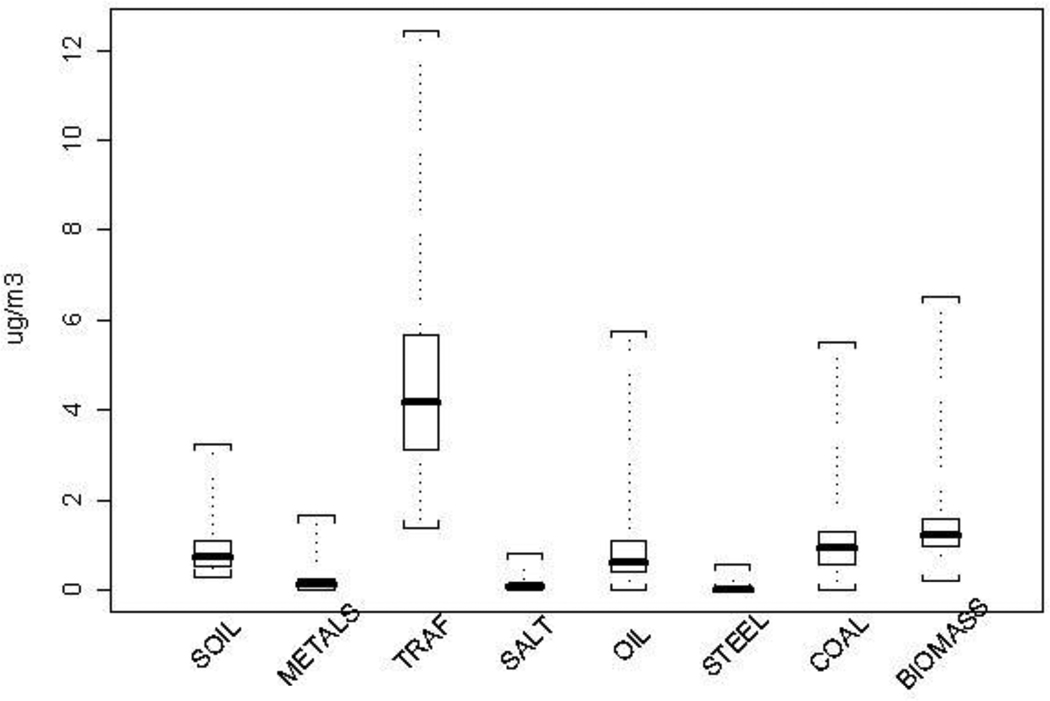
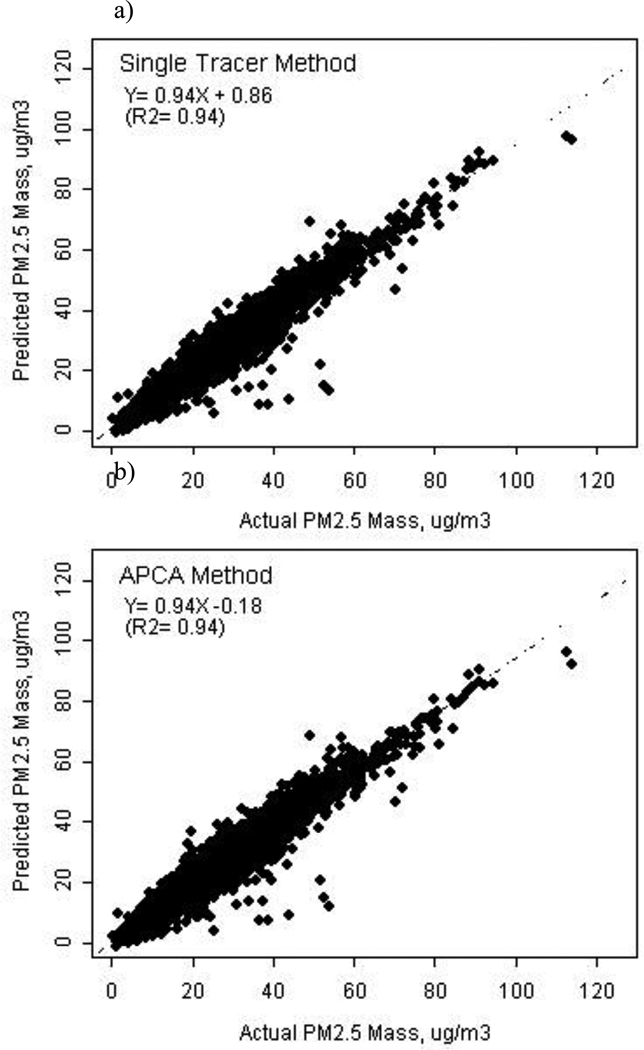
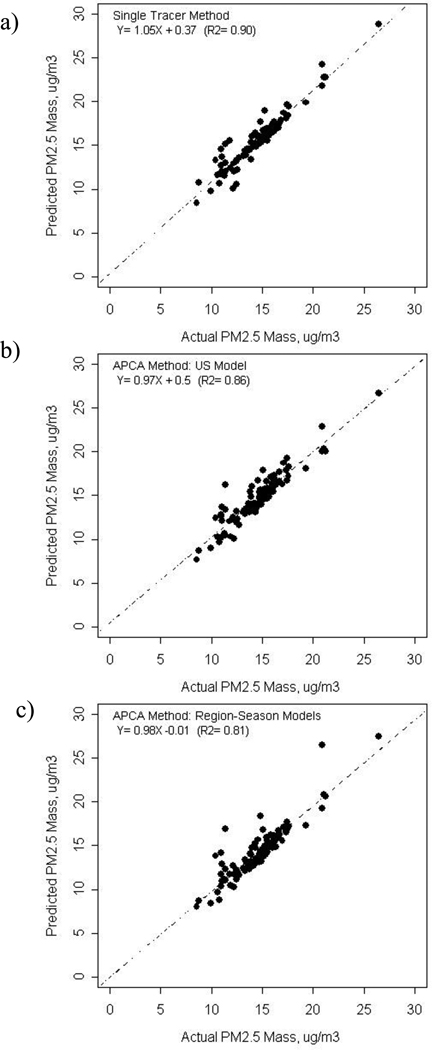
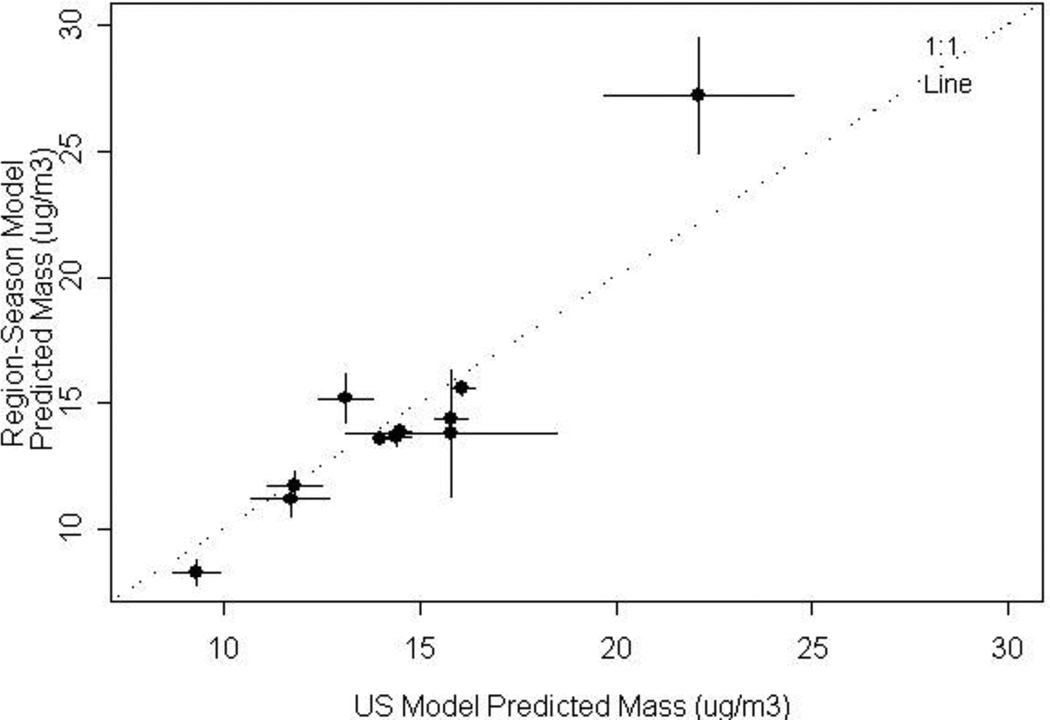
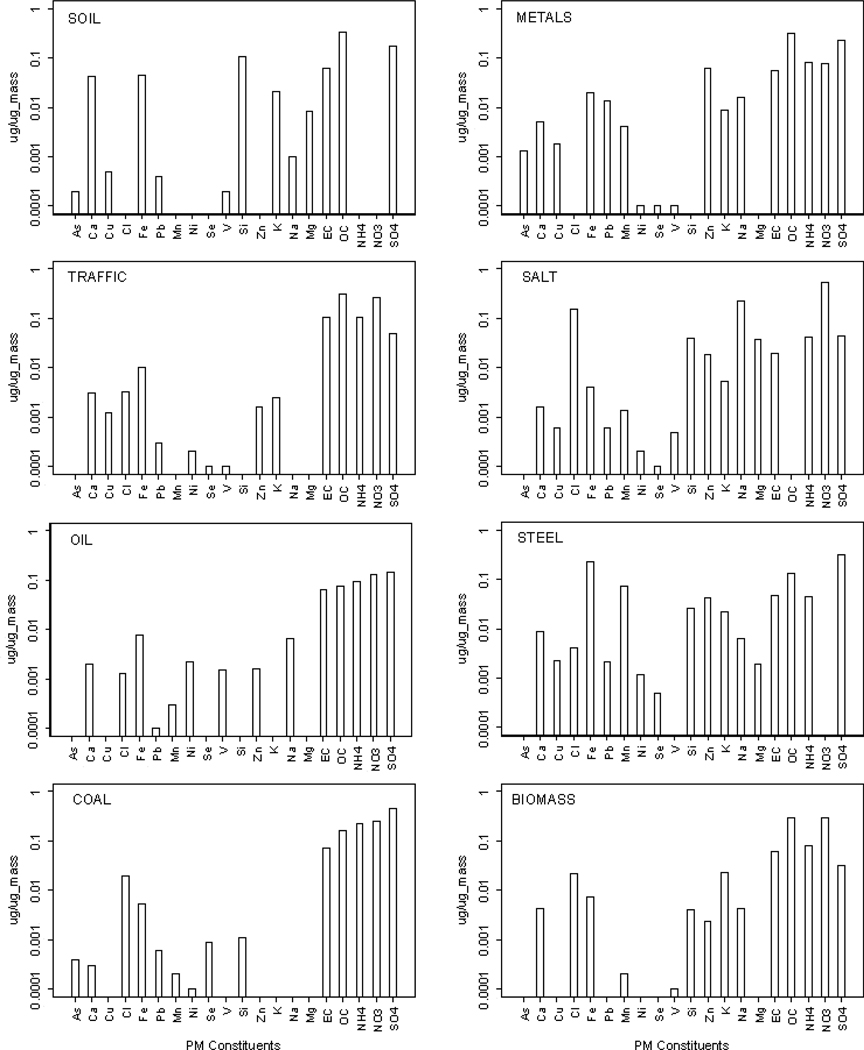
Using daily fine particulate matter (PM2.5) composition data from the 2000-2005 U.S. EPA Chemical Speciation Network (CSN) for over 200 sites, we applied multivariate methods to identify and quantify the major fine particulate matter (PM2.5) source components in the U.S. Novel aspects of this work were: (1) the application of factor analysis (FA) to multi-city daily data, drawing upon both spatial and temporal variations of chemical species; and, (2) the exclusion of secondary components (sulfates, nitrates and organic carbon) from the source identification FA to more clearly discern and apportion the PM2.5 mass to primary emission source categories. For the quantification of source-related mass, we considered two approaches based upon the FA results: 1) using single key tracers for sources identified by FA in a mass regression; and, 2) applying Absolute Principal Component Analysis (APCA). In each case, we followed a two-stage mass regression approach, in which secondary components were first apportioned among the identified sources, and then mass was apportioned to the sources and to other secondary mass not explained by the individual sources. The major U.S. PM2.5 source categories identified via FA (and their key elements) were: Metals Industry (Pb, Zn); Crustal/Soil Particles (Ca, Si); Motor Vehicle Traffic (EC, NO2); Steel Industry (Fe, Mn); Coal Combustion (As, Se); Oil Combustion (V, Ni); Salt Particles (Na, Cl) and Biomass Burning (K). Nationwide spatial plots of the source-related PM2.5 impacts were confirmatory of the factor interpretations: ubiquitous sources, such as Traffic and Soil, were found to be spread across the nation, more unique sources (such as Steel and Metals Processing) being highest in select industrialized cities, Biomass Burning was highest in the U.S. Northwest, while Residual Oil combustion was highest in cities in the Northeastern U.S. and in cities with major seaports. The sum of these source contributions and the secondary PM2.5 components agreed well with the U.S. PM2.5 observed during the study period (mean=14.3 ug/m3; R2= 0.91). Apportionment regression analyses using single-element tracers for each source category gave results consistent with the APCA estimates. Comparisons of nearby sites indicated that the PM2.5 mass and the secondary aerosols were most homogenous spatially, while traffic PM2.5 and its tracer, EC, were among the most spatially representative of the source-related components. Comparison of apportionment results to a previous analysis of the 1979-1982 IP Network revealed similar and correlated major U.S. source category factors, albeit at lower levels than in the earlier period, suggesting a consistency in the U.S. spatial patterns of these source-related exposures over time, as well. These results indicate that applying source apportionment methods to the nationwide CSN can be an informative avenue for identifying and quantifying source components for the subsequent estimation of source-specific health effects, potentially contributing to more efficient regulation of PM2.5.
Keywords: Absolute Principal Component Analysis (APCA); Chemical Speciation Network (CSN); Source Apportionment; fine particulate matter mass (PM2.5).
Figures
References
-
- Baumann K, Jayanty RK, Flanagan JB. Fine particulate matter source apportionment for the Chemical speciation Trends Network site at Birmingham, Alabama, using Positive Matrix Factorization. J Air Waste Manag. Assoc. 2008 Jan;58(1):27–44. - PubMed
-
- Blifford IH, Meeker GO. A Factor Analysis Model of Large Scale Pollution. Atmospheric Environment. 1967;1(2):147–157.
-
- Brown SG, Frankel A, Raffuse SM, Roberts PT, Hafner HR, Anderson DJ. Source apportionment of fine particulate matter in Phoenix, AZ, using positive matrix factorization. J Air Waste Manag. Assoc. 2007 Jun;57(6):741–752. - PubMed
-
- Chen LW, Watson JG, Chow JC, Magliano KL. Quantifying PM2.5 source contributions for the San Joaquin Valley with multivariate receptor models. Environ Sci Technol. 2007 Apr 15;41(8):2818–2826. 2007. - PubMed
Grants and funding
LinkOut - more resources
Full Text Sources
Research Materials