. 2014 Mar 5:8:12.
doi: 10.3389/fncir.2014.00012. eCollection 2014.

Comparison of the dynamics of neural interactions between current-based and conductance-based integrate-and-fire recurrent networks

Affiliations

Comparison of the dynamics of neural interactions between current-based and conductance-based integrate-and-fire recurrent networks

Stefano Cavallari et al. Front Neural Circuits. .

Abstract

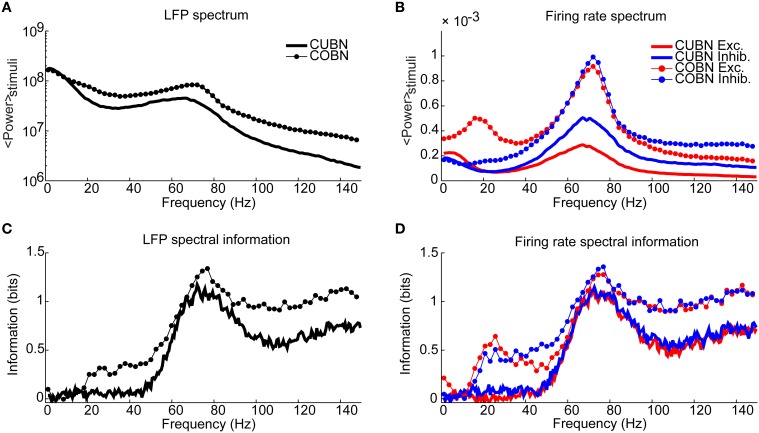
Models of networks of Leaky Integrate-and-Fire (LIF) neurons are a widely used tool for theoretical investigations of brain function. These models have been used both with current- and conductance-based synapses. However, the differences in the dynamics expressed by these two approaches have been so far mainly studied at the single neuron level. To investigate how these synaptic models affect network activity, we compared the single neuron and neural population dynamics of conductance-based networks (COBNs) and current-based networks (CUBNs) of LIF neurons. These networks were endowed with sparse excitatory and inhibitory recurrent connections, and were tested in conditions including both low- and high-conductance states. We developed a novel procedure to obtain comparable networks by properly tuning the synaptic parameters not shared by the models. The so defined comparable networks displayed an excellent and robust match of first order statistics (average single neuron firing rates and average frequency spectrum of network activity). However, these comparable networks showed profound differences in the second order statistics of neural population interactions and in the modulation of these properties by external inputs. The correlation between inhibitory and excitatory synaptic currents and the cross-neuron correlation between synaptic inputs, membrane potentials and spike trains were stronger and more stimulus-modulated in the COBN. Because of these properties, the spike train correlation carried more information about the strength of the input in the COBN, although the firing rates were equally informative in both network models. Moreover, the network activity of COBN showed stronger synchronization in the gamma band, and spectral information about the input higher and spread over a broader range of frequencies. These results suggest that the second order statistics of network dynamics depend strongly on the choice of synaptic model.

Keywords: conductance based neuron models; correlation analysis; current based neuron models; information encoding; integrate-and-fire neurons; local field potentials; recurrent neural network; spike correlation.


Figures

Figure 1
Figure 1
Procedure to set the synaptic conductances of the COBN. The flowchart illustrates the iterative algorithm we used to set the synaptic conductances, gsyn, such in a way to obtain a COBN comparable with the given CUBN. The two networks shared all the common parameters, so, once the CUBN was given, the synaptic conductances depended only on the synaptic reversal potentials of the COBN, Vsyn.
Figure 2
Figure 2
Individual synaptic events. Dynamics of single synaptic events on excitatory neurons (see Methods). Results were qualitatively very similar when considering synaptic inputs impinging on inhibitory neurons (see “PSP peak amplitude” in Supplementary Table 1). (A,B) Shape of Post-synaptic Currents (PSCs, top) for individual synaptic events in case of recurrent AMPA (A) and GABA (B) connection (thalamic AMPA case is not shown because it is qualitatively very similar to the recurrent AMPA case). The origin of the time axis corresponds to the arriving time of the spike. Green lines represent the kinetics in current-based neurons, which is independent from background synaptic activity. Dashed blue lines indicate the kinetics of an isolated conductance-based neuron (thus without background activity), having starting membrane potential equal to 〈Vexc = −58.8 mV, that is the average potential of the excitatory neurons of the network when the external input signal is 1.5 (spikes/ms)/cell. Red lines indicate the average PSCs in conductance-based neurons embedded in the network (thus with background activity) when the external input signal is 1.5 (spikes/ms)/cell (see Methods for details). Blue and green lines are superimposed in (A). (C) Absolute average values of the PSC peaks as a function of the external input rate for neurons embedded in the network. Results are relative to recurrent AMPA (red) external AMPA (green), and GABA (blue) synapses for current- (thick lines) and conductance-based (thin lines with markers) neurons. Shaded areas for the conductance-based neurons correspond to the standard deviation across neurons (for AMPA connections the shaded areas are not visible because they are too small). (D–F) Same as (A–C) for Post-Synaptic Potentials (PSPs). PSPs are more relatively affected by the choice of the synaptic model with respect to the PSCs, because, in the COBN, the PSCs depend on the driving force, while the PSPs both on the driving force and on the effective membrane time constant.
Figure 3
Figure 3
Effective parameters in conductance-based networks. Input rate modulations of COBN-specific parameters. (A) Average effective membrane time constant for conductance-based excitatory neurons (red markers) and inhibitory neurons (blue markers) as a function of the external input rate. Membrane time constants of the current-based neurons are shown for reference as thick lines. Results show that conductance-based membrane timescale is much faster than current-based one and that it decreases with input strength. (B) Average effective AMPA (red) and GABA (blue) conductances on excitatory neurons as a function of the external input rate. Results show that the COBN goes from low- to high-conductance states in the range of external stimuli considered. Same color code as (A). Shaded areas represent standard deviation across neurons [in (A) for inhibitory time constant and in (B) for AMPA conductances they are not visible because too small]. Values are computed from a simulation of 10.5 s per stimulus and are averaged over time and neurons.
Figure 4
Figure 4
Example traces. Examples of 5 s (A–D) and 500 ms (E–J) of data traces generated by the two networks when using constant stimuli. The left column shows the activity in response to an input rate ν0 set to 1.5 spikes/ms generating a low-conductance state. The right column shows the activity in response to an input rate ν0 set to 5 spikes/ms generating a high-conductance state. (A–D) Raster plot of 10 excitatory and 10 inhibitory neurons taken from the COBN (A,B) and from the CUBN (C,D). The selected neurons and the color code are the same across panels (A–D). (E–H) Membrane potential of two neurons taken from the COBN (C,D) and from the CUBN (G,H). The neurons displayed and the color code are the same across the panels (E–H). (I,J) Simulated LFP obtained from the COBN (thin line) and from the CUBN (thick line).
Figure 5
Figure 5
Membrane potential and synaptic input currents as a function of the external input rate. Effects of external input rate modulation on the net synaptic input currents and the membrane potential of excitatory neurons. The synaptic currents in panels (A–C) are divided by the leak membrane conductance to obtain units of mV. Results are qualitatively very similar when considering inhibitory neurons [see “MP” and “σtime (MP)” in Supplementary Table 1]. We studied separately the average over time and the standard deviation over time of the variables by using a simulation of 10.5 s per stimulus. Shaded areas correspond to standard deviation across neurons. (A) Average total synaptic input current in CUBN (thick line) and COBN (thin line with markers) as a function of the external input rate. (B) Different input currents in the two networks. Blue/red/green lines represent respectively the average GABA/recurrent AMPA/external AMPA currents in CUBN (thick lines) and in COBN (thin lines with markers). (C) Average (over neurons) standard deviation in time of the total input current in the two networks as a function of the input rate. (D) Average membrane potential in the two networks as a function of the external input rate. For reference, the panel shows also threshold potential (cyan), reset potential (green) and leak membrane potential (black). (E) Ratio of the decrease of the average MP observed in the two networks when increasing the external inputs as a function of the effective membrane time constant (see Figure 3A). The decrease in MP is computed for external inputs greater than 2 (spikes/ms)/cell with respect to the average MP obtained with an external input of 2 (spikes/ms)/cell. (F) Average (across neurons) standard deviation over time of the membrane potential in the two networks as a function of the input rate. Shaded area for COBN is not visible because it is too small. Results show that for the COBN both average total input current and membrane potential are almost constant across stimuli, while in the CUBN both quantities change dramatically for different input strengths. Cross-neuron variability of both variables is much higher in the CUBN. In both networks net input current fluctuations become larger when input rate is increased. This is reflected in larger fluctuations in the membrane potential in the CUBN, but not in the COBN. In panels (A,B,D,E) the average values of MP and input currents are computed over time and neurons.
Figure 6
Figure 6
Firing rates comparison. (A) Comparison between average firing rate (FR) of inhibitory (blue) and excitatory neurons (red) for COBN (thin lines with markers) and CUBN (thick lines) as a function of the external input rate. (B) Average Coefficient of Variation of the Inter-Spike Interval in the two networks. Same color code as (A). (C) Relative difference between the average FR of excitatory neurons in COBN and CUBN computed for different AMPA and GABA reversal potentials. The relative difference is averaged over the whole stimuli set ranging from 1.5 to 6 (spikes/ms)/cell. Green arrow indicates reference value of reversal potentials that were used in all the analysis (see Table 2). (D) Same as (C) for inhibitory neurons. In (A,C,D) the results are obtained from 50 trials of 4.5 s per stimulus, while for the panel (B) we used a single trial of 100.5 s per stimulus (see Methods). Results show that the two models have similar firing rates over the whole input range. This agreement is stable over a wide range of network parameters. On the other hand, the CV of the ISI increases with the input rate in the CUBN, while it does not in the COBN.
Figure 7
Figure 7
Spectral dynamics of LFP and firing rate. Input rate-dependent modulations of the LFP, studied focusing on position and amplitude of the gamma frequency peak. (A) LFP power spectra in COBN as a function of the external input rate. Data are averaged over trials. (B) Same as (A) for CUBN. (C) Difference in the position of the gamma band [(30–100 Hz)] peak of the power between the two networks. The analysis was performed for the LFP signal (black), and for the total firing rate of excitatory (red) and inhibitory neurons (blue). (D) Difference in the position of the LFP gamma peak averaged over the constant external inputs used (ranging from 1.5 to 6 (spikes/ms)/cell with steps of 0.5 (spikes/ms)/cell) as a function of AMPA and GABA reversal potentials. Green arrow indicates reference values (see Table 2). (E) Modulation of the LFP gamma peak power for the two networks. Power modulation is defined as the difference of the power of a frequency at a given input signal and its power at the input signal of 1.5 (spikes/ms)/cell, normalized to the latter power. (F) Average (over trials) amplitude of the fluctuations of the sum of the currents entering the excitatory neurons for the two networks as a function of the input rate. The currents are divided by the leak membrane conductance to obtain units of mV. Blue, red, and green lines represent GABA, recurrent AMPA and external AMPA respectively. These are the currents we used to compute LFP. Note that the external AMPA currents are almost identical between the two networks because their synapses are activated by the same spike trains in COBN and CUBN (see Methods). Results are computed by using 50 trials of 4.5 s per stimulus and show that (i) the gamma peak position across stimuli is similar for the two networks and this agreement is robust to change in the network parameters, (ii) the amplitude of the peak power is more modulated in the COBN because of the stronger fluctuations of the synaptic currents at the network level.
Figure 8
Figure 8
Cross-correlation between AMPA and GABA inputs. Cross-correlation between the time course of recurrent AMPA and GABA currents entering excitatory neuron. (A) Average peak value of cross-correlation between AMPA and GABA input currents into excitatory neurons (see Methods for details) for CUBN (thick line) and COBN (thin line with markers). Note that, AMPA and GABA currents having opposite sign, the correlation is negative. Shaded areas correspond to standard deviation across neurons. (B) Cross correlation average peak position. This measure quantify how much AMPA inputs lags behind GABA ones. Same color code as (A). Results are computed by using a simulation of 10.5 s per stimulus and show that (i) correlation between recurrent AMPA and GABA input currents is stronger in the COBN than in the CUBN, (ii) input correlation decreases monotonously with input rate in COBN, while it does not in CUBN, (iii) GABA inputs lags behind AMPA inputs by few milliseconds in both networks.
Figure 9
Figure 9
Synaptic input and membrane potential correlation across neurons. (A) Average cross-neuron correlation coefficient between the time course of recurrent AMPA currents (red lines) and GABA currents (blue lines) on excitatory neurons, for CUBN (thick lines) and COBN (thin line with markers), as a function of the external input rate. Similar results hold for inhibitory neurons (see “Rec. AMPA-Rec. AMPA” and “GABA-GABA” in Supplementary Table 1). (B) Average correlation coefficient between the membrane potential (MP) time courses of pairs of excitatory neurons as a function of the external input rate. While in the COBN the MP correlation increases with input rate, the opposite occurs in the CUBN. Shaded areas correspond to standard deviation across neuron pairs. Results are computed by using a simulation of 10.5 s per stimulus and show that in COBN the cross-neuron correlations between membrane potentials and between input currents are stronger than in CUBN.
Figure 10
Figure 10
Spike train correlation. Spike train pairwise coefficient of correlation between neurons belonging to the same (A,B) or to different (C) populations. (A) Average spike train correlation between pairs of excitatory neurons as a function of the external input rate for CUBN (thick line) and COBN (thin line with markers). (B) Same as (A) for correlation between pairs of inhibitory neurons. (C) Same as (A) for correlations between pairs composed by an inhibitory and an excitatory neuron. (D) Distribution of the correlation coefficient across inhibitory neurons pairs for an input of 1.5 (spikes/ms)/cell for the two networks. (E) Same as (D) for an input of 6 (spikes/ms)/cell. Note that panels (A–C) do not have error bars for clarity, but the range of correlation values is similar to the one displayed in panels (D,E). Results are computed by using a simulation of 100.5 s per stimulus and show that firing rate correlation is very low for both networks, and it increases with input rate in the COBN, but not in the CUBN.
Figure 11
Figure 11
Spectral information relative to the input rate. Information carried by LFP power spectrum (left column) and population firing rates power spectra (right column) about constant inputs ranging from 1.5 to 3 (spikes/ms)/cell with steps of 0.1 (spikes/ms)/cell. Data are obtained by using 50 trials of 4.5 s per stimulus. (A) Average power spectrum of LFP over the entire stimulus range for the COBN and the CUBN (thin line with markers and tick line respectively). (B) Average power spectrum of the total firing rate of excitatory and inhibitory neurons (red and blue respectively) for the two networks [same line code as (A)]. (C) Spectral information carried by LFP about the input rate (see Methods for details). Same color code as (A). (D) Spectral information carried by total excitatory and inhibitory firing rate about the input rate. Same color code as (B). Results show that the COBN carries more information about constant stimuli for all considered frequencies, both in LFP and in firing rates.
Figure 12
Figure 12
Spectral information relative to periodic low frequency inputs. Dynamics of the COBN and CUBN when injected with slowly oscillating inputs. The input signals are sine curves with amplitude A = 0.6 spikes/ms and frequency f, from 2 to 16 Hz, superimposed to a baseline of ν0 = 1.5 spikes/ms in the left column and ν0 = 5 spikes/ms in the right column. The first baseline value produces a low-conductance state, while the second originates a high-conductance state. Data are obtained from 50 trials of 10.5 s per stimulus. (A,B) LFP power spectrum in the COBN as a function of the external signal frequency. The power spectrum is averaged over trials. (B) Same color code as in (A). (C,D) Same as (A,B) for the CUBN. The inset in (B) shows a detail of the panel in the frequency range where beats are displayed. (E,F) Spectral information carried by the LFP about the frequency of the stimulus presented (see Methods for details) for COBN (blue line) and CUBN (red line). Results show that the information due to the entrainment of the LFP to the slow input oscillations is almost the same in COBN and CUBN. The only difference is due to the beats that appear in the high-conductance state of the COBN [inset in (B)], which result in a peak of information around 100 Hz (F).
Figure 13
Figure 13
Entrainment of LFP to input oscillations. Entrainment of the network oscillations to the frequencies of the periodic input in COBN and CUBN. The input signals are periodic curves as in Figure 12, but with frequency f from 2 to 150 Hz. (A,B) Average (over trials) coherence between the phase of the input signal, with frequency f, and the phase of the LFP bandpassed in the corresponding frequency range (f − 1, f + 1) Hz (see Methods for details). Note that the phase coherence lies in the interval (0, 1). Data are obtained from 50 trials of 10.5 s per stimulus; shaded areas represent standard deviations across trials. Blue lines display results from COBN and red lines from CUBN. (C,D) LFP power spectrum in the COBN as a function of some selected external signal frequencies. The power spectrum is averaged over 50 trials. (D) Same color code as in (C). (E,F) Same as (C,D) for the CUBN. In the low-conductance state both networks entrain very well to the external stimulus, whereas in the high-conductance regime the COBN entrains less well than the CUBN in the middle and in the highest frequency regimes.
Figure 14
Figure 14
Spectral information relative to naturalistic stimuli. Information carried by LFP power spectrum (left column) and population firing rates power spectra (right column) about intervals of naturalistic stimulation based on LGN recordings in monkeys watching a movie. Recording time (80 s) is divided into 40 intervals, considered as different stimuli and the information is computed over 50 trials (see Methods for details). (A) Average power spectrum of LFP over the entire naturalistic input for COBN and CUBN (thin line with markers and thick line respectively). (B) Average power spectrum for the total firing rate of excitatory and inhibitory neurons (red and blue respectively) for the two networks. Same line code as in (A). (C) Spectral information carried by LFP (see Methods for details). Same color code as in (A). In the inset, it is shown the difference between COBN and CUBN information in the low frequency band. (D) Spectral information carried by total excitatory and inhibitory firing rates. Same color code as (B). In the inset, it is shown the difference between COBN and CUBN information in the low frequency band. Results show that, also considering complex stimuli, the information relative to the mean value of the input [that here is the information carried by the frequencies above the delta band, (1–4) Hz] is higher and carried on a broader range of frequencies in the COBN, both in LFP and in firing rates. The information conveyed by delta band frequencies is instead almost identical in the two networks.

References

    1. Babadi B., Abbott L. F. (2010). Intrinsic stability of temporally shifted spike-timing dependent plasticity. PLoS Comput. Biol. 6:e1000961 10.1371/journal.pcbi.1000961 - DOI - PMC - PubMed
    1. Belitski A., Gretton A., Magri C., Murayama Y., Montemurro M. A., Logothetis N. K., et al. (2008). Low-frequency local field potentials and spikes in primary visual cortex convey independent visual information. J. Neurosci. 28, 5696–5709 10.1523/JNEUROSCI.0009-08.2008 - DOI - PMC - PubMed
    1. Berens P. (2009). CircStat: a MATLAB toolbox for circular statistics. J. Stat. Softw. 31, 1–21
    1. Braitenberg V., SchüZ A. (1991). Anatomy of the Cortex: Statistics and Geometry. Berlin; New York, NY: Springer-Verlag; 10.1007/978-3-662-02728-8 - DOI
    1. Brunel N. (2013). Dynamics of neural networks, in Principles of Neural Coding, eds Quian Quiroga R., Panzeri S. (Boca Raton, FL: CRC Press; ), 489–512 10.1201/b14756-29 - DOI

Publication types

MeSH terms

LinkOut - more resources