. 2014 Mar 5:8:64.
doi: 10.3389/fnbeh.2014.00064. eCollection 2014.

Ex vivo dissection of optogenetically activated mPFC and hippocampal inputs to neurons in the basolateral amygdala: implications for fear and emotional memory

Affiliations

Ex vivo dissection of optogenetically activated mPFC and hippocampal inputs to neurons in the basolateral amygdala: implications for fear and emotional memory

Cora Hübner et al. Front Behav Neurosci. .

Abstract

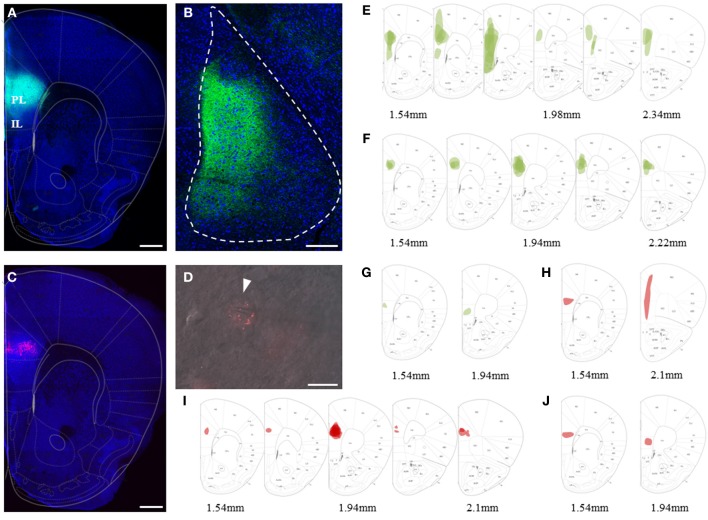
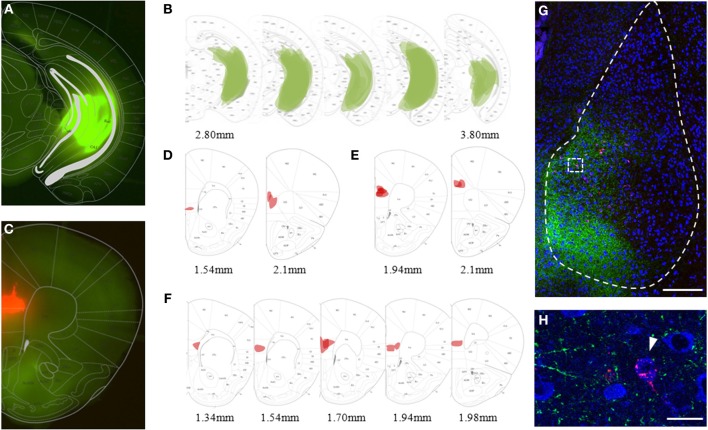
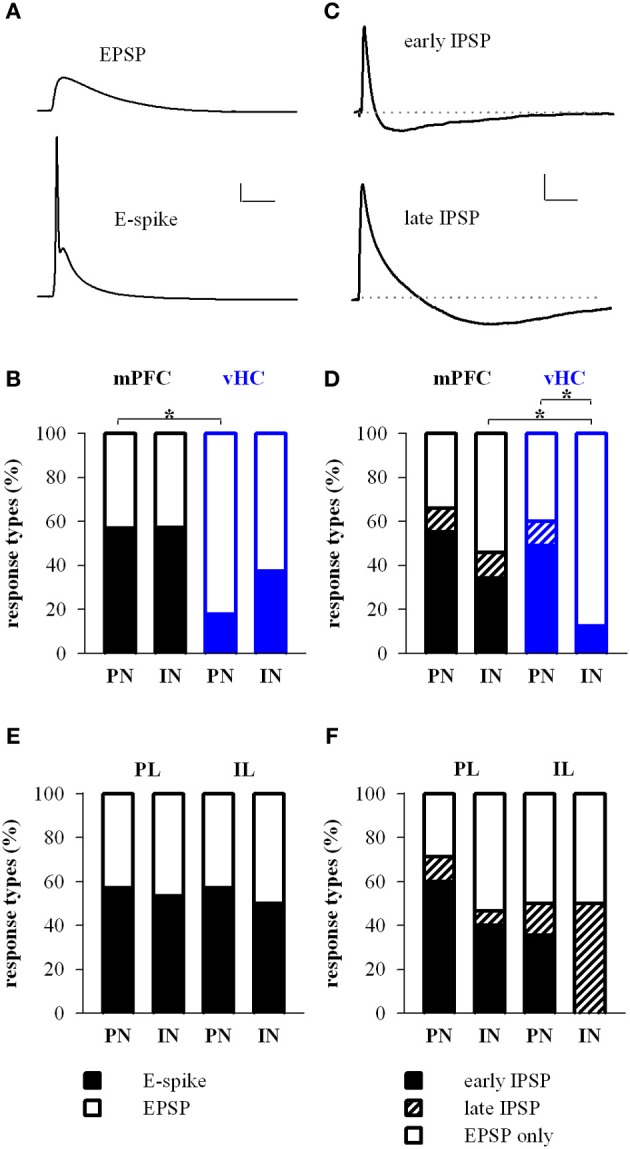
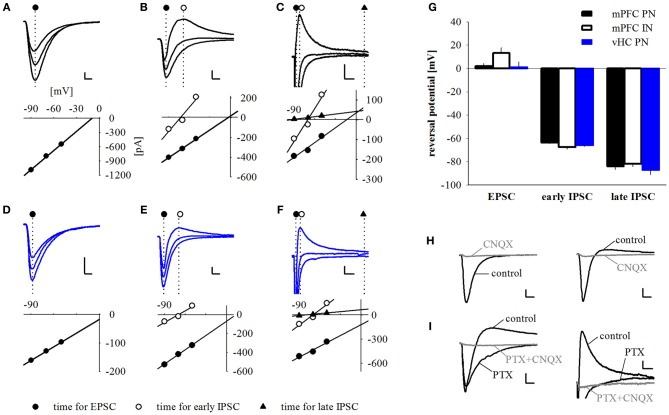
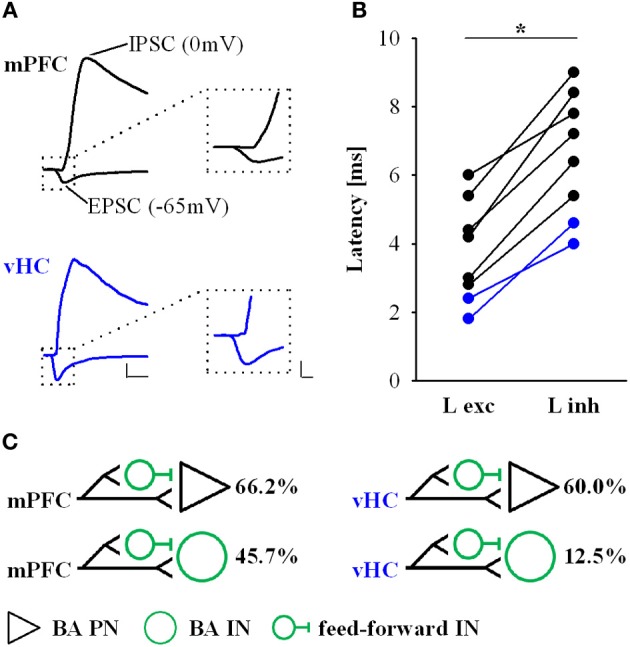
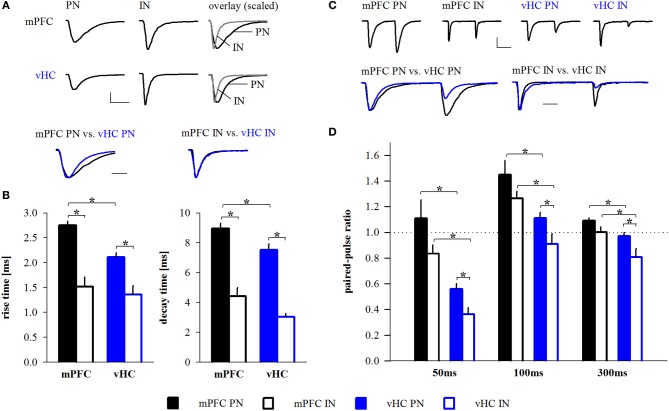
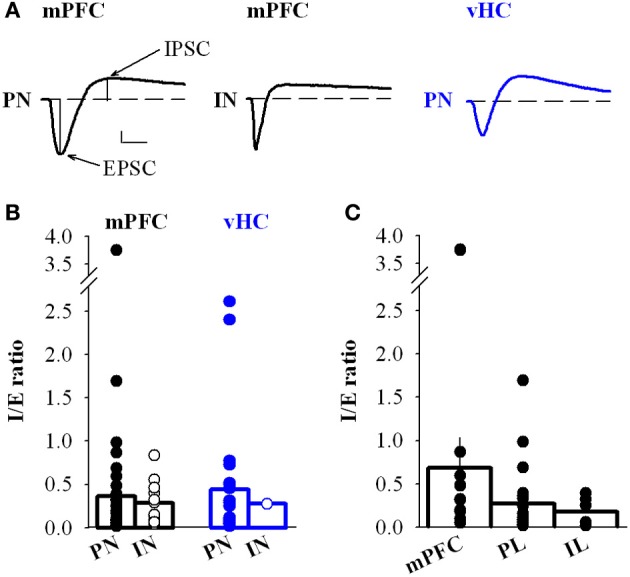
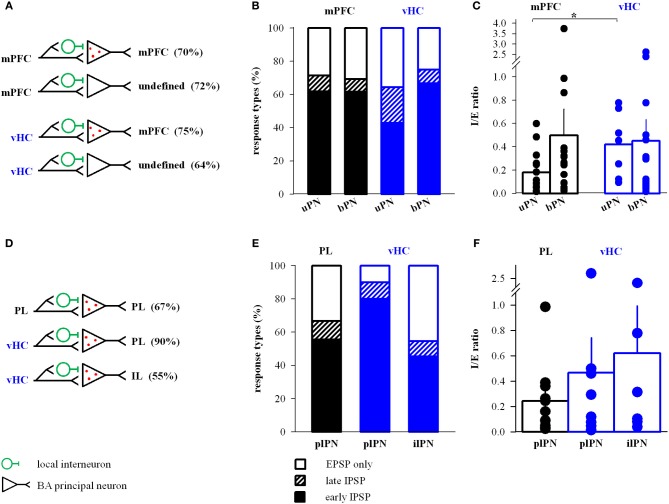
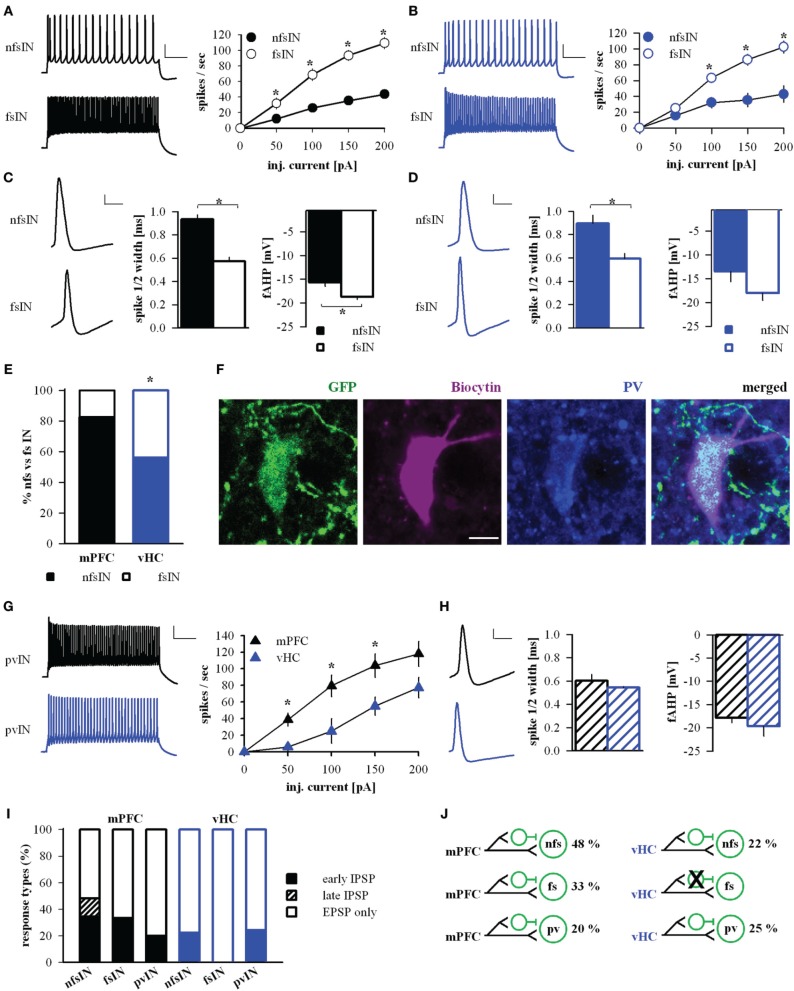
Many lines of evidence suggest that a reciprocally interconnected network comprising the amygdala, ventral hippocampus (vHC), and medial prefrontal cortex (mPFC) participates in different aspects of the acquisition and extinction of conditioned fear responses and fear behavior. This could at least in part be mediated by direct connections from mPFC or vHC to amygdala to control amygdala activity and output. However, currently the interactions between mPFC and vHC afferents and their specific targets in the amygdala are still poorly understood. Here, we use an ex-vivo optogenetic approach to dissect synaptic properties of inputs from mPFC and vHC to defined neuronal populations in the basal amygdala (BA), the area that we identify as a major target of these projections. We find that BA principal neurons (PNs) and local BA interneurons (INs) receive monosynaptic excitatory inputs from mPFC and vHC. In addition, both these inputs also recruit GABAergic feedforward inhibition in a substantial fraction of PNs, in some neurons this also comprises a slow GABAB-component. Amongst the innervated PNs we identify neurons that project back to subregions of the mPFC, indicating a loop between neurons in mPFC and BA, and a pathway from vHC to mPFC via BA. Interestingly, mPFC inputs also recruit feedforward inhibition in a fraction of INs, suggesting that these inputs can activate dis-inhibitory circuits in the BA. A general feature of both mPFC and vHC inputs to local INs is that excitatory inputs display faster rise and decay kinetics than in PNs, which would enable temporally precise signaling. However, mPFC and vHC inputs to both PNs and INs differ in their presynaptic release properties, in that vHC inputs are more depressing. In summary, our data describe novel wiring, and features of synaptic connections from mPFC and vHC to amygdala that could help to interpret functions of these interconnected brain areas at the network level.

Keywords: amygdala; conditioned fear; hippocampus; medial prefrontal cortex; optogenetics.


Figures

Figure 1
Figure 1
Viral and bead injection sites for studying mPFC inputs to BLA. (A) Confocal image of a representative brain slice of an animal injected in the mPFC with rAAV-ChR2(H134R)-eYFP (green). Scale bar: 500 μm. (B) Confocal image of a 35° tilted horizontal brain slice of the BLA with mPFC projections (green) corresponding to the injection site of (A). Scale bar: 250 μm. (C) Confocal image of a representative brain slice with retrobead injection site restricted to the PL region of the mPFC (red). Scale bar: 250 μm. (D) Image of an ex vivo recorded retrogradely labeled PN in the BA. Scale bar: 10 μm. (E–G) Overlay of mPFC viral injection sites (green) with the mouse brain atlas for animals categorized as having main injection sites in (E) mPFC (n = 13), (F) PL (n = 17) and (G) IL (n = 2). (H–J) Overlay with the mouse brain atlas for animals categorized as having the main retrobead injection site in (H) mPFC (n = 2), (I) PL (n = 13) and (J) IL (n = 2).
Figure 2
Figure 2
Viral and bead injection sites for studying hippocampal inputs to BLA. (A) Stereoscopic picture of a representative brain slice of an animal injected in the ventral hippocampus (vHC) with rAAV-ChR2(H134R)-eYFP (green). (B) Overlay of vHC viral injection sites with the mouse brain atlas for all animals analyzed (n = 23). (C) Stereoscopic picture of a representative brain slice with retrobead injection site in the mPFC (red) of the same animal. (D–F) Overlay of main retrobead injection sites with the mouse brain atlas for all animals categorized as having the main injection site in (D) mPFC (n = 2), (E) PL (n = 5) and (F) IL (n = 8). (G) Confocal image of a coronal brain slice of the BLA with vHC projections (green) and retrogradely labeled principle neurons projecting to the mPFC (red) of the animal shown in (A) and (C). Scale bar: 250 μm. (H) Close-up of insert from (G) with vHC projections and retrobead-labeled neurons in the medial BA. Scale bar: 20 μm.
Figure 3
Figure 3
Prefrontal and hippocampal inputs evoke excitatory and inhibitory responses in BA principal neurons and interneurons. (A) Example traces of excitatory response types showing subthreshold EPSP and EPSP-spike (E-spike) responses. Scale bar: 10 mV/25 ms. (B) Relative distribution (%) of excitatory response types in principal neurons (PN) and interneurons (IN) receiving synaptic inputs from mPFC (black) and vHC (blue). Legend for (B,E) is shown in panel (E). Spikes were more readily elicited in PNs by mPFC inputs than vHC inputs (Relative occurrence of spikes was for mPFC→PN: E-spike 57%, n = 65 vs. vHC→PN: E-spike 18%, n = 45; Fisher's Exact Test, *p < 0.001). No difference was observed in INs with mPFC and vHC inputs (mPFC→IN: E-spike 57%, n = 35 vs. vHCI→N: E-spike 38%, n = 16; Fisher's Exact Test, p = 0.237) or INs vs. PNs within each input type (Fisher's Exact Test, p = 1 for mPFC and p = 0.164 for vHC). (C) Example traces showing early and late inhibitory response types. Scale bar: 2 mV/50 ms. (D) Relative distribution (%) of purely excitatory (open bars) and additional inhibitory response types (early IPSP: closed bars, late IPSP: striped bars) in PNs and INs receiving input from mPFC and vHC. Legend for (D,F) is shown in panel (F). Occurrence of inhibitory response types for mPFC→PN: early 55%, late 11%, n = 65; mPFC→IN: early 34%, late 11%, n = 35; vHC→PN: early 49%, late 11%, n = 45; and vHC→IN: early 12%, n = 16. Inputs from vHC recruited IPSPs more readily in PNs compared to INs (n = 27/45 vs. n = 2/16; Fisher's Exact Test, *p = 0.001). In INs, mPFC inputs recruited IPSPs more readily than vHC inputs (n = 16/35 vs. n = 2/16; Fisher's Exact Test, *p = 0.028). (E) Relative distribution (%) of excitatory response types in neurons receiving synaptic input from prelimbic (PL) and infralimbic (IL) regions of the mPFC. Relative occurrence of spikes was for PL→PN: 57%, n = 35; IL→PN: 57%, n = 14 neurons; PL→IN: 53%, n = 15; IL→IN: 50%, n = 2. No difference in excitatory response types was observed (Fisher's Exact Test, all p = 1) (F) Relative distribution (%) of purely excitatory (open bars) and early and late inhibitory (closed and striped bars, respectively) response types in neurons receiving synaptic input from PL and IL regions of the mPFC. Occurrence of inhibitory response types for PL→PN: early 60%, late 11%, n = 35; and PL→IN: early 40%, late 7%, n = 15; IL→PN: early 36%, late 14%; n = 14; IL→IN: early 0%, late 50%, n = 2. There was no difference in inhibitory response types (Fisher's Exact Test, all p > 0.25).
Figure 4
Figure 4
Synaptic responses are comprised of early EPSCs and GABAA and GABAB mediated feed-forward IPSCs. (A–F) Example traces and corresponding current-voltage relationship plots for pure excitatory (A,D), excitatory and early inhibitory (B,E) and excitatory plus early and late inhibitory (C,F) synaptic currents elicited by either mPFC (A–C, black traces) or vHC (D–F, blue traces) afferent fiber activation. Responses were recorded at holding potentials of −90, −70 and −50 mV. Dotted lines and symbols represent time of current measurement for excitatory, early, and late inhibitory components. Scale bars for (A,B,E): 100 pA/5 ms; for (C,F): 50 pA/25 ms; for (D): 25 pA/5 ms. (G) Summary graph of reversal potentials for PNs with mPFC input (EPSC: 1.88 ± 2.67 mV, n = 42; early IPSC: −63.65 ± 0.94 mV, n = 42; late IPSC: −84.06 ± 2.56 mV, n = 7), INs with mPFC input (EPSC: 13.33 ± 4.29 mV, n = 7; early IPSC: −67.44 ± 1.81 mV, n = 14; late IPSC: −81.73 ± 2.61 mV, n = 2) and PNs with vHC input (EPSC: 1.06 ± 4.74 mV, n = 12; early IPSC: −65.82 ± 1.09 mV, n = 23; late IPSC: −86.99 ± 4.12 mV, n = 4). (H) Example traces showing the effect of CNQX (10 μM) on EPSCs and IPSCs elicited by mPFC input stimulation. CNQX abolished EPSCs (left) and biphasic EPSC/IPSC responses (right). Scale bars: 50 pA/5 ms. (I) Example traces showing the effects of picrotoxin (PTX, 100 μM) and PTX+CNQX on EPSCs and early and late IPSCs elicited by mPFC input stimulation. PTX abolished the early IPSC and (left and right panel), but not the late IPSC (right panel). Addition of CNQX abolished the remaining EPSC (left and right panel), and late IPSC (right panel). Scale bars: 50 pA/5 ms (left) and 25 pA/25 ms (right).
Figure 5
Figure 5
Latencies of EPSCs and IPSCs for mPFC and vHC inputs onto BA neurons. (A) Example traces of EPSCs and IPSCs recorded at −65 mV and 0 mV, respectively in Cs-based internal solution. Black traces represent mPFC inputs, blue traces vHC inputs onto BA PNs. Scale bar left: 200 pA/10 ms; right: 200 pA/2 ms. (B) Individual data points show a within-cell comparison of latencies of EPSCs (L exc) and IPSCs (L inh) in BA PNs for mPFC (n = 6) and vHC (n = 2) inputs. IPSC latencies were significantly slower that EPSC latencies (paired Students t-test: *p < 0.01). (C) Proposed wiring scheme of excitatory and feedforward inhibitory connections from mPFC and vHC with neurons in the BA based on results shown in Figures 3–5. Numbers (%) represent the prevalence for recruitment of feed-forward inhibition from Figure 3D.
Figure 6
Figure 6
Properties of mPFC- and vHC-evoked EPSCs in BA neurons. (A) Example traces of EPSCs recorded at −70 mV in BA principal neurons (PN) and interneurons (IN) receiving input from mPFC (top) or vHC (middle) and amplitude-scaled overlays showing faster rise and decay of EPSCs in IN. Amplitude-scaled overlays of mPFC- or vHC-evoked EPSCs in PNs and INs show faster EPSCs of vHC inputs in PNs (bottom). Scale bars: 100 pA/10 ms (top) and 5 ms (bottom). (B) Summary graphs for rise and decay times of EPSCs in PNs and INs for mPFC (black) and vHC inputs (blue), all values are in Table 2 (all PNs) and Table 5 (all INs). Rise and decay times were significantly faster for mPFC inputs onto INs vs. PNs (rise time: p < 0.001; decay time: p < 0.001) and vHC inputs onto INs vs. PNs (rise time: p = 0.002; decay time: p < 0.001). vHC inputs evoked faster EPSCs in PNs than mPFC inputs (rise time: p < 0.001, decay time: p = 0.01). (C) Example traces of EPSCs evoked by paired pulse stimulation (interval: 50 ms) at −70 mV in PNs and INs after stimulation of mPFC (top left) or vHC (top right) inputs. Overlays scaled to the amplitude of the first EPSC illustrate differences in paired pulse ratio (bottom). Scale bars: 100 pA/25 ms (top) and 10 ms (bottom). (D) Summary graph for paired pulse ratios (PPR) of EPSCs at different stimulation intervals in PNs and INs for mPFC (black) and vHC inputs (blue), all values are in Table 2 (all PNs) and Table 5 (all INs). PPRs of mPFC inputs onto INs vs. PNs were not significantly different (p > 0.05 for all intervals). PPRs of vHC inputs onto PNs vs. INs were significantly larger (*p < 0.05 for all intervals). PNs and INs receiving mPFC input showed significantly larger PPRs than PNs and INs receiving vHC inputs (PN: *p < 0.01; IN: *p < 0.05 for all intervals).
Figure 7
Figure 7
Inhibition to excitation ratio of mPFC and vHC inputs onto BA neurons. (A) Example traces of biphasic EPSC/IPSC sequences recorded at −50 mV in BA principal neurons (PN) and interneurons (IN) receiving input from either mPFC (black traces) or vHC (blue trace). Scale bar: 50 pA/10 ms. (B) Summary graph of the inhibition to excitation ratio (I/E ratio) in PNs and INs for mPFC (black) and vHC inputs (blue), all values are in Table 2 (all PNs) and Table 5 (all INs). Individual data points illustrate the high variability of I/E ratios. No significant differences were found between PNs and INs receiving mPFC input (p = 0.699). (C) Summary graph of the I/E ratio in PNs receiving inputs from subregions of the mPFC: Ratios for mPFC (undefined mPFC) 0.69 ± 0.35, n = 10; PL 0.27 ± 0.08, n = 23; and IL 0.18 ± 0.07, n = 6. No significant differences were found between groups (mPFC vs. PL: p = 0.276; mPFC vs. IL: p = 0.185; PL vs. IL: p = 0.568).
Figure 8
Figure 8
mPFC and vHC connectivity with and properties of inputs to BA projection neurons. (A) Scheme of projections observed onto retrobead-labeled mPFC-projecting (bPN) and unlabeled BA principal neurons (uPN). (B) Relative distribution (%) of purely excitatory (open bars) and additional inhibitory response types (early IPSP: closed bars, late IPSP: striped bars) in uPNs and bPNs. Occurrence of inhibitory response types for mPFC→uPN: early 62%, late 10%, n = 21; mPFC→bPN: early 62%, late 8%, n = 26; vHC→uPN: early 43%, late 21%, n = 14; and vHC→bPN: early 67%, late 8%, n = 24. No significant differences were found between inputs or cell types (Fisher's Exact Test, p > 0.05). (C) Summary graph of inhibition-to-excitation ratio (I/E ratio) in uPNs and bPNs for mPFC (black) and vHC inputs (blue). All values are in Table 2. Individual data points illustrate the high variability of I/E ratios. Synaptic inputs onto uPNs showed significantly lower I/E ratios for mPFC inputs vs. vHC inputs (uPN mPFC vs. vHC: p = 0.027; all other comparisons: *p > 0.05). (D) Scheme of specific projections observed onto retrobead labeled PNs projecting to PL (plPN) and IL (ilPN) subdivisions of the mPFC. (E) Relative distribution (%) of purely excitatory (open bars) and additional inhibitory response types (early IPSP: closed bars, late IPSP: striped bars) in plPNs and ilPNs. Occurrence of inhibitory response types for PL→plPN: early 56%, late 11%, n = 12; vHC→plPN: early 80%, late 10%, n = 10; vHC→ilPN: early 45%, late 9%, n = 11. No significant differences were found between inputs or cell types (Fisher's Exact Test, p > 0.05). (F) Summary graph of I/E ratio in plPNs and ilPNs for PL (black) and vHC inputs (blue). All values are in Table 3. Individual data points illustrate the high variability of I/E ratios. No significant difference in I/E ratios was observed for mPFC or vHC inputs onto plPNs (p = 0.413), or vHC input onto plPNs vs. ilPNs (p = 0.740).
Figure 9
Figure 9
mPFC and vHC afferents preferentially target different classes of interneurons. (A,B) Left: Example traces of spike responses to a 200 pA/500 ms current injection in non-fast spiking (nfsINs) and fast-spiking (fsINs) INs receiving mPFC (black) or vHC input (blue). Scale bars: 20 mV/100 ms. Right: Input-output curves of INs with mPFC (black) or vHC (blue) input showed a significantly higher firing frequency in fsINs than nfsINs (*p < 0.05). (C,D) Left: Spike waveforms of nfsINs and fsINs with mPFC (black) or vHC input (blue). Scale bar: 20 mV/2 ms. Right: Graphs of spike half-width and fast after hyperpolarisation (fAHP) for nfsINs and fsINs with mPFC (black) or vHC inputs (blue), all values are in Table 4. Spike half width was broader in nfsINs vs. fsINs (mPFC: p < 0.001; vHC: p = 0.005) and the fAHP was smaller nfsINs vs. fsINs for mPFC inputs (mPFC: p = 0.003; vHC:p = 0.127). (E) Graph showing the distribution of BA IN-types with light responses (%). fsIN were more likely to be recruited by vHC vs. mPFC inputs (Fisher's Exact Test, p < 0.05). (F) Confocal image of fsIN recorded in a GAD67-GFP mouse (green), filled with Biocytin (pink), and identified as PV-positive (blue). Scale bar: 5 μm. (G) Left: Example traces of spike responses to a 200 pA/500 ms current injection in PV-positive INs from PV-Cre reporter mice (pvIN) receiving mPFC (black) or vHC inputs (blue). Scale bar: 20 mV/100 ms. Right: Input-output curves show that pvINs receiving mPFC vs. vHC inputs fire with significantly higher frequency (*p < 0.05). (H) Left: Spike waveforms in pvINs with mPFC and vHC input. Scale bar: 20 mV/2 ms. Right: Spike half-width and fAHP were similar for pvINs with mPFC or vHC input. Spike half width: 0.6 ± 0.1 ms vs. 0.5 ± 0.0 ms; fAHP −17.9 ± 1.1 vs. −19.7 ± 2.1 mV; p > 0.05. (I) Relative distribution (%) of purely excitatory (open bars) and additional inhibitory response types (early IPSP: closed bars, late IPSP: striped bars) in nfsINs, fsINs, and pvINs. Occurrence of inhibitory response types for mPFC→nfsIN: early 34%, late 14%, n = 29; mPFC→fsIN: early 33%, late 0%, n = 6; vHC→nfsIN: early 22%, late 0%, n = 9; and vHC→fsIN: early 0%, late 0%, n = 7. No significant differences were found between inputs or cell types (Fisher's Exact Test, p > 0.05). (J) Wiring scheme of different interneuron types in upon activation of mPFC and vHC afferents.

Similar articles

Cited by

References

    1. Amano T., Duvarci S., Popa D., Pare D. (2011). The fear circuit revisited: contributions of the basal amygdala nuclei to conditioned fear. J. Neurosci. 31, 15481–15489 10.1523/JNEUROSCI.3410-11.2011 - DOI - PMC - PubMed
    1. Berndt A., Schoenenberger P., Mattis J., Tye K. M., Deisseroth K., Hegemann P., et al. (2011). High-efficiency channelrhodopsins for fast neuronal stimulation at low light levels. Proc. Natl. Acad. Sci. U.S.A. 108, 7595–7600 10.1073/pnas.1017210108 - DOI - PMC - PubMed
    1. Bissière S., Humeau Y., Lüthi A. (2003). Dopamine gates LTP induction in lateral amygdala by suppressing feedforward inhibition. Nat. Neurosci. 6, 587–592 10.1038/nn1058 - DOI - PubMed
    1. Bouton M. E., Westbrook R. F., Corcoran K. A., Maren S. (2006). Contextual and temporal modulation of extinction: behavioral and biological mechanisms. Biol. Psychiatry 60, 352–360 10.1016/j.biopsych.2005.12.015 - DOI - PubMed
    1. Burgos-Robles A., Vidal-Gonzalez I., Quirk G. J. (2009). Sustained conditioned responses in prelimbic prefrontal neurons are correlated with fear expression and extinction failure. J. Neurosci. 29, 8474–8482 10.1523/JNEUROSCI.0378-09.2009 - DOI - PMC - PubMed

LinkOut - more resources