. 2014 Jul 20;21(3):368-83.
doi: 10.1089/ars.2013.5543. Epub 2014 May 5.

Association between foldability and aggregation propensity in small disulfide-rich proteins

Affiliations

Association between foldability and aggregation propensity in small disulfide-rich proteins

Hugo Fraga et al. Antioxid Redox Signal. .

Abstract

Aims: Disulfide-rich domains (DRDs) are small proteins whose native structure is stabilized by the presence of covalent disulfide bonds. These domains are versatile and can perform a wide range of functions. Many of these domains readily unfold on disulfide bond reduction, suggesting that in the absence of covalent bonding they might display significant disorder.

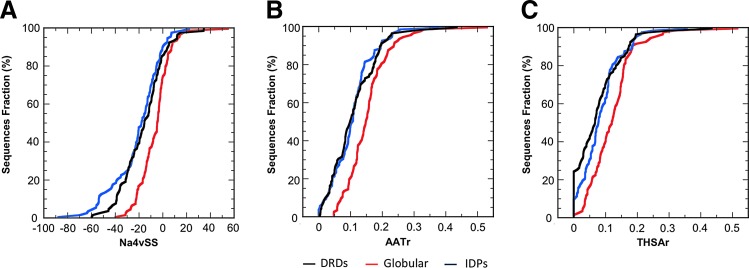
Results: Here, we analyzed the degree of disorder in 97 domains representative of the different DRDs families and demonstrate that, in terms of sequence, many of them can be classified as intrinsically disordered proteins (IDPs) or contain predicted disordered regions. The analysis of the aggregation propensity of these domains indicates that, similar to IDPs, their sequences are more soluble and have less aggregating regions than those of other globular domains, suggesting that they might have evolved to avoid aggregation after protein synthesis and before they can attain its compact and covalently linked native structure.

Innovation and conclusion: DRDs, which resemble IDPs in the reduced state and become globular when their disulfide bonds are formed, illustrate the link between protein folding and aggregation propensities and how these two properties cannot be easily dissociated, determining the main traits of the folding routes followed by these small proteins to attain their native oxidized states.


Figures

<b>FIG. 1.</b>
FIG. 1.
Prediction of protein disorder in DRDs. Percentage of DRDs and their mutated variants predicted to be disordered according to (A) FoldUnfold, (B) FoldIndex, and (C) RONN algorithms. The fraction of DRDs sequences predicted to be unfolded is represented by black bars. In (C), the remaining domains with at least 10 consecutive residues predicted as disordered are represented by gray bars. Disorder predictions are shown for wt domains, DRDs mutants with cysteine mutated to alanine (Cys/Ala), and variants with cysteine mutated to serine (Cys/Ser). In (A), predictions for DRDs with cysteine mutated to a hypothetical amino acid X with the average packing density of the 20 natural amino acids (Cys/X) are also shown. wt, wild-type; DRD, disulfide-rich domain; RONN, regional order neural network.
<b>FIG. 2.</b>
FIG. 2.
Distribution of changes in DRDs stability upon mutation. Changes in free energy of unfolding (ΔΔG) computed using the FoldX forcefield for Cys to Ala (yellow) and Cys to Ser (blue) mutants. Stability changes are represented as histograms that were calculated using 5 kcal·mol−1 bins, and histogram data were fitted to Gaussian distributions (black lines). To see this illustration in color, the reader is referred to the web version of this article at www.liebertpub.com/ars
<b>FIG. 3.</b>
FIG. 3.
Comparison of the aggregation properties of DRDs, small globular proteins, and IDPs. Value distribution of different parameters indicative of protein aggregation capability calculated using the AGGRESCAN algorithm: (A) average aggregation propensity (Na4vSS), (B) area of the aggregation profile above the threshold per residue (AATr), and (C) total area of the aggregation peaks – Hot Spots – per residue (THSAr). The distributions are shown in black for DRDs and in red or blue for the datasets of globular proteins or IDPs, respectively. IDP, intrinsically disordered protein. To see this illustration in color, the reader is referred to the web version of this article at www.liebertpub.com/ars
<b>FIG. 4.</b>
FIG. 4.
Comparison of the amino-acid composition of DRDs and small globular proteins. Differential composition of DRDs relative to the Swiss-Prot database 2013. Differential abundances are shown for each natural amino acid except cysteine (included in the computational analysis but not represented).
<b>FIG. 5.</b>
FIG. 5.
Predicted chaperone binding to DRDs, small globular proteins, and IDPs. Distribution of the number of chaperone binding sites per protein predicted with LIMBO for (A) the dataset of globular proteins, (B) DRDs, and (C) the dataset of IDPs.
<b>FIG. 6.</b>
FIG. 6.
Relationship between DRDs aggregation properties and their foldability. APRs detected by employing the AGGRESCAN algorithm (in red), disordered segments predicted with FoldIndex (in blue), and domain regions where APRs and disordered fragments overlap (in magenta) are mapped over (A) LDTI (PDB: 2kmo), (B) hirudin (PDB: 2hir), (C) The ligand binding module five (LA5) of the low-density lipoprotein receptor (PDB: 1AJJ), (D) BPTI (PDB: 1d0d) and (E) TAP (PDB: 1d0d) structures. Unfoldability profiles computed with FoldIndex are shown below its corresponding structure for each domain; green and blue indicate folded and disordered regions, respectively. APRs, aggregation-prone regions; BPTI, bovine pancreatic trypsin inhibitor; LDTI, leech-derived trypsin inhibitor; TAP, tick anticoagulant peptide. To see this illustration in color, the reader is referred to the web version of this article at www.liebertpub.com/ars
<b>FIG. 7.</b>
FIG. 7.
Light scattering and Th-T binding of BPTI and TAP β-sheet peptides. Light scattering after incubation of (A) β1 peptides from BPTI (red) and TAP (blue) and (B) β2 peptides from BPTI (red) and TAP (blue) in the presence of TCEP. Th-T binding after incubation of (C) β1 peptides from BPTI (red) and TAP (blue) and (D) β2 peptides from BPTI (red) and TAP (blue) in the presence of TCEP. Black lines represent buffer scattering and free Th-T fluorescence, respectively. TCEP, tris(2-carboxyethyl)phosphine; Th-T, Thioflavin-T. To see this illustration in color, the reader is referred to the web version of this article at www.liebertpub.com/ars
<b>FIG. 8.</b>
FIG. 8.
CR binding, structural and morphological properties of BPTI and TAP β2 peptides incubated in the presence of TCEP. (A) Absorbance spectra of free CR (black) and after addition of β2-BPTI (red) or β2-TAP (blue) peptides after incubation. (B) Differential spectra of CR bound to β2-BPTI (red) or β2-TAP (blue) subtracted with free CR spectrum. (C) ATR-FTIR spectra of aggregated β2-BPTI (red) and β2-TAP (blue). IR spectra were deconvoluted to a maximum of five Gaussians. TEM micrographs of (D) β2-TAP and (E) β2-BPTI aggregates. CR, Congo red; ATR-FTIR, attenuated total reflectance–Fourier transform infrared spectroscopy; TEM, transmission electron microscopy. To see this illustration in color, the reader is referred to the web version of this article at www.liebertpub.com/ars
<b>FIG. 9.</b>
FIG. 9.
Conformational properties and oxidative folding of NvCI. (A) APRs detected employing the AGGRESCAN algorithm (in red), disordered segments predicted with FoldIndex (in blue) and domain regions where APRs and disordered fragments overlap (in magenta) are mapped over the NvCI structure (PDB: 4A94). (B) Unfoldability profile computed with FoldIndex; green and blue indicate folded and disordered regions, respectively. (C) NvCI reductive unfolding was followed after TCEP addition. The normalized area under each Trp fluorescence spectrum was plotted as a function of time. (D) TCEP 20 mM was added to oxidized NvCI, and Trp emission spectrum was recorded demonstrating a large structural shift on protein reduction (native and reduced fluorescence spectra are shown in blue and black, respectively). (E) In agreement with Trp intrinsic fluorescence, significant changes in NvCI secondary structure are observed when oxidized NvCI is reduced with TCEP (native and reduced CD spectra are shown in blue and black, respectively). (F) Time-dependent NvCI oxidation was followed by acid trapping and RP-HPLC. As predicted from its intrinsic properties, NvCI displays fast kinetics and its oxidative folding pathway involves the formation of only two major intermediates. R and N indicate the reduced and native states, respectively. NvCI, Nerita versicolor inhibitor. To see this illustration in color, the reader is referred to the web version of this article at www.liebertpub.com/ars

References

    1. Anfinsen CB, Haber E, Sela M, and White FHJ. The kinetics of formation of native ribonuclease during oxidation of the reduced polypeptide chain Proc Natl Acad Sci U S A 47: 1309–1314, 1961 - PMC - PubMed
    1. Arias-Moreno X, Arolas JL, Aviles FX, Sancho J, and Ventura S. Scrambled isomers as key intermediates in the oxidative folding of ligand binding module 5 of the low density lipoprotein receptor. J Biol Chem 283: 13627–13637, 2008 - PubMed
    1. Arolas JL, Aviles FX, Chang JY, and Ventura S. Folding of small disulfide-rich proteins: clarifying the puzzle. Trends Biochem Sci 31: 292–301, 2006 - PubMed
    1. Arolas JL, Bronsoms S, Aviles FX, Ventura S, and Sommerhoff CP. Oxidative folding of leech-derived tryptase inhibitor via native disulfide-bonded intermediates. Antioxid Redox Signal 10: 77–85, 2008 - PubMed
    1. Arolas JL, Bronsoms S, Lorenzo J, Aviles FX, Chang JY, and Ventura S. Role of kinetic intermediates in the folding of leech carboxypeptidase inhibitor. J Biol Chem 279: 37261–37270, 2004 - PubMed

Publication types

LinkOut - more resources