Review
. 2014 Aug;142(4):526-35.
doi: 10.1111/imm.12284.

Current approaches to fine mapping of antigen-antibody interactions

Affiliations
Review

Current approaches to fine mapping of antigen-antibody interactions

W Mark Abbott et al. Immunology. 2014 Aug.

Abstract

A number of different methods are commonly used to map the fine details of the interaction between an antigen and an antibody. Undoubtedly the method that is now most commonly used to give details at the level of individual amino acids and atoms is X-ray crystallography. The feasibility of undertaking crystallographic studies has increased over recent years through the introduction of automation, miniaturization and high throughput processes. However, this still requires a high level of sophistication and expense and cannot be used when the antigen is not amenable to crystallization. Nuclear magnetic resonance spectroscopy offers a similar level of detail to crystallography but the technical hurdles are even higher such that it is rarely used in this context. Mutagenesis of either antigen or antibody offers the potential to give information at the amino acid level but suffers from the uncertainty of not knowing whether an effect is direct or indirect due to an effect on the folding of a protein. Other methods such as hydrogen deuterium exchange coupled to mass spectrometry and the use of short peptides coupled with ELISA-based approaches tend to give mapping information over a peptide region rather than at the level of individual amino acids. It is quite common to use more than one method because of the limitations and even with a crystal structure it can be useful to use mutagenesis to tease apart the contribution of individual amino acids to binding affinity.

Keywords: antibodies; antigens; crystallography; epitopes; peptides; structural biology.


Figures

Figure 1
Figure 1
Wall-eyed stereo representation of the interleukin-17A (IL-17A) epitope recognized by CAT-2200. Residues from the IL-17A homodimer are shown in pale or dark yellow. Residues from the Fab fragments are shown with the light chain in blue and with the heavy chain in green. Labelled residues allow the interactions listed in table 2 from ref. to be readily located. Reproduced with permission from ref. .
Figure 2
Figure 2
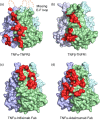
A comparison of the interface between tumour necrosis factor-α (TNF-α) and receptors and infliximab/adalimumab Fab complexes. A comparison of the interface between TNF-α and receptors and monoclonal antibodies is shown. TNF-α from the complex structures is represented as a coloured surface with TNFR2 and the monoclonal antibody Fabs interface highlighted in red at one of three interfaces on the TNF-α trimer. The E-F loop region, which is missing in the TNF-α–TNFR2 (a) complex because of a lack of interaction, is labelled. The TNF-β from the TNF-β–TNFR1 (b) complex structure is shown as a coloured surface with one of the TNFR1-binding sites highlighted in red. The TNF-α–infliximab Fab (c) and the TNF-α–adalimumab Fab (d) interfaces are shown as coloured surfaces with TNF-α-binding sites highlighted in red. Reproduced with permission from ref. .
Figure 3
Figure 3
Interactions between Fab 1C1 and EphA2. (a) Three-dimensional view of the Fab 1C1/EphA2 complex. Fab 1C1 heavy chain and light chain are shown in magenta and beige, respectively. Human EphA2 ligand binding domain (LBD) is shown in cyan. (b) Stereographic representations of the intermolecular contacts between human EphA2 and Fab 1C1 CDRH3. Fab 1C1 and human EphA2 are shown in magenta and cyan, respectively. Nitrogen and oxygen atoms are shown in blue and red, respectively. The corresponding interface includes several hydrogen bonds shown as black dotted lines. (c) Fab 1C1 CDRH3 penetrates into a channel of the EphA2 molecule via its predominantly hydrophobic tip. Sulphur atoms are shown in yellow, whereas the rest of the colour code is identical to that in (b). (d) The maximum likelihood weighted 2mFo-DFc electron density map is shown around the area of Fab 1C1 CDRH3 penetration into EphA2. Colour code is identical to that in (b). The map is contoured at 1·5 σ. Reproduced with permission from ref. .
Figure 4
Figure 4
Nuclear magnetic resonance (NMR) epitope mapping by backbone amide chemical shift analysis. The representative superposition of the two-dimensional 15N TROSY NMR spectra of free (shown as black NMR resonances) 15N isotope-labelled human interleukin-1β (IL-1β) and in complex with the unlabelled gevokizumab Fab (shown as red NMR resonances) with the assignment as indicated. Two small regions from the spectra demonstrate NMR resonances undergoing no chemical shift (e.g. C8, E64, and L10), minor chemical shifts (e.g. V19, K27, S34, S70, and F146), line broadening (e.g. K27), and disappearance or incapability of being reassigned (e.g. V72 and Y121) upon binding. Reproduced with permission from ref. .
Figure 5
Figure 5
Alanine-scanning mutagenesis of interleukin-13 (IL-13). (a) Relative binding of the fluorescence-labelled CNTO607 monoclonal antibody to the IL-13 muteins measured by ELISA. Wild-type IL-13 is 100%. (b) Ribbon presentation of IL-13 with mutated residues shown as sticks (relative binding of 0–30%, yellow; 30–70%, green; > 70%, cyan). Reproduced with permission from Ref. .

References

    1. Lindsley CW. The top prescription drugs of 2012 globally: biologics dominate, but small molecule CNS drugs hold on to top spots. ACS Chem Neurosci. 2013;4:905–7. - PMC - PubMed
    1. Wu TT, Kabat EA. An analysis of the sequences of the variable regions of Bence Jones proteins and myeloma light chains and their implications for antibody complementarity. J Exp Med. 1970;132:211–50. - PMC - PubMed
    1. Chothia C, Lesk AM. Canonical structures for the hypervariable regions of immunoglobulins. J Mol Biol. 1987;196:901–17. - PubMed
    1. Lefranc MP, Pommie C, Kaas Q, et al. IMGT unique numbering for immunoglobulin and T cell receptor constant domains and Ig superfamily C-like domains. Dev Comp Immunol. 2005;29:185–203. - PubMed
    1. Kunik V, Ashkenazi S, Ofran Y. Paratome: an online tool for systematic identification of antigen-binding regions in antibodies based on sequence or structure. Nucleic Acids Res. 2012;40:W521–4. (Web Server issue) - PMC - PubMed

MeSH terms

Substances