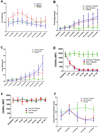
Peanut oral immunotherapy results in increased antigen-induced regulatory T-cell function and hypomethylation of forkhead box protein 3 (FOXP3)
- PMID: 24636474
- PMCID: PMC4121175
- DOI: 10.1016/j.jaci.2013.12.1037
Peanut oral immunotherapy results in increased antigen-induced regulatory T-cell function and hypomethylation of forkhead box protein 3 (FOXP3)
Abstract
Background: The mechanisms contributing to clinical immune tolerance remain incompletely understood. This study provides evidence for specific immune mechanisms that are associated with a model of operationally defined clinical tolerance.
Objective: Our overall objective was to study laboratory changes associated with clinical immune tolerance in antigen-induced T cells, basophils, and antibodies in subjects undergoing oral immunotherapy (OIT) for peanut allergy.
Methods: In a phase 1 single-site study, we studied participants (n = 23) undergoing peanut OIT and compared them with age-matched allergic control subjects (n = 20) undergoing standard of care (abstaining from peanut) for 24 months. Participants were operationally defined as clinically immune tolerant (IT) if they had no detectable allergic reactions to a peanut oral food challenge after 3 months of therapy withdrawal (IT, n = 7), whereas those who had an allergic reaction were categorized as nontolerant (NT; n = 13).
Results: Antibody and basophil activation measurements did not statistically differentiate between NT versus IT participants. However, T-cell function and demethylation of forkhead box protein 3 (FOXP3) CpG sites in antigen-induced regulatory T cells were significantly different between IT versus NT participants. When IT participants were withdrawn from peanut therapy for an additional 3 months (total of 6 months), only 3 participants remained classified as IT participants, and 4 participants regained sensitivity along with increased methylation of FOXP3 CpG sites in antigen-induced regulatory T cells.
Conclusion: In summary, modifications at the DNA level of antigen-induced T-cell subsets might be predictive of a state of operationally defined clinical immune tolerance during peanut OIT.
Keywords: APC; Antigen-induced regulatory T; Antigen-presenting cell; CD40 ligand; CD40L; CFSE; Carboxyfluorescein succinimidyl ester; DBPCFC; DC; Dendritic cell; Double-blind, placebo-controlled food challenge; Effector CD4(+) T; FOXP3; Food allergy; Forkhead box protein 3; IT; Immune tolerant; Induced regulatory T; LAG3; Lymphocyte activation gene 3; MFI; Mean fluorescence intensity; NT; Natural regulatory T; Nonspecific regulatory T; Nontolerant; OFC; OIT; Oral food challenge; Oral immunotherapy; Regulatory T; SPT; Skin prick test; T(R)1; Teff; Treg; Type 1 regulatory T; T regulatory cells; ai-Treg; allergy; desensitization; epigenetics; forkhead box protein 3; iTreg; nTreg; ns-Treg; oral immunotherapy; peanut; tolerance.
Copyright © 2014 American Academy of Allergy, Asthma & Immunology. Published by Mosby, Inc. All rights reserved.
Figures


References
-
- James LK, Shamji MH, Walker SM, Wilson DR, Wachholz PA, Francis JN, Jacobson MR, Kimber I, Till SJ, Durham SR. Long-term tolerance after allergen immunotherapy is accompanied by selective persistence of blocking antibodies. J Allergy Clin Immunol. 2011 Feb;127(2):509–516. Pub Med PMID: 21281875. - PubMed
-
- Akdis CA, Akdis M, Blesken T, Wymann D, Alkan SS, Muller U, et al. Epitope-specific T cell tolerance to phospholipase A2 in bee venom immunotherapy and recovery by IL-2 and IL-15 in vitro. The Journal of Clinical Investigation. 1996 Oct 1;98(7):1676–1683. PubMed PMID: 8833918. Pubmed Central PMCID: 507602. - PMC - PubMed
-
- Akdis CA, Blaser K. Role of IL-10 in allergen-specific immunotherapy and normal response to allergens. Microbes and infection / Institut Pasteur. 2001 Sep;3(11):891–898. PubMed PMID: 11564436. - PubMed
-
- Chen Y, Kuchroo VK, Inobe J, Hafler DA, Weiner HL. Regulatory T cell clones induced by oral tolerance: suppression of autoimmune encephalomyelitis. Science. 1994 Aug 26;265(5176):1237–1240. PubMed PMID: 7520605. - PubMed
-
- Powrie F, Correa-Oliveira R, Mauze S, Coffman RL. Regulatory interactions between CD45RBhigh and CD45RBlow CD4+ T cells are important for the balance between protective and pathogenic cell-mediated immunity. The Journal of Experimental Medicine. 1994 Feb 1;179(2):589–600. PubMed PMID: 7905019. Pubmed Central PMCID: 2191378. - PMC - PubMed
Publication types
MeSH terms
Substances
Grants and funding
LinkOut - more resources
Full Text Sources
Other Literature Sources
Research Materials
Miscellaneous

