

Hemoglobin A1c assay variations and implications for diabetes screening in obese youth
- PMID: 24636682
- PMCID: PMC4167160
- DOI: 10.1111/pedi.12132
Hemoglobin A1c assay variations and implications for diabetes screening in obese youth
Abstract
Background: Standardization of the hemoglobin A1c (A1c) assay has led to its increasing utilization as a screening tool for the diagnosis of prediabetes and type 2 diabetes in youth. However, significant A1c assay variability remains and has implications for clinical management.
Objective: To describe our center's experiences with A1c results in youth and to evaluate inter-method differences and their clinical implications.
Subjects: Seventy-five youth (aged 10-18 yr old), body mass index (BMI) ≥85th‰ participated.
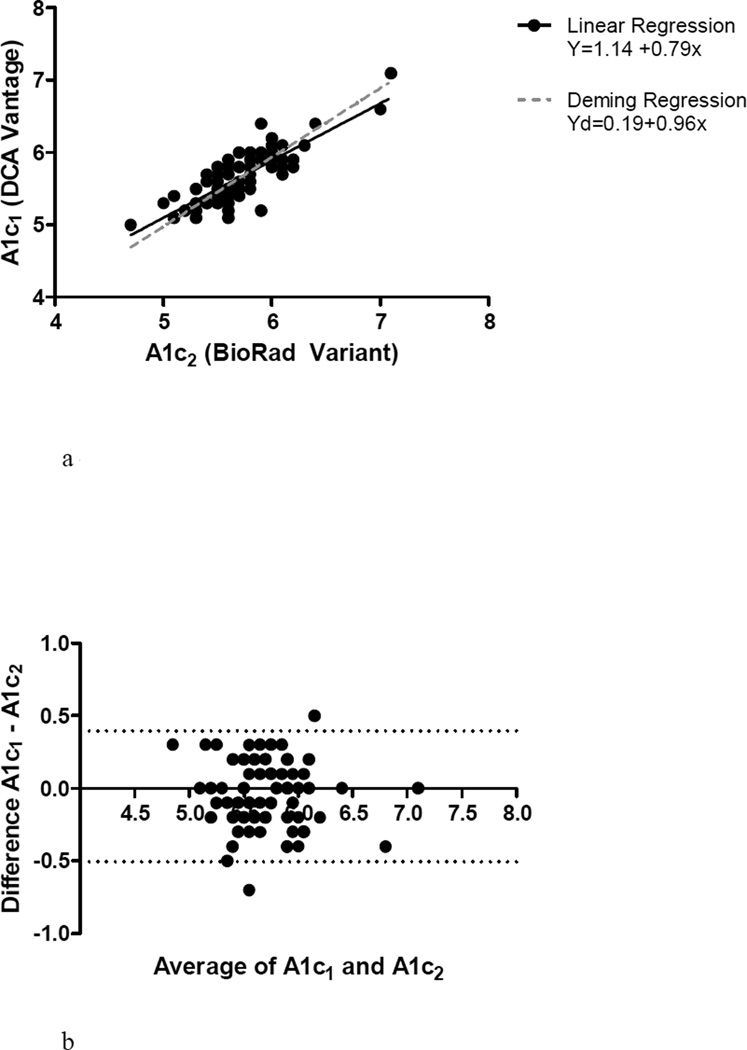
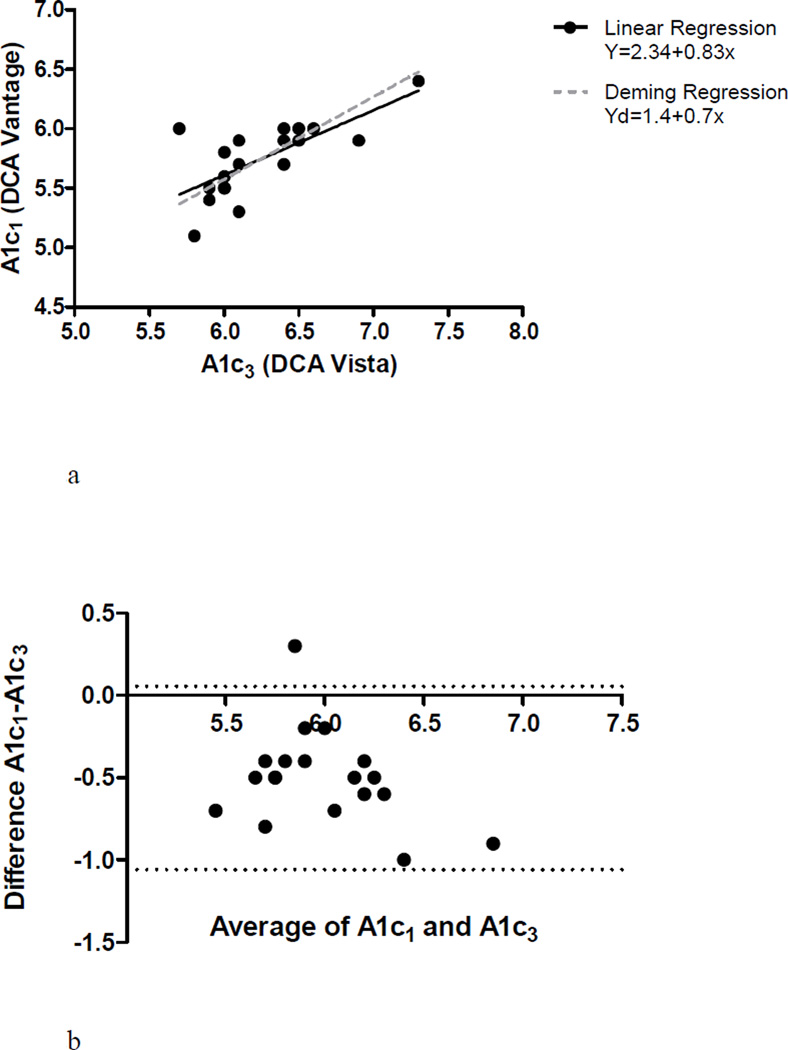
Methods: Seventy-two participants had two A1c values performed on the same sample, one via immunoassay (DCA Vantage Analyzer, A1c1 ) and the other via high performance liquid chromatography (Bio-Rad Variant II, A1c2 ). Nineteen had A1c run on two immunoassay devices (A1c1 and Dimensions Vista, A1c3 ).
Results: Mean age of participants was 13.9 years, BMI% 97.89%, 33% male, 16% white, 21% black, and 61% Hispanic (H). Mean A1c1 was 5.68% ± 0.38 vs. a mean A1c2 of 5.73% ± 0.39, p = 0.049. Concordance in diabetes status between methods was achieved in 79% of subjects. Nineteen subjects with A1c3 results had testing performed an average of 22 ± 9 days prior to A1c1 . Mean A1c3 was 6.24% ± 0.4, compared to a mean A1c1 of 5.74% ± 0.31, (p < 0.0001). A1c1 was on average systematically -0.5 ± 0.28 lower compared to A1c3 . There was poor agreement in diabetes classification between A1c1 and A1c3 , with a concordance in classification between methods of only 36.8%.
Conclusions: Clinically significant inter-method A1c variability exists that impacts patient classification and treatment recommendations. In the screening of obese youth for diabetes, A1c results should be interpreted with caution.
Keywords: hemoglobin A1c; obesity; prediabetes; type 2 diabetes.
© 2014 John Wiley & Sons A/S. Published by John Wiley & Sons Ltd.
Conflict of interest statement
The authors have no relevant disclosures or conflicts of interest.
Figures
References
-
- Love-Osborne KA, Sheeder J, Svircev A, Chan C, Zeitler P, Nadeau KJ. Use of glycosylated hemoglobin increases diabetes screening for at-risk adolescents in primary care settings. Pediatr Diabetes. 2013 - PubMed
-
- Holmes EW, Ersahin C, Augustine GJ, Charnogursky GA, Gryzbac M, Murrell JV, et al. Analytic bias among certified methods for the measurement of hemoglobin A1c: a cause for concern? Am J Clin Pathol. 2008;129(4):540–547. - PubMed
-
- Petersen JR, Omoruyi FO, Mohammad AA, Shea TJ, Okorodudu AO, Ju H. Hemoglobin A1c: assessment of three POC analyzers relative to a central laboratory method. Clin Chim Acta. 2010;411(23–24):2062–2066. - PubMed
Publication types
MeSH terms
Substances
Grants and funding
LinkOut - more resources
Full Text Sources
Other Literature Sources
Medical
Research Materials
