. 2014 Mar 15;28(6):652-64.
doi: 10.1101/gad.230318.113.

DNA methylation is required for the control of stem cell differentiation in the small intestine

Affiliations

DNA methylation is required for the control of stem cell differentiation in the small intestine

Karyn L Sheaffer et al. Genes Dev. .

Abstract

The mammalian intestinal epithelium has a unique organization in which crypts harboring stem cells produce progenitors and finally clonal populations of differentiated cells. Remarkably, the epithelium is replaced every 3-5 d throughout adult life. Disrupted maintenance of the intricate balance of proliferation and differentiation leads to loss of epithelial integrity or barrier function or to cancer. There is a tight correlation between the epigenetic status of genes and expression changes during differentiation; however, the mechanism of how changes in DNA methylation direct gene expression and the progression from stem cells to their differentiated descendants is unclear. Using conditional gene ablation of the maintenance methyltransferase Dnmt1, we demonstrate that reducing DNA methylation causes intestinal crypt expansion in vivo. Determination of the base-resolution DNA methylome in intestinal stem cells and their differentiated descendants shows that DNA methylation is dynamic at enhancers, which are often associated with genes important for both stem cell maintenance and differentiation. We establish that the loss of DNA methylation at intestinal stem cell gene enhancers causes inappropriate gene expression and delayed differentiation.

Keywords: DNA methylation; Dnmt1; intestinal stem cell.


Figures
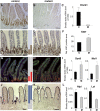
Figure 1.
Figure 1.
Conditional ablation of DNMT1 in vivo causes crypt expansion. (A,B) Immunohistochemical staining of Dnmt1 protein in Dnmt1lox/lox (control) (A) and Dnmt1lox/lox; Villin-Cre-ERT2 (mutant) (B) mice. Dnmt1 protein is absent from the adult mouse small intestinal epithelium 6 d after tamoxifen treatment. Bars, 50 μm. (C) Dnmt1 mRNA expression by qRT–PCR shows a 90% decrease in the mutant intestinal epithelium. mRNA levels are expressed relative to those of Gapdh. Mean ± SE; n ≥ 11; (***) P < 0.001 by t-test. (D,E) Immunohistochemical staining of Ki67 shows an increased number of proliferative crypt cells in the mutant (E) intestinal epithelium compared with control (D). (F) Quantification of the Ki67-positive area (percentage relative to villous height). Mean ± SE; n = 4; (**) P < 0.01 by t-test. (G,H) Immunofluorescence staining of Sox9 (red) and E-cadherin (green) shows an increased number of undifferentiated crypt cells in the mutant (H) intestinal epithelium compared with control (G). Nuclei were stained with DAPI. (I) SRY-box9 (Sox9) and Musashi1 (Msi1) mRNA expression analysis by qRT–PCR shows increased expression of ISC genes in mutant intestinal epithelial crypt cells. mRNA levels are expressed relative to those of Gapdh. Mean ± SE; n ≥ 4; (*) P < 0.05 by t-test. (J,K) AP staining in control (J) and mutant (K) intestines. Mutants show decreased area of AP-positive cells. (L) AP (Alpi) and Lct mRNA expression by qRT–PCR shows decreased enterocyte markers in mutant intestinal epithelium villous cells. mRNA levels are expressed relative to those of Gapdh. Mean ± SE; n ≥ 6; (*) P < 0.05; (**) P < 0.01 by t-test.
Figure 2.
Figure 2.
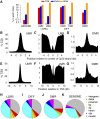
Dynamic changes in DNA methylation during intestinal differentiation. (A) The percent of CpG islands (CGI; red), shores of CpG islands (blue), and the rest of the genome (“other”; yellow) compared with UMRs and LMRs in LGR5+ cells and differentiated cells and in DMRs. CpG islands and shores constitute only a small portion (0.4% and 2.4%) of the genome but are enriched in UMRs in both cells as well as (to a lesser extent) in DMRs. LMRs are typically found outside of CpG islands and shores. “Genome” indicates the percentage of the mappable mouse genome in each category. (B–D) Positional analysis of UMRs, LMRs, and DMRs located within ±5 kb of the center of a CpG island. In LGR5+ cells, UMRs (D) are found enriched within CpG islands, and LMRs (E) are excluded from CpG islands. (F) DMRs are found enriched within CpG islands. (E–G) Positional analysis of UMRs, LMRs, and DMRs within ±10 kb of the TSS. In LGR5 cells, LGR5+ (E) are found enriched over the TSS, and LMRs (F) are found excluded from the TSS. (G) DMRs are enriched at the TSS and span over the proximal portion of the gene body (first exon and intron). (H–K) Genomic regional analysis of all UMRs, LMRs, and DMRs. The majority UMRs and LMRs in in LGR5 (H) and DIFF (I) cells were found in introns and intergenic regions. (J) DMRs were enriched in introns and distal promoters. (K) The representation of the regions analyzed in the mouse genome. Regional definitions: proximal, 0 to −1 kb from the TSS; distal, −1 kb to −5 kb from the TSS; caudal, +5 kb from the end the of 3′ UTR.
Figure 3.
Figure 3.
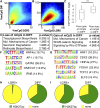
DMRs are associated with active intestinal enhancer regions. (A,B) Comparison of DNA methylation of all UMRs (A) or LMRs (B) between LGR5 and DIFF cells (density [i.e., number of regions] increases from blue to red). Generally, UMRs show increased methylation in DIFF cells compared with LGR5 cells, while LMRs show methylation changes in both directions. (C) Expression analysis of genes associated with DMRs located within promoter regions (5000 base pairs [bp] upstream of the TSS). DMRs that lose methylation correlate with higher gene expression in DIFF cells compared with DMRs that gain methylation. The whiskers of the box plot correspond to 10% and 90% of the distribution. (***) P < 0.001 by t-test. (D,E) Pathway analysis for genes associated with DMRs. (D) Genes associated with regions that lose methylation following differentiation show enrichment of metabolism genes that are expressed in differentiated cells. (E) Regions that gain methylation in differentiated cells are associated with genes important for ISCs. (F,G) De novo motif analysis of DMRs show that regions that lose methylation in differentiated cells (F) are enriched in differentiation-specific transcription factor motifs, and regions that gain methylation in differentiated cells (G) are enriched in ISC transcription factor motifs. Percentage reflects the fraction of regions that were found with each motif within the specific group of DMRs. (H,I) Percentage of DMRs that lose DNA methylation (H) or gain methylation (I) that show overlap with regions that contain H3K27ac in either LGR5 or DIFF cells. (H) DMRs that lose methylation during differentiation show a dramatic gain in H3K27ac (LGR5: 2%; DIFF: 65%). (I) DMRs that gain methylation are marked with H3K27ac in both LGR5 and DIFF cells (LGR5: 59%; DIFF: 71%).
Figure 4.
Figure 4.
DMRs are associated with intestinal-specific genes and correlate with expression during differentiation. (A) Partial list of genes with differential mRNA expression and associated DMRs in LGR5+ stem cells compared with differentiated cells. Transcripts with increased expression in LGR5+ stem cells were categorized as ISC genes or progenitor genes as described in the text. Transcripts with increased expression in villous cells were categorized as differentiation-induced genes. Genes are listed with the number of associated DMRs, average change in methylation (DIFF–LGR5) and corresponding P-value, and mRNA fold change (DIFF–LGR5) and corresponding P-value. (B–D) Verification of DMRs by bisulfite sequencing. Three biological replicates of LGR5+ and DIFF cells were used to verify identified DMRs by targeted bisulfite sequencing to determine methylation at the single-CpG level and regional average. DIFF cells show increased regional average methylation at the DMRs associated with Olfm4 (LGR5: 2.2% ± 1.4%; DIFF: 5.1% ± 1.2%) (B) and Hes1 (LGR5: 3.7% ± 2.9%; DIFF: 9.5% ± 2.1%) (C). (D) DIFF cells show decreased regional average methylation at the DMR associated with Lct (LGR5: 49.8% ± 10.5%; DIFF: 18.9% ± 5.9%). (*) P < 0.05; (**) P < 0.01; (***) P < 0.001 by t-test.
Figure 5.
Figure 5.
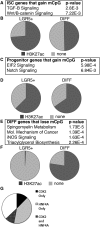
Differentially methylated genes are associated with transcription factor binding. (A,C,E) Pathway analysis of ISC (A), progenitor (C), and differentiation-induced (E) genes associated with DMRs. (B,D,F) Overlap of the H3K27ac enhancer mark in LGR5+ and DIFF cells and DMRs found associated with ISC genes (B), progenitor genes (D), and differentiation genes (F). ISC DMRs are more highly enriched for the H3K27ac mark in LGR5 cells (LGR5: 74%; DIFF: 55%). DIFF DMRs are more highly enriched for the H3K27ac mark in the DIFF cells (LGR5: 0.9%; DIFF: 77%). Progenitor DMRs show little change between LGR5 and DIFF cells (LGR5: 63%; DIFF: 65%). (G) Overlap of CDX2 and HNF4α Chip-seq peaks (Verzi et al. 2013) with DMRs found associated with differentiation genes. The majority of DMRs (72%) show binding of HNF4α and CDX2, suggesting enhancer activity.
Figure 6.
Figure 6.
DNA methylation correlated with gene activity of Olfm4 and Hes1. Comparison of DNA methylation status between LGR5+ and DIFF cells at the ISC-specific gene Olfm4 (A) and the progenitor-specific gene Hes1 (B). Bars represent percent methylation at individual CpGs in differentiated cells (black) and LGR5+ stem cells (green). UMRs and LMRs for differentiated cells (black bars) and LGR5+ stem cells (green bars) as well as DMRs (blue bars) are designated. CpG islands (CGI), CpG island ±2 kb (CGI shores), ChIP-seq peaks for H3K27ac (yellow), CDX2 (red), and HNF4A (red) are also indicated. Red arrows mark regions that were independently verified by region-specific bisulfite sequencing.
Figure 7.
Figure 7.
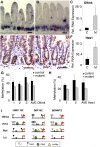
Loss of DNMT1 causes activation of Olfm4 and Hes1. (A,B) In situ hybridization of Olfm4 shows increased RNA expression zone in intestinal crypts of mutant (B) compared with control (A) mice. Bars, 50 μm. (C) Olfm4 mRNA expression analysis by qRT–PCR shows increased expression in mutant intestinal epithelial cells. mRNA levels are expressed relative to those of Gapdh. Mean ± SE; n ≥ 4; (*) P = 0.05 by t-test. (D,E) Hes1 protein expression in control (D) and mutant (E) intestine as detected by immunohistochemistry. (F) Hes1 mRNA expression analysis by qRT–PCR shows increased expression in mutant intestinal epithelial cells. Data are relative to Gapdh, mean ± SE; n ≥ 4; (*) P < 0.05 by t-test. (G,H) Pyrosequencing reveals a 10% decrease in average methylation of LMR-129189 (Olfm4) (G) and UMR-138988 (Hes1) (H) in mutant intestinal epithelia compared with control. Methylation at each CpG and the region average are shown. Data are mean ± SE; n ≥ 6; (*) P < 0.05 by t-test. (I) Proposed model of coordination of gene expression during intestinal differentiation. LGR5+ stem cells (LGR5+ ISC), differentiated intestinal epithelial cells (DIFF IEC), and mutant intestinal epithelium (ΔDNMT1). Genes highly expressed in LGR5+ ISCs, such as Olfm4 and Hes1, gain methylation in DIFF intestinal epithelial cells, and expression is repressed. Intestinal enterocyte genes Alpi and Lct are demethylated in DIFF intestinal epithelial cells and bound by Cdx-1 and HNF4α, and expression is activated. Loss of Dnmt1 causes hypomethylation and increased expression of Olfm4 and Hes1.

References

    1. Barker N, van Es JH, Kuipers J, Kujala P, van den Born M, Cozijnsen M, Haegebarth A, Korving J, Begthel H, Peters PJ, et al. 2007. Identification of stem cells in small intestine and colon by marker gene Lgr5. Nature 449: 1003–1007 - PubMed
    1. Barker N, Ridgway RA, van Es JH, van de Wetering M, Begthel H, van den Born M, Danenberg E, Clarke AR, Sansom OJ, Clevers H 2009. Crypt stem cells as the cells-of-origin of intestinal cancer. Nature 457: 608–611 - PubMed
    1. Benoit YD, Pare F, Francoeur C, Jean D, Tremblay E, Boudreau F, Escaffit F, Beaulieu JF 2010. Cooperation between HNF-1α, Cdx2, and GATA-4 in initiating an enterocytic differentiation program in a normal human intestinal epithelial progenitor cell line. Am J Physiol Gastrointest Liver Physiol 298: G504–G517 - PMC - PubMed
    1. Berninger P, Gaidatzis D, van Nimwegen E, Zavolan M 2008. Computational analysis of small RNA cloning data. Methods 44: 13–21 - PubMed
    1. Beuling E, Baffour-Awuah NY, Stapleton KA, Aronson BE, Noah TK, Shroyer NF, Duncan SA, Fleet JC, Krasinski SD 2011. GATA factors regulate proliferation, differentiation, and gene expression in small intestine of mature mice. Gastroenterology 140: 1219–1229.e1–2 - PMC - PubMed

Publication types

MeSH terms

Substances