

Activation of c-Src: a hub for exogenous pro-oxidant-mediated activation of Toll-like receptor 4 signaling
- PMID: 24637265
- PMCID: PMC4037369
- DOI: 10.1016/j.freeradbiomed.2014.03.005
Activation of c-Src: a hub for exogenous pro-oxidant-mediated activation of Toll-like receptor 4 signaling
Abstract
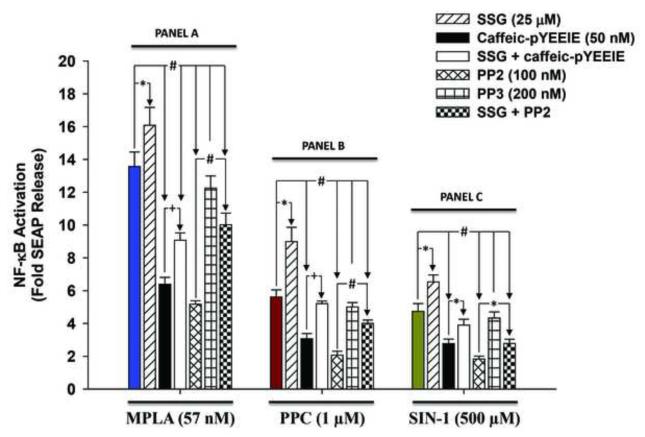
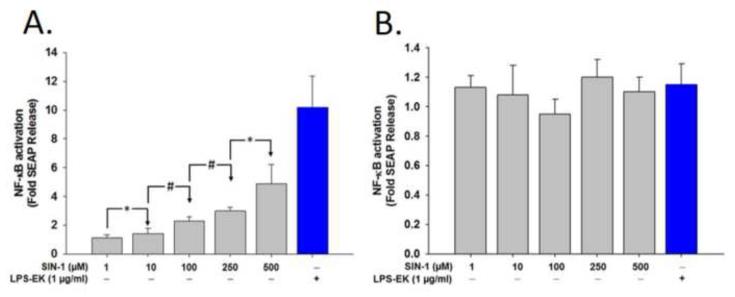
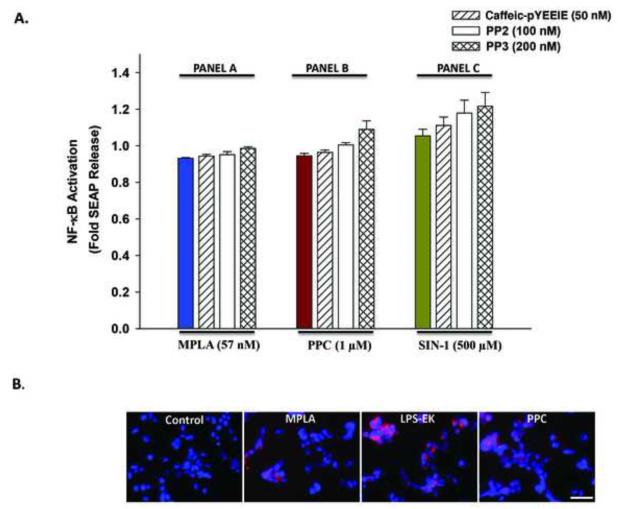
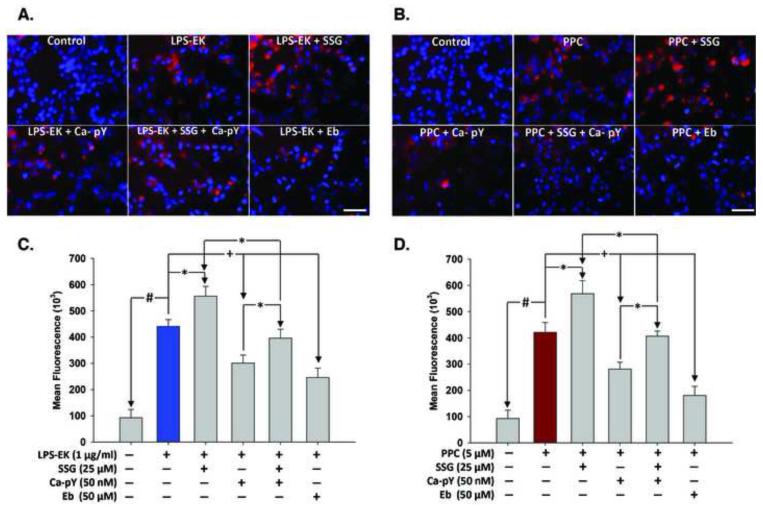
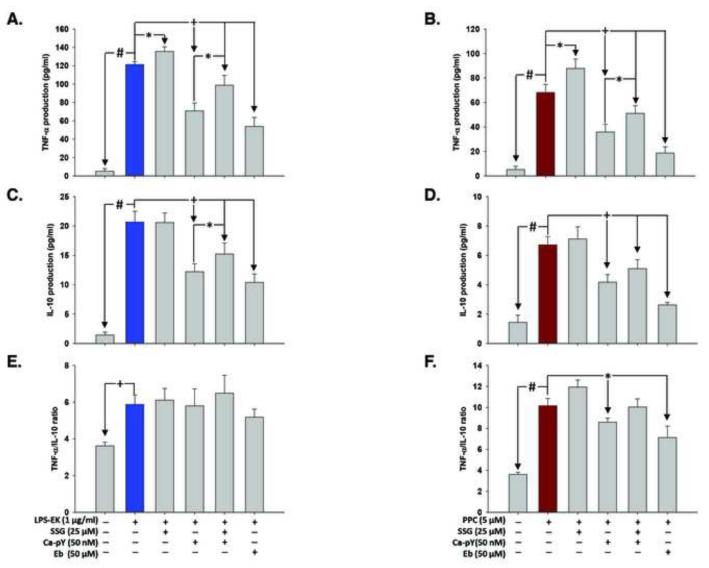
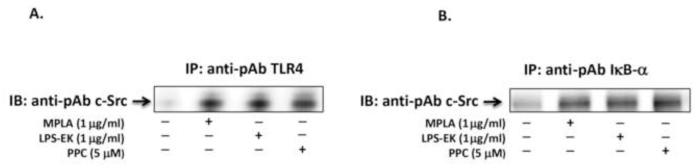
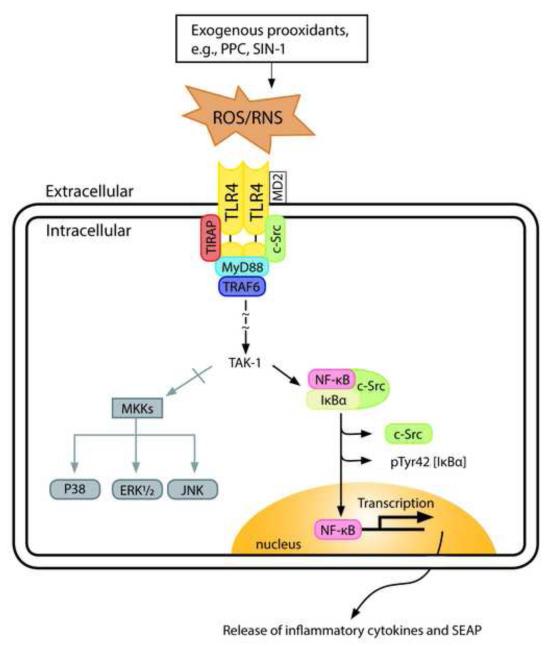
To study the role of c-Src kinase in pro-oxidant-induced stimulation of Toll-like receptor 4 (TLR4), we used lipopolysaccharide from Escherichia coli K12 (LPS-EK) and monophosphoryl lipid A, as TLR4-specific agonists and positive controls, and SIN-1 and potassium peroxychromate as pro-oxidant sources. We used the HEK-Blue mTLR4 cell line, which is stably transfected with mouse TLR4 and expresses optimized SEAP reporter under the control of a promoter inducible by NF-κB transcription factor. The level of SEAP released due to TLR4 stimulation was a measure of NF-κB activation. Treatment with either the pro-oxidants or LPS-EK increased SEAP release and TNF-α production in these cells. These treatments also increased intracellular reactive oxygen species accumulation, with an enhanced production of nitric oxide and TBARS to confirm oxidant stress in these cells. Pretreatment with c-Src kinase inhibitors, PP2 and Ca-pY, which act by different mechanisms, decreased these parameters. Pretreatment with SSG, a c-Src activator, enhanced the effects promoted by LPS-EK and pro-oxidants and rescued cells from the PP2- and Ca-pY-induced effects. Curiously, pro-oxidants, but not TLR4 agonist, increased the ratio of TNF-α to IL-10 released, suggesting that pro-oxidants can initiate and maintain an imbalance of TNF-α production over IL-10. To different degrees, both pro-oxidants and TLR4 agonist increased formation of c-Src complexes with TLR4 and IκB-α as coimmunoprecipitates. Both pro-oxidants and TLR4 agonist increased c-Src phosphorylation of the Tyr42 residue in IκB-α, but the pro-oxidant-induced effect was more robust and much longer lasting. Taken together, these studies provide a mechanism whereby c-Src assumes a central role in pro-oxidant-induced NF-κB activation in TLR4 signaling. Pro-oxidant-induced activation of TLR4 through c-Src/NF-κB/IκB-α coupling provides a basis for a molecular dissection of the initiation and maintenance of sterile inflammation that may serve as a "pathophysiologic primer" for many diseases.
Keywords: Free radicals; IκB-α; NF-κB; Pathophysiologic primer; Pro-oxidant; Sterile inflammation; Toll-like receptor 4; c-Src.
Copyright © 2014 Elsevier Inc. All rights reserved.
Figures


Similar articles
-
Toll-like receptor 4 signaling: A common pathway for interactions between prooxidants and extracellular disulfide high mobility group box 1 (HMGB1) protein-coupled activation.Biochem Pharmacol. 2015 Nov 1;98(1):132-43. doi: 10.1016/j.bcp.2015.08.109. Epub 2015 Sep 12. Biochem Pharmacol. 2015. PMID: 26367307 Free PMC article.
-
Toll-like receptor 4-mediated nuclear factor kappa B activation is essential for sensing exogenous oxidants to propagate and maintain oxidative/nitrosative cellular stress.PLoS One. 2013 Sep 18;8(9):e73840. doi: 10.1371/journal.pone.0073840. eCollection 2013. PLoS One. 2013. PMID: 24058497 Free PMC article.
-
Exogenous oxidants activate nuclear factor kappa B through Toll-like receptor 4 stimulation to maintain inflammatory phenotype in macrophage.Biochem Pharmacol. 2018 Jan;147:104-118. doi: 10.1016/j.bcp.2017.11.012. Epub 2017 Nov 23. Biochem Pharmacol. 2018. PMID: 29175419 Free PMC article.
-
LPS Preconditioning Attenuates Apoptosis Mechanism by Inhibiting NF-κB and Caspase-3 Activity: TLR4 Pre-activation in the Signaling Pathway of LPS-Induced Neuroprotection.Mol Neurobiol. 2021 May;58(5):2407-2422. doi: 10.1007/s12035-020-02227-3. Epub 2021 Jan 9. Mol Neurobiol. 2021. PMID: 33421016 Review.
-
Alternative splicing in the NF-kappaB signaling pathway.Gene. 2008 Nov 1;423(2):97-107. doi: 10.1016/j.gene.2008.07.015. Epub 2008 Jul 22. Gene. 2008. PMID: 18718859 Free PMC article. Review.
Cited by
-
The molecular landscape of histone lysine methyltransferases and demethylases in non-small cell lung cancer.Int J Med Sci. 2019 Jun 2;16(7):922-930. doi: 10.7150/ijms.34322. eCollection 2019. Int J Med Sci. 2019. PMID: 31341405 Free PMC article.
-
Toll-like receptor 4 signaling: A common pathway for interactions between prooxidants and extracellular disulfide high mobility group box 1 (HMGB1) protein-coupled activation.Biochem Pharmacol. 2015 Nov 1;98(1):132-43. doi: 10.1016/j.bcp.2015.08.109. Epub 2015 Sep 12. Biochem Pharmacol. 2015. PMID: 26367307 Free PMC article.
-
Src-homology domain 2 containing protein tyrosine phosphatase-1 (SHP-1) directly binds to proto-oncogene tyrosine-protein kinase Src (c-Src) and promotes the transcriptional activation of connexin 43 (Cx43).Bioengineered. 2022 May;13(5):13534-13543. doi: 10.1080/21655979.2022.2079252. Bioengineered. 2022. PMID: 35659197 Free PMC article.
-
4-Hydroxynonenal activates Src through a non-canonical pathway that involves EGFR/PTP1B.Free Radic Biol Med. 2015 Dec;89:701-7. doi: 10.1016/j.freeradbiomed.2015.08.025. Epub 2015 Oct 8. Free Radic Biol Med. 2015. PMID: 26453921 Free PMC article.
-
The Importance of Tyrosine Phosphorylation Control of Cellular Signaling Pathways in Respiratory Disease: pY and pY Not.Am J Respir Cell Mol Biol. 2018 Nov;59(5):535-547. doi: 10.1165/rcmb.2018-0049TR. Am J Respir Cell Mol Biol. 2018. PMID: 29812954 Free PMC article. Review.
References
-
- Giustarini D, Dalle-Donne I, Tsikas D, Rossi R. Oxidative stress and human diseases: Origin, link, measurement, mechanisms, and biomarkers. Crit Rev Clin Lab Sci. 2009;46(5-6):241–281. Review. - PubMed
-
- Davies KJ. Oxidative stress: the paradox of aerobic life. Biochem Soc Symp. 1995;61:1–31. - PubMed
-
- Jung KJ, Lee EK, Yu BP, Chung HY. Significance of protein tyrosine kinase/protein tyrosine phosphatase balance in the regulation of NF-kappaB signaling in the inflammatory process and aging. Free Radic Biol Med. 2009;47(7):983–991. - PubMed
-
- Brugge JS, Cotton PC, Queral AE, Barrett JN, Nonner D, Keane RW. Neurones express high levels of a structurally modified, activated form of pp60c-Src. Nature. 1985;316:554–557. - PubMed
Publication types
MeSH terms
Substances
Grants and funding
LinkOut - more resources
Full Text Sources
Other Literature Sources
Research Materials
Miscellaneous
