. 2014 Mar 18:5:3492.
doi: 10.1038/ncomms4492.

Blockade of TLR3 protects mice from lethal radiation-induced gastrointestinal syndrome

Affiliations
Free PMC article

Blockade of TLR3 protects mice from lethal radiation-induced gastrointestinal syndrome

Naoki Takemura et al. Nat Commun. .
Free PMC article

Abstract

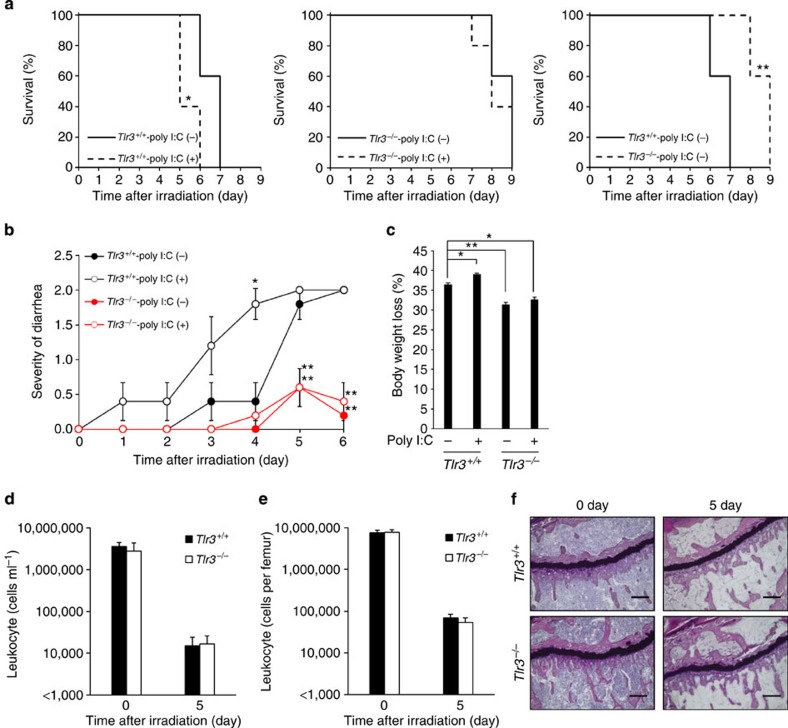
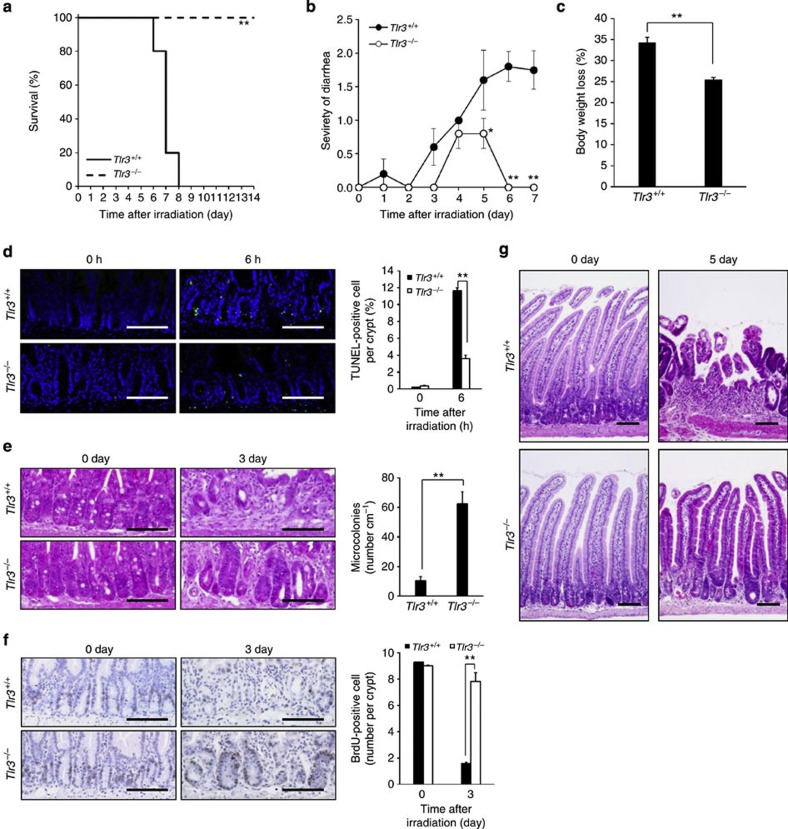
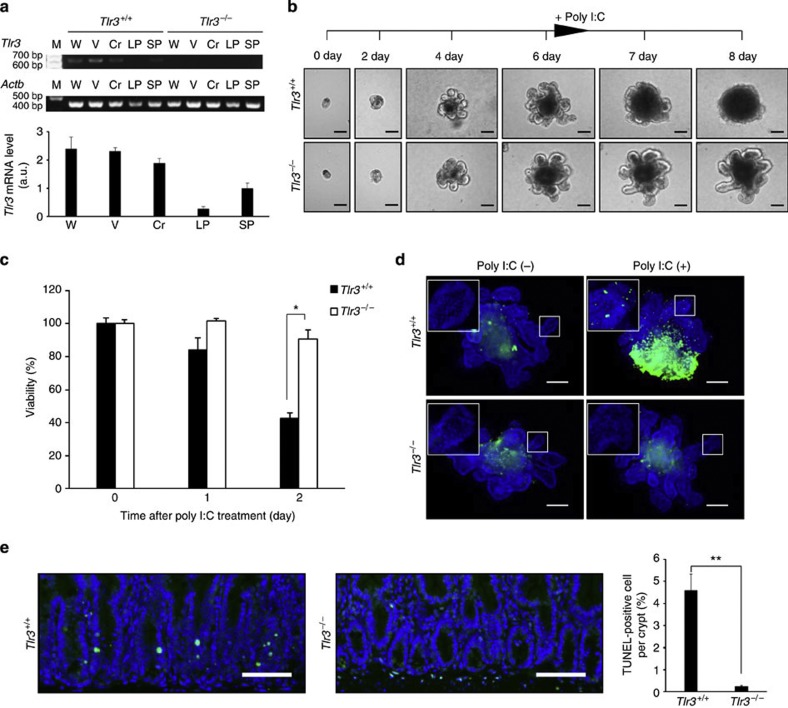
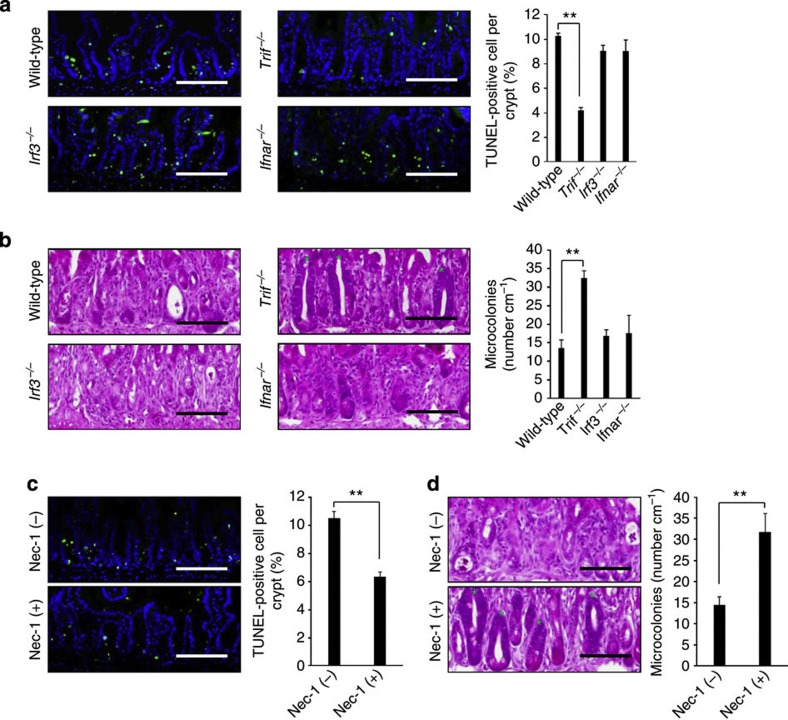
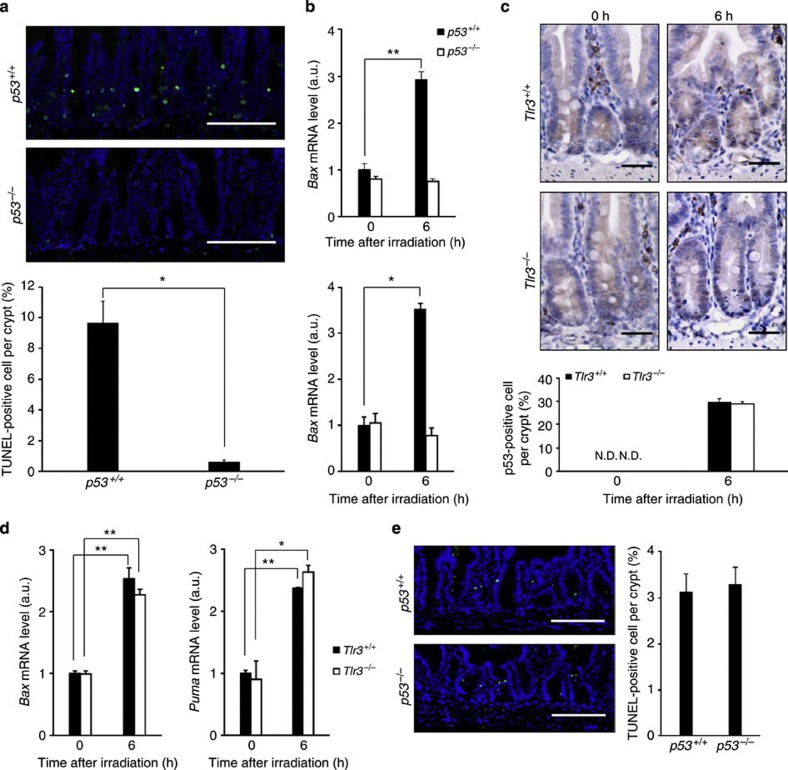
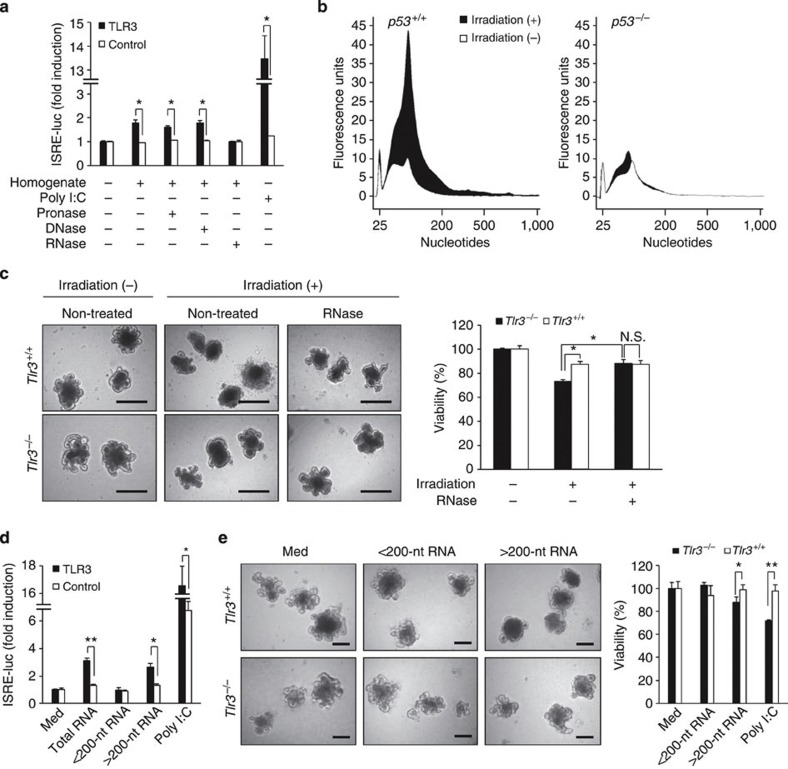
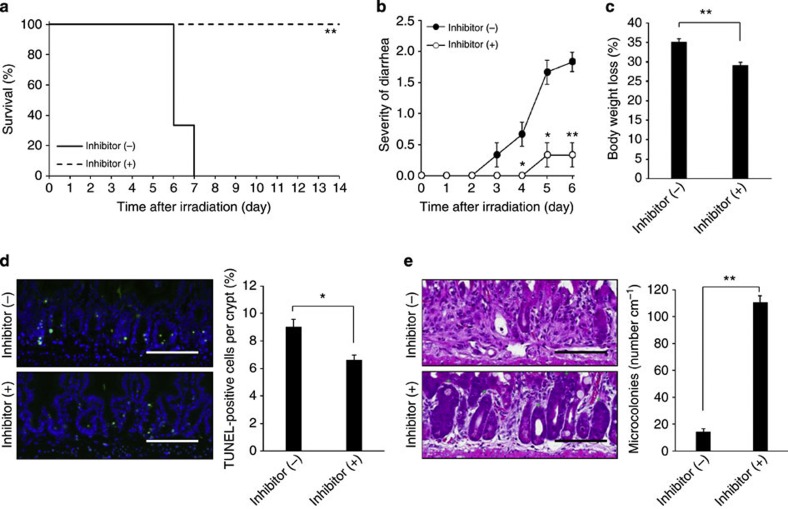
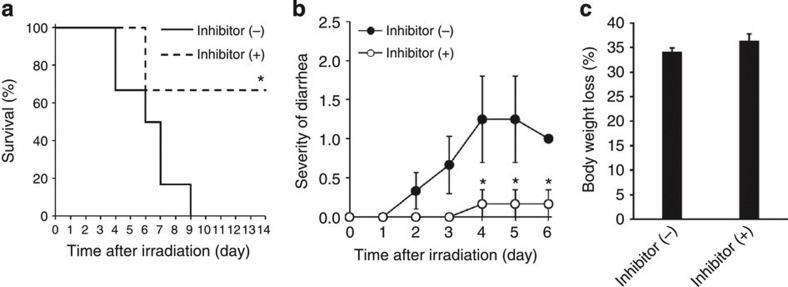
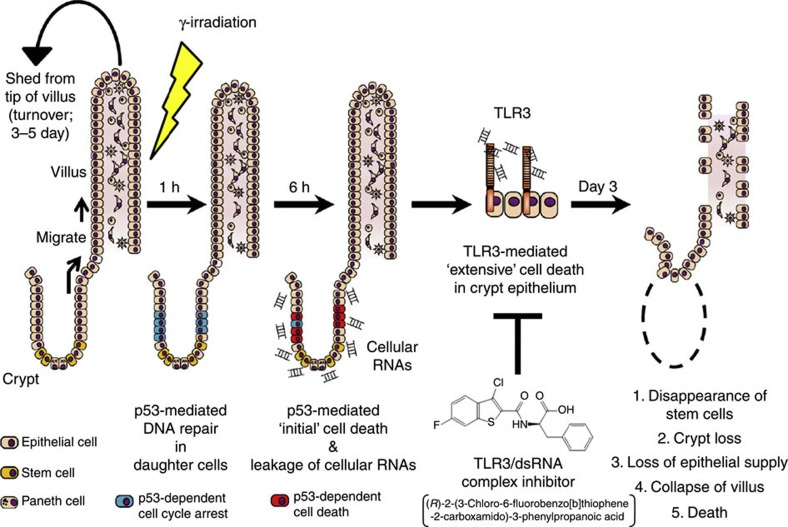
High-dose ionizing radiation induces severe DNA damage in the epithelial stem cells in small intestinal crypts and causes gastrointestinal syndrome (GIS). Although the tumour suppressor p53 is a primary factor inducing death of crypt cells with DNA damage, its essential role in maintaining genome stability means inhibiting p53 to prevent GIS is not a viable strategy. Here we show that the innate immune receptor Toll-like receptor 3 (TLR3) is critical for the pathogenesis of GIS. Tlr3(-/-) mice show substantial resistance to GIS owing to significantly reduced radiation-induced crypt cell death. Despite showing reduced crypt cell death, p53-dependent crypt cell death is not impaired in Tlr3(-/-) mice. p53-dependent crypt cell death causes leakage of cellular RNA, which induces extensive cell death via TLR3. An inhibitor of TLR3-RNA binding ameliorates GIS by reducing crypt cell death. Thus, we propose blocking TLR3 activation as a novel approach to treat GIS.


Figures

Figure 1
Figure 1. Activation of TLR3 exacerbates radiation-induced GIS.
(a) Kaplan–Meier survival analyses of Tlr3+/+ and Tlr3−/− mice after TBI with or without poly I:C pretreatment. n=5; *P<0.05; **P<0.01 (log-rank test). (b) Severity of diarrhea of Tlr3+/+ and Tlr3−/− mice after TBI with or without poly I:C pretreatment. n=5; results are means±s.e.m. *P<0.05; **P<0.01 (unpaired two-tailed Student’s t-test). (c) Body weight loss of Tlr3+/+ and Tlr3−/− mice on day 5 after TBI with or without poly I:C pretreatment. n=5; results are means±s.e.m. *P<0.05; **P<0.01 (unpaired two-tailed Student’s t-test). (d) The numbers of blood leukocytes and (e) BM leukocytes of Tlr3+/+ and Tlr3−/− mice 0 and 5 days after TBI. n=3. results are means±s.e.m. (f) H&E staining of tibiae at days 0 and 5. Scale bar, 200 μm. Results are representative of three independent experiments.
Figure 2
Figure 2. Tlr3−/− mice avoid GIS because of reduction in radiation-induced crypt cell death.
(a) Kaplan–Meier survival analysis of Tlr3+/+ and Tlr3−/− mice treated with TBI and isologous BMT. n=5; **P<0.01 (log-rank test). (b) Severity of diarrhea of Tlr3+/+ and Tlr3−/− mice. n=5; results are means±s.e.m. *P<0.05; **P<0.01 (unpaired two-tailed Student’s t-test). (c) Body weight loss of Tlr3+/+ and Tlr3−/− mice at day 5. n=5; results are means±s.e.m. **P<0.01 (unpaired two-tailed Student’s t-test). (d) TUNEL-staining of the small intestines of Tlr3+/+ and Tlr3−/− mice at 0 and 6 h. TUNEL-stained epithelium shows green fluorescence. Nuclei were stained with DAPI (blue). Scale bar, 100 μm. The right-hand panel shows numbers of TUNEL-positive cells. n=4; results are means±s.e.m. **P<0.01 (unpaired two-tailed Student’s t-test). (e) H&E staining of the small intestinal crypts of Tlr3+/+ and Tlr3−/− mice at days 0 and 3. Scale bar, 100 μm. Asterisks denote microcolonies. Right panel shows the numbers of microcolonies. n=3; results are means±s.e.m. **P<0.01 (unpaired two-tailed Student’s t-test). (f) Immunohistochemical detection of BrdU in small intestinal crypts of Tlr3+/+ and Tlr3−/− mice at days 0 and 3. Scale bar, 100 μm. The right-hand panel shows the numbers of BrdU-incorporating cells. n=3; results are means±s.e.m. **P<0.01 (unpaired two-tailed Student’s t-test). (g) H&E staining of Tlr3+/+and Tlr3−/− small intestines at days 0 and 5. Scale bar, 100 μm. Results are representative of three independent experiments.
Figure 3
Figure 3. Ligand stimulation of TLR3 directly induces cell death in small intestinal crypts.
(a) RT-PCR (top) and quantitative real-time PCR (bottom) of Tlr3 mRNA in the small intestines of Tlr3+/+ and Tlr3−/− mice. Cr, crypt; LP, lamina propria; M, size marker; SP, spleen; V, villi; W, whole intestine. n=3; results are means±s.e.m. (b) Representative images of Tlr3+/+ and Tlr3−/− organoids. Crypts were incubated with poly I:C after day 6 of culture. Scale bar, 100 μm. (c) Viability of Tlr3+/+ and Tlr3−/− organoids after poly I:C treatment. n=4; results are means±s.e.m. *P<0.05 (unpaired two-tailed Student’s t-test). (d) TUNEL-staining of Tlr3+/+ and Tlr3−/− organoids at 1 day after poly I:C treatment. TUNEL-stained epithelium shows green fluorescence. Nuclei were stained with DAPI (blue). Insets show higher magnification of the crypt-like domain. Scale bar, 100 μm. (e) TUNEL-staining of the small intestinal crypts of Tlr3+/+ and Tlr3−/− mice 6 h after poly I:C injection. TUNEL-stained epithelium shows green fluorescence. Nuclei were stained with DAPI (blue). Scale bar, 100 μm. The right-hand panel shows numbers of TUNEL-positive cells. n=3; results are means±s.e.m. **P<0.01 (unpaired two-tailed Student’s t-test). Results are representative of three independent experiments.
Figure 4
Figure 4. TLR3 mediates radiation-induced crypt cell death through the TRIF–RIP1 pathway.
(a) TUNEL-staining of the small intestinal crypts of Trif−/−, Irf3/ and Ifnar/ mice 6 h after TBI and isologous BMT. TUNEL-stained epithelium shows green fluorescence. Nuclei were stained with DAPI (blue). Scale bar, 100 μm. The right-hand panel shows numbers of TUNEL-positive cells. n=3–4; results are means±s.e.m. **P<0.01 (unpaired two-tailed Student’s t-test). (b) H&E staining of the small intestinal crypts of Trif−/−, Irf3/ and Ifnar/ mice at day 3. Scale bar, 100 μm. Asterisks denote microcolonies. The right-hand panel shows the numbers of microcolonies. n=3–5; results are means±s.e.m. **P<0.01 (unpaired two-tailed Student’s t-test). (c) TUNEL-staining of the small intestinal crypts of non-treated and Nec-1-treated mice 6 h after TBI and isologous BMT. TUNEL-stained epithelium shows green fluorescence. Nuclei were stained with DAPI (blue). Scale bar, 100 μm. The right-hand panel shows numbers of TUNEL-positive cells. n=5; results are means±s.e.m. **P<0.01 (unpaired two-tailed Student’s t-test). (d) H&E staining of the small intestinal crypts of non-treated and Nec-1-treated mice at day 3. Scale bar, 100 μm. Asterisks denote microcolonies. Right panel shows the numbers of microcolonies. n=5; results are means±s.e.m. **P<0.01 (unpaired two-tailed Student’s t-test). Results are representative of three independent experiments.
Figure 5
Figure 5. TLR3-mediated crypt cell death after TBI depends on p53.
(a) TUNEL-staining of small intestinal crypts of p53+/+ and p53−/− mice 6 h after TBI and isologous BMT. TUNEL-stained epithelium shows green fluorescence. Nuclei were stained with DAPI (blue). Scale bar: 100 μm. Lower panel shows numbers of TUNEL-positive cells. n=3; results are means±s.e.m. *P<0.05 (unpaired two-tailed Student’s t-test). (b) Quantitative real-time PCR of mRNA encoding Bax and PUMA in the small intestines of p53+/+and p53−/− mice. n=3; results are means±s.e.m. *P<0.05; **P<0.01 (unpaired two-tailed Student’s t-test). (c) Immunohistochemical detection of p53 in the small intestinal crypts of Tlr3+/+ and Tlr3−/− mice 0 and 6 h after TBI and isologous BMT. Scale bar, 100 μm. Lower panel shows numbers of p53-positive cells. n=3; results are means±s.e.m. N.D., not detected. (d) Quantitative real-time PCR of mRNAs encoding Bax and PUMA in the small intestines of Tlr3+/+ and Tlr3−/− mice. n=3; results are means±s.e.m. *P<0.05; **P<0.01 (unpaired two-tailed Student’s t-test). (e) TUNEL-staining of the small intestinal crypts of p53+/+and p53−/− mice 6 h after poly I:C injection. TUNEL-stained epithelium shows green fluorescence. Nuclei were stained with DAPI (blue). Scale bar, 100 μm. The right-hand panel shows numbers of TUNEL-positive cells. n=3; results are means±s.e.m. Results are representative of three independent experiments.
Figure 6
Figure 6. The gut microbiota is not responsible for crypt cell death after TBI.
(a) TUNEL-staining of small intestinal crypts of SPF and GF mice 6 h after TBI and BMT. TUNEL-stained epithelium shows green fluorescence. Nuclei were stained with DAPI (blue). Scale bar, 100 μm. The right-hand panel shows numbers of TUNEL-positive cells. n=3; results are means±s.e.m. (b) H&E staining of crypts of SPF and GF mice on day 3. Scale bar, 100 μm. The right-hand panel shows the numbers of microcolonies. n=3; results are means±s.e.m. Results are representative of two independent experiments.
Figure 7
Figure 7. Cellular RNA leaks from irradiated crypt cells in a p53-dependent manner and induces TLR3-mediated crypt cell death.
(a) HEK293 cells transiently transfected with a human TLR3 expression vector together with ISRE-luciferase reporter plasmid (HEK293-hTLR3) were incubated with homogenate from irradiated small intestine or homogenate treated with pronase, DNase or RNase. Reporter activity was measured in triplicate. Results are means±s.e.m. *P<0.05 (unpaired two-tailed Student’s t-test). (b) Quantification and size distribution of total RNA in the culture supernatants of crypt–villus organoids of p53+/+ and p53/ mice on day 1 after irradiation. (c) Representative images of crypt–villus organoids of Tlr3+/+ and Tlr3−/− mice on day 1 after irradiation. Crypts were treated without or with RNase. Scale bar, 200 μm. The right-hand panel shows the viability. Viability was measured in triplicate. Results are means±s.e.m. N.S., not significant. *P<0.05 (unpaired two-tailed Student’s t-test). (d) HEK293-hTLR3 cells were incubated with medium alone (Med), purified RNA or poly I:C for 12 h. Reporter activity was measured in triplicate. Results are means±s.e.m. *P<0.05; **P<0.01 (unpaired two-tailed Student’s t-test). (e) Representative images of in vitro cultured crypts of Tlr3+/+ and Tlr3−/− mice (left) and the viability (right) on day 2 after treatment with Med or purified RNA. Scale bar, 200 μm. Viability was measured in triplicate. Results are means±s.e.m. *P<0.05; **P<0.01 (unpaired two-tailed Student’s t-test). Results are representative of three independent experiments.
Figure 8
Figure 8. Blockade of TLR3 binding to RNA ameliorates radiation-induced GIS.
(a) Kaplan–Meier survival analyses of mice treated with TLR3/dsRNA complex inhibitor before TBI and isologous BMT. n=6; **P<0.01 (log-rank test). (b,c) Severity of diarrhea (b) and body weight loss (c) of non-treated and TLR3/dsRNA complex inhibitor-pretreated mice. n=6; results are means±s.e.m. *P<0.05; **P<0.01 (unpaired two-tailed Student’s t-test). (d) TUNEL-staining of the small intestinal crypts of non-treated and TLR3/dsRNA complex inhibitor-pretreated mice at 6 h. TUNEL-stained epithelium shows green fluorescence. Nuclei were stained with DAPI (blue). Scale bar, 100 μm. The right-hand panel shows numbers of TUNEL-positive cells. n=5; results are means±s.e.m. *P<0.05 (unpaired two-tailed Student’s t-test). (e) H&E staining of the small intestinal crypts of non-treated and TLR3/dsRNA complex inhibitor-pretreated mice on day 3. Scale bar: 100 μm. Asterisks denote microcolonies. Right panel shows the numbers of microcolonies. n=5; results are means±s.e.m. **P<0.01 (unpaired two-tailed Student’s t-test). Results are representative of three independent experiments.
Figure 9
Figure 9. Post-treatment with TLR3/dsRNA complex inhibitor ameliorates radiation-induced GIS.
(a) Kaplan–Meier survival analyses of mice treated with TLR3/dsRNA complex inhibitor after TBI and isologous BMT. n=6; *P<0.05 (log-rank test). (b,c) Severity of diarrhea (b) and body weight loss (c) of non-treated and TLR3/dsRNA complex inhibitor-post-treated mice. n=4–6; results are means±s.e.m. *P<0.05 (unpaired two-tailed Student’s t-test). Results are representative of two independent experiments.
Figure 10
Figure 10. Whole pathological mechanism of GIS.
When ionizing γ-radiation damages DNA of intestinal crypt cells, p53 induces cell cycle arrest for DNA repair. If the DNA damage is irreparable, p53 initiates cell death. Cellular RNA released from the cells, which underwent p53-mediated cell death after γ-irradiation, induces extensive crypt cell death via TLR3, leading to a deficient supply of intestinal epithelial cells, destruction of villous epithelium and death from GIS.

References

    1. Mettler F. A. Jr. & Voelz G. L. Major radiation exposure—what to expect and how to respond. New Engl. J. Med. 346, 1554–1561 (2002). - PubMed
    1. Waselenko J. K. et al. Medical management of the acute radiation syndrome: recommendations of the Strategic National Stockpile Radiation Working Group. Ann. Intern. Med. 140, 1037–1051 (2004). - PubMed
    1. Berger M. E., Christensen D. M., Lowry P. C., Jones O. W. & Wiley A. L. Medical management of radiation injuries: current approaches. Occup. Med. (Lond) 56, 162–172 (2006). - PubMed
    1. Merritt A. J. et al. The role of p53 in spontaneous and radiation-induced apoptosis in the gastrointestinal tract of normal and p53-deficient mice. Cancer Res. 54, 614–617 (1994). - PubMed
    1. Qiu W. et al. PUMA regulates intestinal progenitor cell radiosensitivity and gastrointestinal syndrome. Cell Stem Cell 2, 576–583 (2008). - PMC - PubMed

MeSH terms