. 2014 Mar 17;9(3):e92197.
doi: 10.1371/journal.pone.0092197. eCollection 2014.

De novo structure prediction of globular proteins aided by sequence variation-derived contacts

Affiliations

De novo structure prediction of globular proteins aided by sequence variation-derived contacts

Tomasz Kosciolek et al. PLoS One. .

Abstract

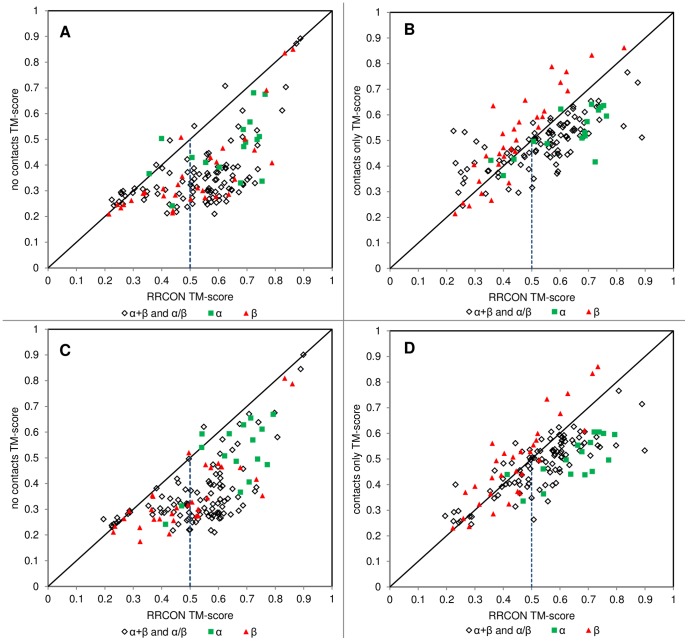
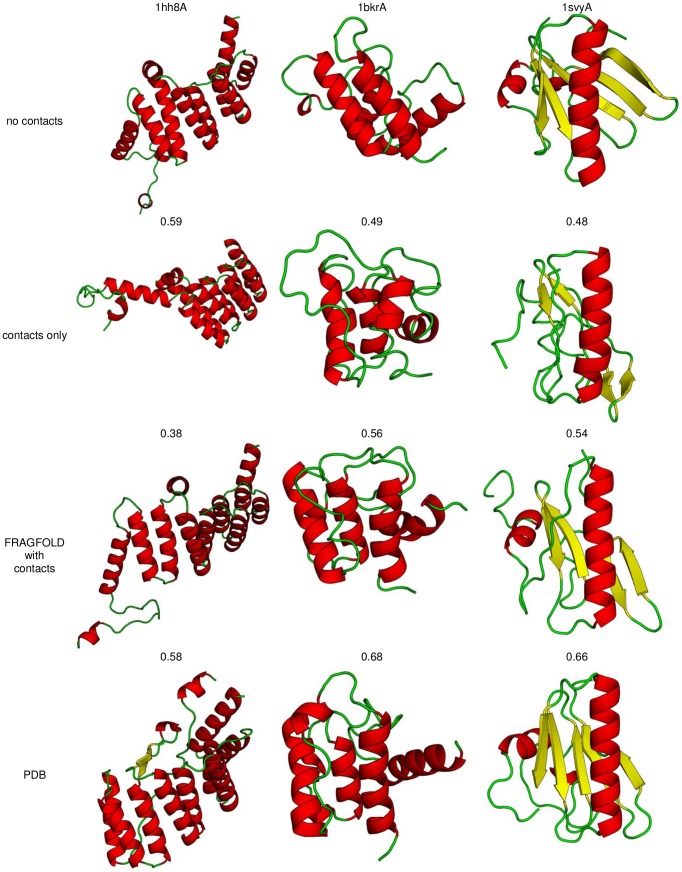
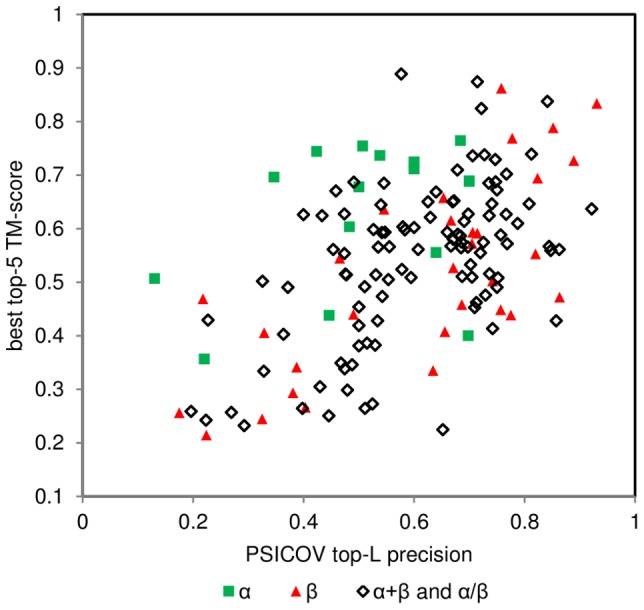
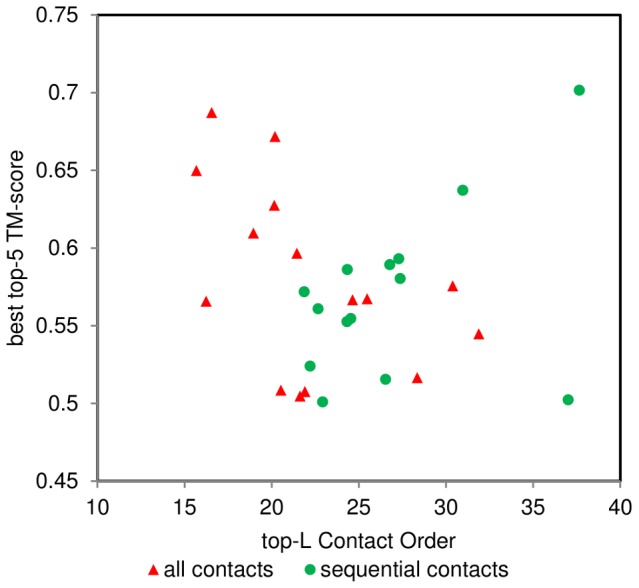
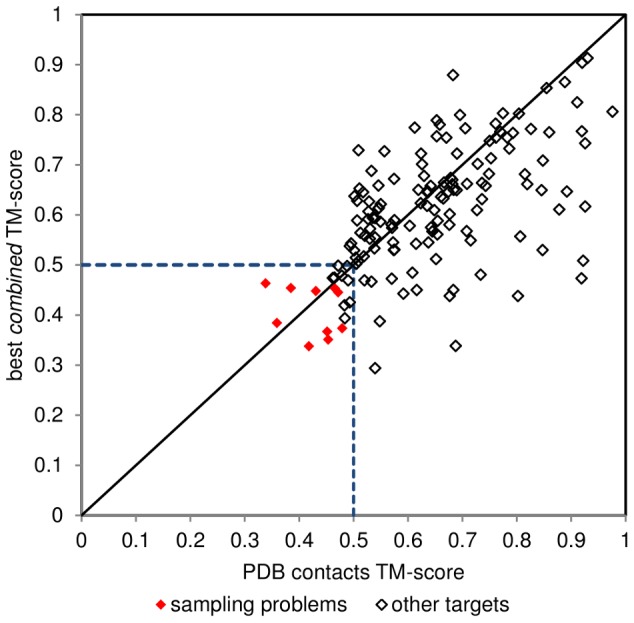
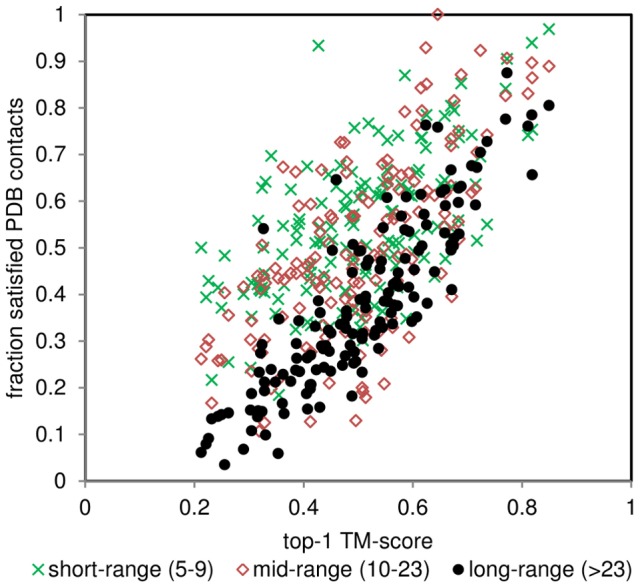
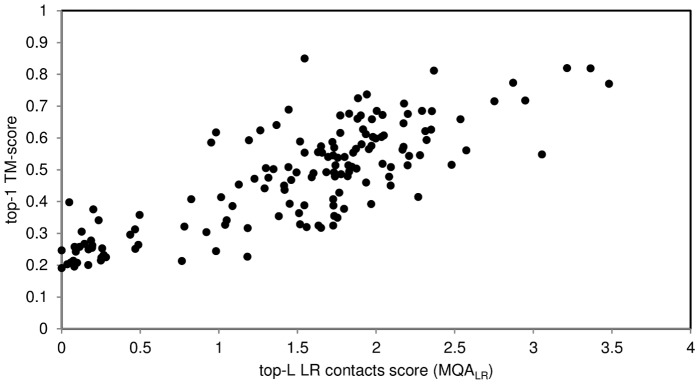
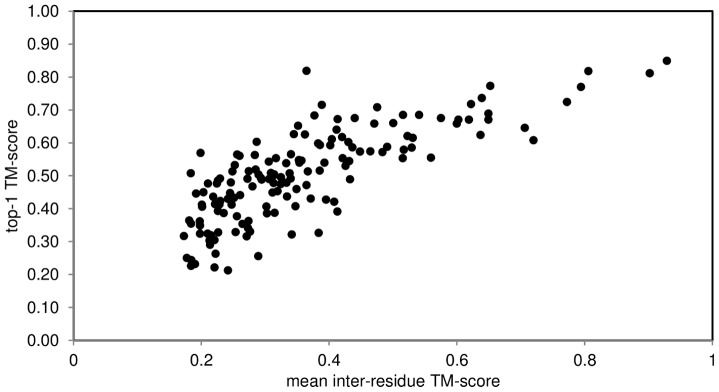
The advent of high accuracy residue-residue intra-protein contact prediction methods enabled a significant boost in the quality of de novo structure predictions. Here, we investigate the potential benefits of combining a well-established fragment-based folding algorithm--FRAGFOLD, with PSICOV, a contact prediction method which uses sparse inverse covariance estimation to identify co-varying sites in multiple sequence alignments. Using a comprehensive set of 150 diverse globular target proteins, up to 266 amino acids in length, we are able to address the effectiveness and some limitations of such approaches to globular proteins in practice. Overall we find that using fragment assembly with both statistical potentials and predicted contacts is significantly better than either statistical potentials or contacts alone. Results show up to nearly 80% of correct predictions (TM-score ≥0.5) within analysed dataset and a mean TM-score of 0.54. Unsuccessful modelling cases emerged either from conformational sampling problems, or insufficient contact prediction accuracy. Nevertheless, a strong dependency of the quality of final models on the fraction of satisfied predicted long-range contacts was observed. This not only highlights the importance of these contacts on determining the protein fold, but also (combined with other ensemble-derived qualities) provides a powerful guide as to the choice of correct models and the global quality of the selected model. A proposed quality assessment scoring function achieves 0.93 precision and 0.77 recall for the discrimination of correct folds on our dataset of decoys. These findings suggest the approach is well-suited for blind predictions on a variety of globular proteins of unknown 3D structure, provided that enough homologous sequences are available to construct a large and accurate multiple sequence alignment for the initial contact prediction step.


Conflict of interest statement

Competing Interests: The authors confirm that David T. Jones, a co-author of this paper, is a member of the PLOS ONE Editorial Board. This does not alter the authors' adherence to PLOS ONE Editorial policies and criteria.

Figures

Figure 1
Figure 1. Folding with and without the use of predicted contacts.
A. TM-scores obtained for best top-5 predictions (on the basis of calculated final energy) without (no contacts) and with residue-residue contact (RRCON) term are compared (combined all and sequential contacts; explained in the text). Three results are significantly better (TM-score difference >0.05) without the use of contacts: 1hh8A, 1m4jA, 1m8aA; upper from the diagonal. B. Shows contact only best top-5 TM-scores in comparison to combined contacts FRAGFOLD results (best top-5 energy). C. Combined RRCON results compared to no contacts results assessed on the basis of best TM score in top-5 largest clusters. D. Combined RRCON TM-score against contacts-only approach TM-score (best top-5 clusters). Diagonal lines indicate identical results. Vertical dashed lines indicate correct prediction boundary (TM-score ≥0.5). The area below the diagonal and right of the dashed line encompasses all correct predictions. Targets are grouped by fold: green squares – α-proteins, red triangles – β-proteins, diamonds – α+β and α/β proteins. Overall, 100 targets out of 150 were correctly predicted.
Figure 2
Figure 2. Sample results of FRAGFOLD without contacts, contacts-only methodology and both statistical and contact potentials.
Below each structure its TM-score is given. 1hh8A is presented in the first column. It is a case where TM-score of no contacts structure is higher than FRAGFOLD with contacts potential (0.59 and 0.58, respectively). Targets 1bkrA (second column) and 1svyA (third) exhibit a progression of TM-score from FRAGFOLD utilizing only statistical potentials (top row), FRAGFOLD contacts-only (second row) folding and folding with both, statistical and contacts-derived potentials (third row). Such progression is expected and observed in most of cases throughout the test set.
Figure 3
Figure 3. By fold comparison of best top-5 TM-score with PSICOV top-L precision.
Red triangles – β proteins, green squares – α proteins, diamonds – α+β proteins and α/β proteins.
Figure 4
Figure 4. Scatter plot of top-L true against top-L false satisfied predicted contacts.
Equal numbers of contacts in each group (true or false) per protein are compared against each other. The diagonal line indicates equal contribution boundary. Orange and blue triangles represent incorrectly predicted targets (TM-score ≤0.3 and 0.3TM-score≥0.5 and TM-score≥0.7, respectively).
Figure 5
Figure 5. Top-L contact order compared against TM-score for all contacts and sequential contacts targets.
Contact order calculated across the whole chain length and reflects the relative contribution of long-range contacts (predicted) in the whole structure. Cases where all contacts produce correct topology but not sequentially introduced (all contacts; blue diamonds), and where only sequentially introduced contacts produce correct topology (sequential contacts; red squares) are compared. It may be observed that the former case exhibits better results for low (<25 top-L CO) contact orders, while the latter for higher contacts orders (approx. 25 top-L CO and more).
Figure 6
Figure 6. TM-scores of best results obtained using predicted contacts compared with folding results aided by contacts extracted from PDB structures.
Red diamonds indicate identified sampling problems. Contacts extracted from experimentally solved structures (PDB contacts) clearly improve the predictions (points below the diagonal).
Figure 7
Figure 7. Post analysis of contact satisfaction.
Contacts divided into 3 groups (short, mid and long range contacts) show dependency of the final (top-1; lowest energy in an ensemble) model on the fraction of satisfied real contacts (extracted from reference PDB files).
Figure 8
Figure 8. TM-score of the final (lowest energy) model against top-L long-range contact score.
The score is derived basing on the length of a protein, total number of predicted contacts and the fraction of satisfied predicted long-range (>23 residues) contacts. The Spearman correlation coefficient (ρ) is 0.77.
Figure 9
Figure 9. TM-score of the final (lowest energy) model against mean pair-wise TM-score within the model's ensemble.
Good correlation (Spearman's ρ = 0.73) emerges from the results. Inter-residue TM-score >0.26 is likely to produce a model with TM-score >0.5.
Figure 10
Figure 10. Accuracy of predictions basing on the total inter-residue TM-score and long-range contact score.
ROC curves are plotted at different TM-score cut-offs. TPR – true positive rate, FPR – false positive rate. Diagonal dashed line indicates random prediction boundary.
Figure 11
Figure 11. Growth of Pfam holdings from version 20.
A. plot of the increase of median family size and B. percentage of Pfam with families of size above sequence length thresholds: 250, 500, 1000 and 2000 residues. In all cases an exponential growth may be observed. Currently (version 26) median family size is 248 and 34% of families hold more than 500 sequences.
Figure 12
Figure 12. Number of sequences in Pfam version 26 in comparison to the growth since version 25.
Upper line (red) indicates emerging new families not present in version 25, lower points (black) indicate a stable growth of the families in size. Not all data is shown. A. Region of up to 500 sequences, below the capabilities of most contact prediction methods. B. Region up to 40,000 sequences. Some families decrease their size (negative value on the ordinate axis), what might be attributed to redefinition of some families. Number of sequences range up to over 288,000 sequences (COX1 cytochrome c oxidase family), but with low density.

References

    1. Neher E (1994) How frequent are correlated changes in families of protein sequences? Proceedings of the National Academy of Sciences of the United States of America 91: 98–102. - PMC - PubMed
    1. Göbel U, Sander C, Schneider R, Valencia A (1994) Correlated mutations and residue contacts in proteins. Proteins 18: 309–317. - PubMed
    1. Pollock DD, Taylor WR (1997) Effectiveness of correlation analysis in identifying protein residues undergoing correlated evolution. Protein Eng 10: 647–657. - PubMed
    1. Gromiha MM, Selvaraj S (2004) Inter-residue interactions in protein folding and stability. Prog Biophys Mol Biol 86: 235–277. - PubMed
    1. Miller CS, Eisenberg D (2008) Using inferred residue contacts to distinguish between correct and incorrect protein models. Bioinformatics 24: 1575–1582. - PMC - PubMed

Publication types