. 2014 Mar 17;9(3):e92054.
doi: 10.1371/journal.pone.0092054. eCollection 2014.

Reduced B lymphoid kinase (Blk) expression enhances proinflammatory cytokine production and induces nephrosis in C57BL/6-lpr/lpr mice

Affiliations

Reduced B lymphoid kinase (Blk) expression enhances proinflammatory cytokine production and induces nephrosis in C57BL/6-lpr/lpr mice

Elizabeth M Samuelson et al. PLoS One. .

Abstract

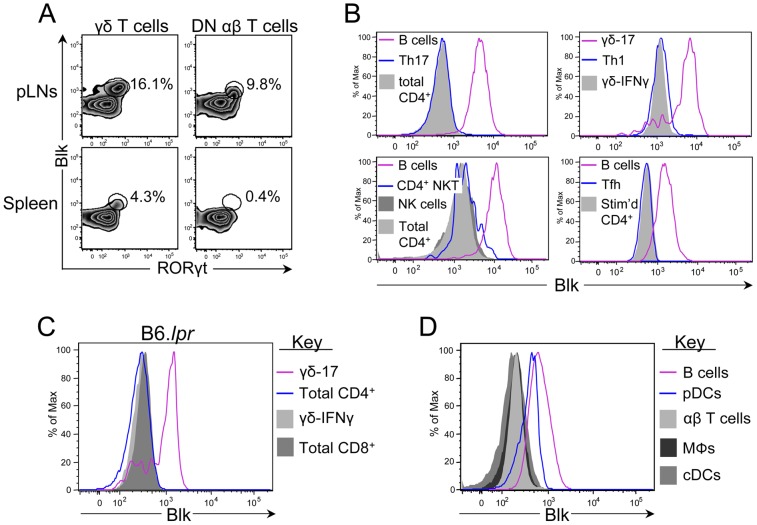
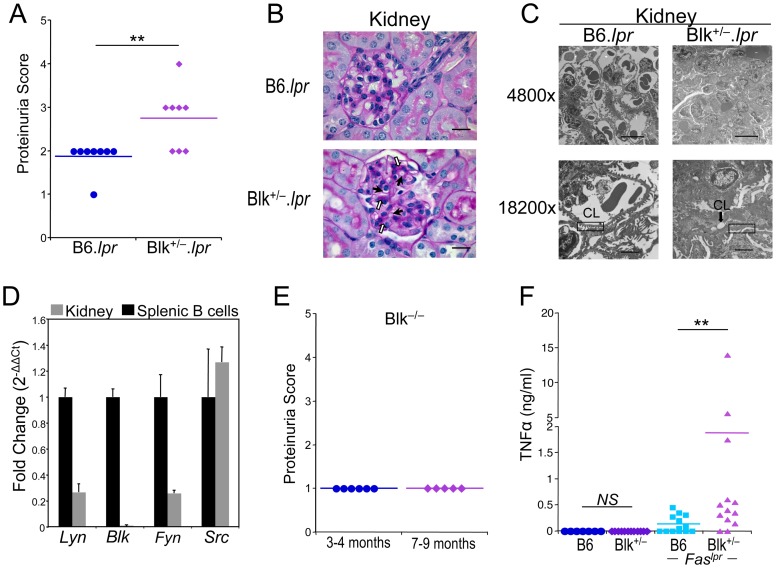
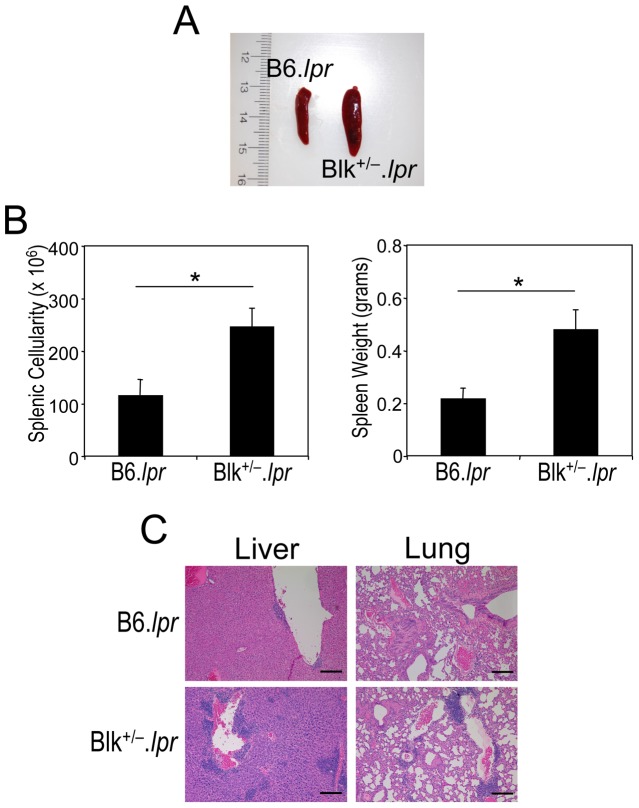
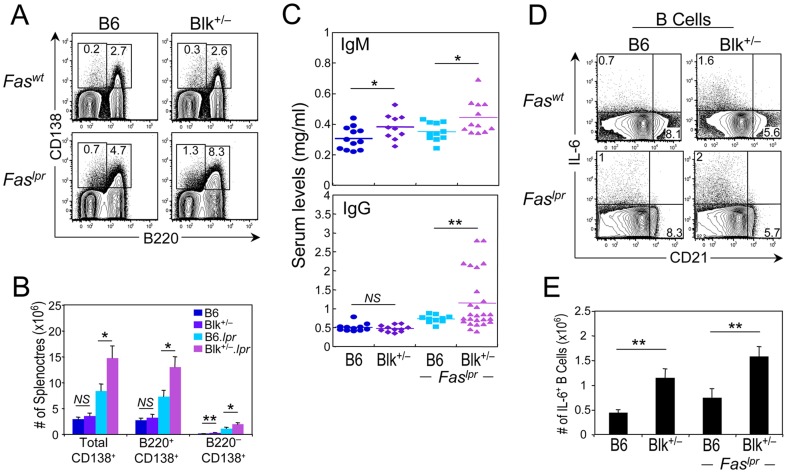
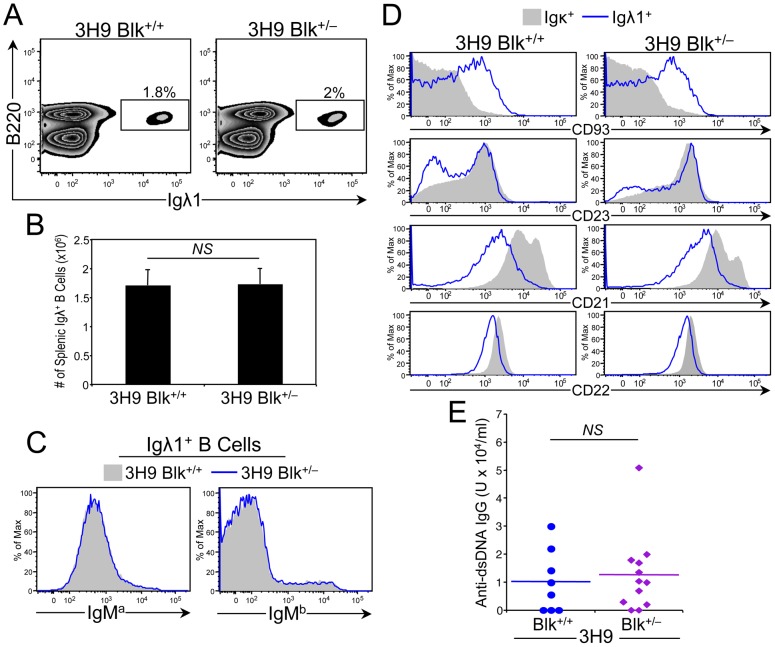
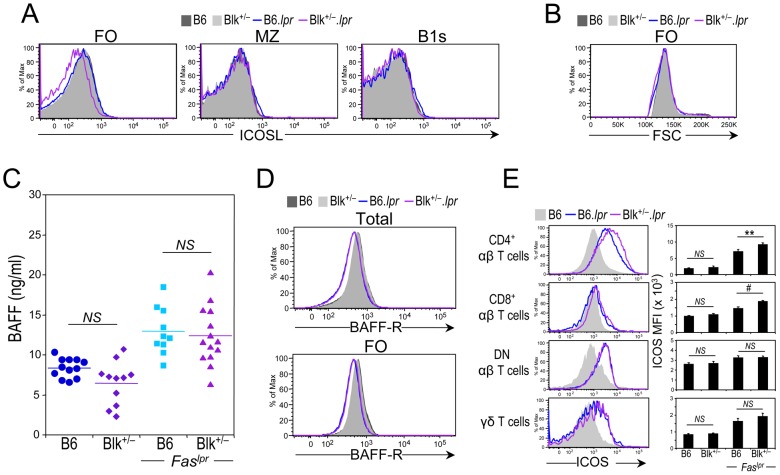
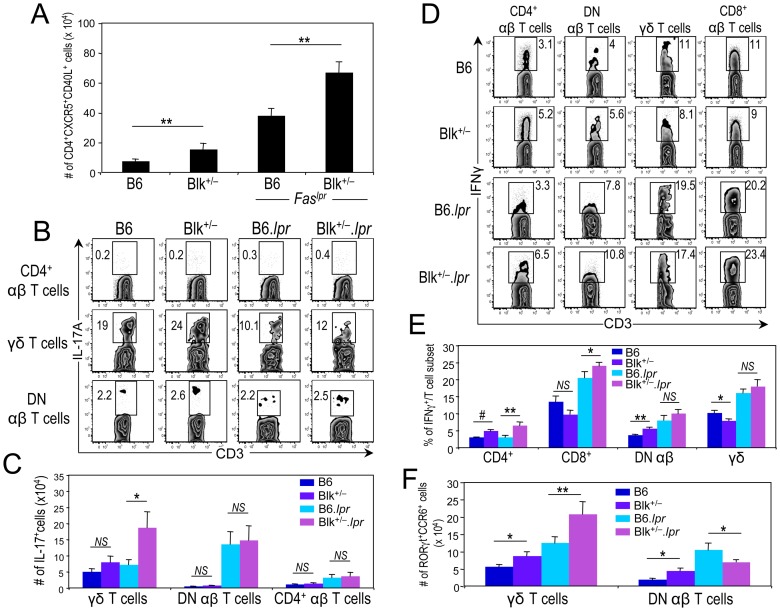
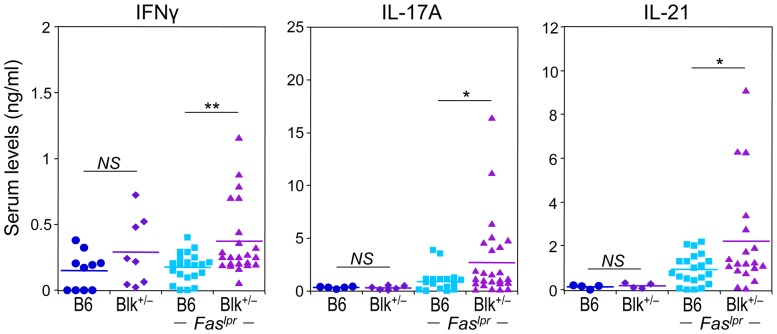
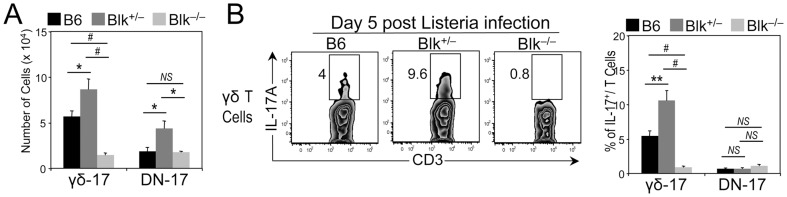
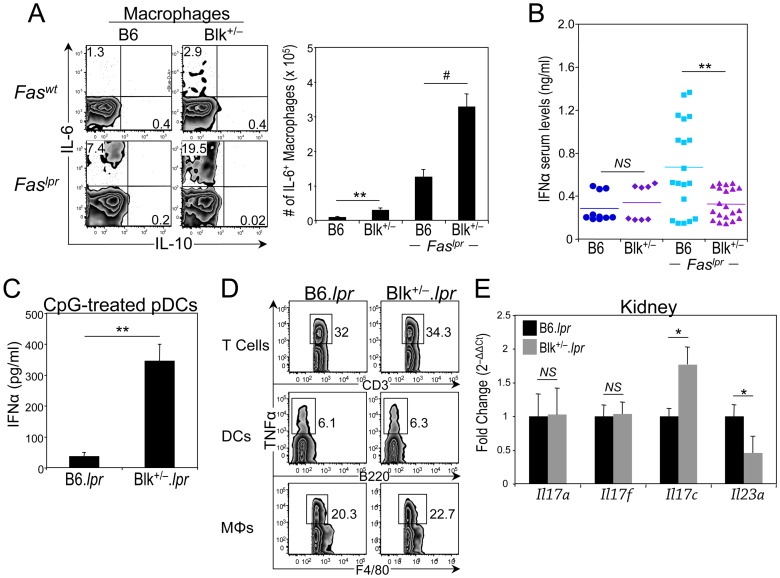
BLK, which encodes B lymphoid kinase, was recently identified in genome wide association studies as a susceptibility gene for systemic lupus erythematosus (SLE), and risk alleles mapping to the BLK locus result in reduced gene expression. To determine whether BLK is indeed a bona fide susceptibility gene, we developed an experimental mouse model, namely the Blk+/-.lpr/lpr (Blk+/-.lpr) mouse, in which Blk expression levels are reduced to levels comparable to those in individuals carrying a risk allele. Here, we report that Blk is expressed not only in B cells, but also in IL-17-producing γδ and DN αβ T cells and in plasmacytoid dendritic cells (pDCs). Moreover, we found that solely reducing Blk expression in C57BL/6-lpr/lpr mice enhanced proinflammatory cytokine production and accelerated the onset of lymphoproliferation, proteinuria, and kidney disease. Together, these findings suggest that BLK risk alleles confer susceptibility to SLE through the dysregulation of a proinflammatory cytokine network.


Conflict of interest statement

Competing Interests: The authors have declared that no competing interests exist.

Figures

Figure 1
Figure 1. Comparison of Blk expression levels in multiple immune cell subsets.
(A) Dot plots showing RORγt versus Blk expression in gated γδ T cells (left) and DN αβ T cells (right) from the pLNs (top) and spleen (bottom) of B6 mice. (B) Histograms showing Blk expression levels in various effector cell subsets. Tfh and Th17 cells were obtained by culturing TCR-stimulated naïve CD4+ T cells under the respective polarizing conditions. The other effector subsets were identified by surface phenotype on ex vivo splenocytes or pLN cells from B6 mice. Specifically, they were NK cells (NK1.1+ CD3 CD19), CD4+ NKT cells (CD4+ NK1.1+ TCRβ+ CD3+), and Th1 cells (CD4+ T-bet+). B cells (CD19+) and γδ-17 cells (CD27 CCR6+) are shown as positive controls. CD4+ TCRβ+ CD3+ cells, both ex vivo and in vitro TCR-stimulated, and γδ-IFNγ cells (CD27+ CCR6) are shown as negative controls, as previously described . (C) Histograms showing Blk expression levels in CD4+ TCRβ+ CD3+ and CD8+ TCRβ+ CD3+ pLN cells from B6.lpr mice displaying lymphadenopathy. γδ-17 and γδ-IFNγ cells from B6.lpr mice are shown as positive and negative controls, respectively. (D) Histograms showing Blk expression in B cells (CD19+; positive staining control), pDCs (CD19 CD317+ CD11c+), αβ T cells (CD3+; negative staining control), macrophages (MΦs; CD19 CD11b+), and cDCs (CD19 CD317 CD11c+) from the spleens of B6 mice. For all experiments, 4 to 8 mice per genotype were used.
Figure 2
Figure 2. 5-month-old Blk+/−.lpr mice exhibit proteinuria and nephrosis.
(A) Comparison of proteinuria scores between 5-month-old B6.lpr and Blk+/−.lpr mice. 0  =  0 mg/dl; 1  =  trace; 2  =  30 mg/dl; 3  =  100 mg/dl; 4  =  300 mg/dl; 5  =  >300 mg/dl. Each symbol represents an individual mouse. (B) Representative light micrographs of PAS stained kidney sections from 5-month-old B6.lpr (n = 7) and Blk+/−.lpr (n = 8) mice at 1000× magnification. Filled arrows highlight examples of narrowed capillary lumens, while open arrows highlight examples of PAS-positive hyaline deposits. Bar  =  20 μm. (C) Electron micrographs of glomeruli from 5-month-old B6.lpr and Blk+/−.lpr mice. Line in bottom of micrographs represents 10 μm in the 4800× magnification and 2 μm in the 18200× magnification. CL, capillary lumen. Rectangular boxes highlight normal (left panel) and shortened/fused (right panel) podocyte foot processes. (D) Quantitative real-time RT-PCR analysis showing expression of Src, Fyn, Lyn but not Blk in B6 kidney. Data were normalized to Gapdh levels and are presented as fold change over purified splenic B cells (set to 1). Data represent 4 kidney samples and 4 B cell samples. (E) Proteinuria scores for 3- to 4-month-old and 7- to 9-month old Blk−/− mice. Each symbol represents an individual mouse. (F) Comparison of serum TNFα levels between 5-month-old B6.lpr and Blk+/−.lpr mice. Each symbol represents an individual mouse. 5/13 (38.5%) of B6.lpr mice and 11/13 (84.6%) of Blk+/−.lpr mice have serum TNFα concentrations greater than 0.1 ng/ml. **p ≤ 0.01.
Figure 3
Figure 3. 5-month-old Blk+/−.lpr mice exhibit multiple autoimmune phenotypes.
(A) 5-month-old Blk+/−.lpr mice exhibit splenomegaly. (B) Comparison of splenic cellularity and weight between 5 month-old B6.lpr (n = 7) and Blk+/−.lpr (n = 8) mice. (C) Multifocal lymphocyte infiltrates are observed in the liver and lungs of 5-month-old Blk+/−.lpr mice but not age-matched B6.lpr mice. 100× magnification is shown. Bar  =  200 μm. *p ≤ 0.05.
Figure 4
Figure 4. Reducing Blk expression in B6.lpr mice results in B cell hyperactivity.
(A) Representative dot plots showing B220 versus CD138 expression on splenocytes from 3-month-old B6, Blk+/−, B6.lpr and Blk+/−.lpr mice. Percentages of cells that are short-lived (B220+ CD138+) and long-lived (B220 CD138+) plasma cells are shown for each genotype. (B) Graph comparing number of total plasma cells, short-lived plasma cells, and long-lived plasma cells in B6 (n = 10), Blk+/− (n = 10), B6.lpr (n  = 22) and Blk+/−.lpr (n  = 22) mice. (C) Comparison of the total serum levels of IgM (top) and IgG (bottom) in 3-month-old B6, Blk+/−, B6.lpr and Blk+/−.lpr mice. Each symbol represents an individual mouse. (D) Splenocytes from 3-month-old B6, Blk+/−, B6.lpr and Blk+/−.lpr mice were stimulated with Leukocyte Activation Cocktail for 4 hours. Dot plots showing CD21 versus IL-6 expression in gated CD19+ cells. Percentages of IL-6+ splenic B cells are shown. (E) Graph comparing numbers of IL-6+ splenic B cells in B6 (n = 4), Blk+/− (n = 4), B6.lpr (n = 7) and Blk+/−.lpr (n = 8) mice. *p ≤ 0.05; **p ≤ 0.01.
Figure 5
Figure 5. Effect of reducing Blk expression on B cell tolerance induction in 3H9 Tg mice.
(A) Representative dot plots showing Igλ1 versus B220 expression on total splenocytes from 6-month-old 3H9 Tg Blk+/+ and 3H9 Tg Blk+/− mice. Numbers in plots represent percentage of anti-DNA B cells (B220+ Igλ1+). (B) Graph comparing absolute numbers of anti-DNA B cells in the spleens of 6-month-old 3H9 Tg Blk+/+ (n = 7) and 3H9 Tg Blk+/− (n = 8) mice. (C) Histograms comparing IgMa (allotype of 3H9 IgH transgene) and IgMb (allotype of endogenous IgH) surface levels on gated Igλ1+ B cells from 6-month-old 3H9 Tg Blk+/+ (n = 7) and 3H9 Tg Blk+/− (n = 8) mice. (D) Histograms comparing CD93, CD23, CD21 and CD22 levels on gated Igκ+ (contains B cells that do not bind DNA) and Igλ1+ B cells from 6-month-old 3H9 Tg Blk+/+ (n = 7) and 3H9 Tg Blk+/− (n = 8) mice. (E) Comparison of anti-dsDNA IgG antibodies in 6-month-old 3H9 Tg Blk+/+ and 3H9 Tg Blk+/− mice. Each symbol represents an individual mouse.
Figure 6
Figure 6. Evidence for augmented ICOS-ICOSL interactions in Blk+/−.lpr mice.
(A) Representative histograms showing ICOSL levels on follicular (FO), marginal zone (MZ) and splenic B1 (B1s) B cells from 3-month-old B6 (n = 6), Blk+/− (n = 6), B6.lpr (n = 7) and Blk+/−.lpr (n = 8) mice. (B) Histogram comparing B cell size, using FSC units, among 3-month-old B6 (n = 6), Blk+/− (n = 6), B6.lpr (n = 7) and Blk+/−.lpr (n = 8) mice. (C) Comparison of the BAFF serum levels in 3-month-old B6, Blk+/−, B6.lpr and Blk+/−.lpr mice. Each symbol represents an individual mouse. (D) Representative histograms comparing BAFF-R levels on total (CD19+) (top) and FO B cells (bottom) from 3-month-old B6 (n = 8), Blk+/− (n = 10), B6.lpr (n = 13) and Blk+/−.lpr (n = 12) mice. (E) Representative histograms showing the expression of ICOS on CD4+, CD8+, DN αβ, and γδ T cells subsets from the spleens of 3-month-old B6.lpr and Blk+/−.lpr mice. ICOS levels on the corresponding T cell subsets from age-matched B6 mice are also shown (shaded histogram). Adjacent graph compares ICOS levels (MFI) on each T cell subset between 3-month-old B6 (n = 6) and Blk+/− (n = 6) mice and between 3-month-old B6.lpr (n = 7) and Blk+/−.lpr (n = 8) mice.
Figure 7
Figure 7. Reducing Blk expression in B6.lpr mice increases numbers of IFNγ-, IL-17A-, and IL-21-producing T cells.
(A) Graph comparing the number of splenic Tfh cells, defined as CD4+ CXCR5+ CD40L+ cells, between 3-month-old B6 (n = 6) and Blk+/− (n = 6) mice and between 3-month-old B6.lpr (n = 7) and Blk+/−.lpr (n = 8) mice. (B) pLN cells from 3-month-old B6, Blk+/−, B6.lpr and Blk+/−.lpr were stimulated with Leukocyte Activation Cocktail for 4 hours. Representative dot plots showing CD3 versus IL-17A expression in CD4+ αβ T cells (top), γδ T cells (middle) and in DN αβ T cells (bottom) from B6, Blk+/−, B6.lpr and Blk+/−.lpr mice. Numbers represent percentages of IL-17A+ cells. (C) Graph summarizing data in (B). Comparison of the number of IL-17A+ cells per T cell subset between 3-month-old B6 (n≥4) and Blk+/− (n≥5) mice and between 3-month-old B6.lpr (n≥7) and Blk+/−.lpr (n≥8) mice. (D) Splenocytes from 3-month-old B6, Blk+/−, B6.lpr and Blk+/−.lpr mice were stimulated with Leukocyte Activation Cocktail for 4 hours. Representative dot plots show CD3 versus IFNγ expression in gated CD4+, CD8+, DN αβ and γδ T cell subsets. Numbers represent percentages of IFNγ+ cells. (E) Graph summarizing data in (D). Comparison of the percentage of IFNγ+ cells per T cell subset between 3-month-old B6 (n = 4) and Blk+/− (n = 4) mice and between 3-month-old B6.lpr (n = 5) and Blk+/−.lpr (n = 5) mice. (F) Graph comparing the numbers of RORγt+ CCR6+ γδ T cells (γδ-17 cells) and DN αβ T cells (DN-17 cells) between the pLNs of 3-month-old B6 (n = 8) and Blk+/− (n = 7) mice and between the pLNs of 3-month-old B6.lpr (n = 8) and Blk+/−.lpr (n = 12) mice. *p ≤ 0.05; **p ≤ 0.01; #p ≤ 0.001.
Figure 8
Figure 8. Reducing Blk expression in B6.lpr mice increases serum levels of IFNγ, IL-17A, and IL-21.
Comparison of serum IFNγ, IL-17A, and IL-21 levels between 3-month-old B6 and Blk+/− mice and between 3-month-old B6.lpr and Blk+/−.lpr mice. Each symbol represents an individual mouse. *p ≤ 0.05; **p ≤ 0.01.
Figure 9
Figure 9. Different effects of Blk-haploinsufficiency and Blk-deficiency on in vivo γδ-17 effector function.
(A) Graph comparing numbers of γδ-17 and DN-17 cells from B6 (n = 8), Blk+/− (n = 7), and Blk−/− (n = 6) mice. (B) B6, Blk+/− and Blk−/− mice were infected with Listeria monocytogenes. 5 days later, splenocytes were harvested and γδ-17 and DN-17 cells were in vitro stimulated for 4 hours with a cocktail of IL-23, IL-1, and Pam3Cys in the presence of brefeldin A. Dot plots showing CD3 versus IL-17A expression in gated γδ T cells from each of the three genotypes. Adjacent graph compares percentage of IL-17A+ per T cell subset in B6 (n = 10), Blk+/− (n = 6), and Blk−/− (n = 6) mice. *p ≤ 0.05; **p ≤ 0.01; #p ≤ 0.001.
Figure 10
Figure 10. Reducing Blk expression in B6.lpr mice affects proinflammatory cytokine production by macrophages, dendritic cells and kidney.
(A) Splenocytes from 3-month-old B6, Blk+/−, B6.lpr and Blk+/−.lpr mice were stimulated with Leukocyte Activation Cocktail for 4 hours. Dot plots showing IL-10 versus IL-6 expression in gated macrophages (F4/80+ CD3 CD19). Numbers represent percentage of IL-6+ and IL-10+ cells. Adjacent graph compares the number of IL-6+ macrophages between 3-month-old B6 (n = 4) and Blk+/− (n = 4) mice and between 3-month-old B6.lpr (n = 7) and Blk+/−.lpr (n = 8) mice. (B) Comparison of serum IFNα levels between 3-month-old B6 and Blk+/− mice and between 3-month-old B6.lpr and Blk+/−.lpr mice. Each symbol represents an individual mouse. (C) Purified pDCs from 2-month-old B6.lpr (n = 3) and Blk+/−.lpr (n = 3) mice were stimulated with CpG ODN 2395 for 24 hours and supernatants were collected and assayed for IFNα by ELISA. (D) Splenocytes from 3-month-old B6.lpr (n = 4) and Blk+/−.lpr mice (n = 4) were stimulated with Leukocyte Activation Cocktail for 4 hours. Dot plots showing CD3 versus TNFα expression in gated CD3+ T cells (top), B220 versus TNFα expression in gated DCs (center), and F4/80 versus TNFα expression in gated macrophages (MΦs) (bottom). Numbers represent percentages of TNFα+ cells. Very few (≤0.5%) B cells were TNFα+. (E) Expression data for Il17a, Il17f, Il17c and Il23a from RT2 profiler array. Data were normalized to Gapdh levels and are presented as fold change over 3-month-old B6.lpr kidney (set to 1). Data represent 4 to 5 mice per genotype. *p ≤ 0.05; **p ≤ 0.01; #p ≤ 0.001.

References

    1. Fairhurst AM, Wandstrat AE, Wakeland EK (2006) Systemic lupus erythematosus: multiple immunological phenotypes in a complex genetic disease. Adv Immunol 92: 1–69. - PubMed
    1. Krishnan S, Chowdhury B, Tsokos GC (2006) Autoimmunity in systemic lupus erythematosus: Integrating genes and biology. Sem Immunol 18: 230–243. - PubMed
    1. Morel L (2010) Genetics of SLE: evidence from mouse models. Nat Rev Rheumatol 6: 348–357. - PubMed
    1. Harley JB, Alarcón-Riquelme ME, Criswell LA, Jacob CO, Kimberly RP, et al. (2008) Genome-wide association scan in women with systemic lupus erythematosus identifies susceptibility variants in ITGAM, PXK, KIAA1542 and other loci. Nat Genet 40: 204–210. - PMC - PubMed
    1. Hom G, Graham RR, Modrek B, Taylor KE, Ortmann W, et al. (2008) Association of systemic lupus erythematosus with C8orf13-BLK and ITGAM-ITGAX . N Engl J Med 358: 900–909. - PubMed

Publication types

MeSH terms

Substances

LinkOut - more resources