. 2015 Apr;44(2):394-404.
doi: 10.1093/ije/dyu049. Epub 2014 Mar 16.

Cohort Profile: The Malawi Longitudinal Study of Families and Health (MLSFH)

Affiliations

Cohort Profile: The Malawi Longitudinal Study of Families and Health (MLSFH)

Hans-Peter Kohler et al. Int J Epidemiol. 2015 Apr.

Abstract

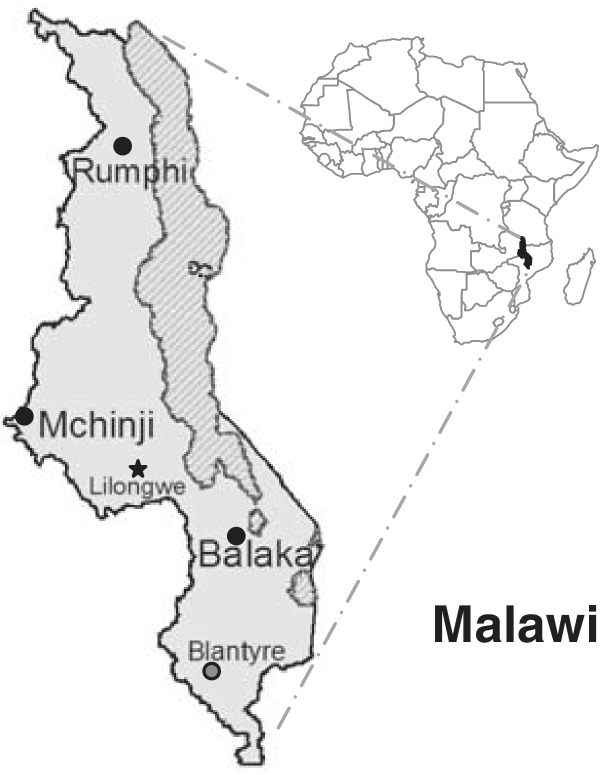
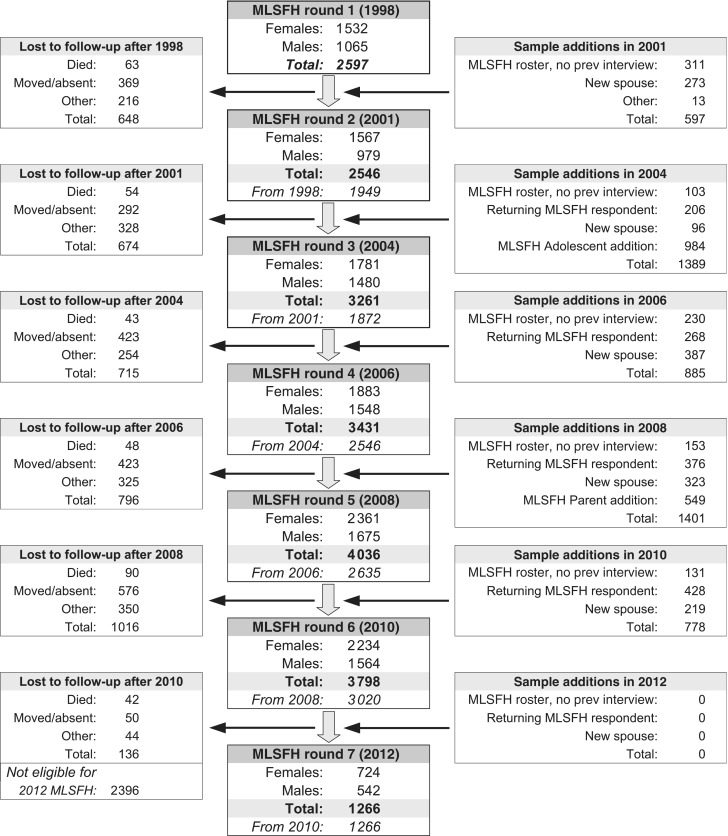
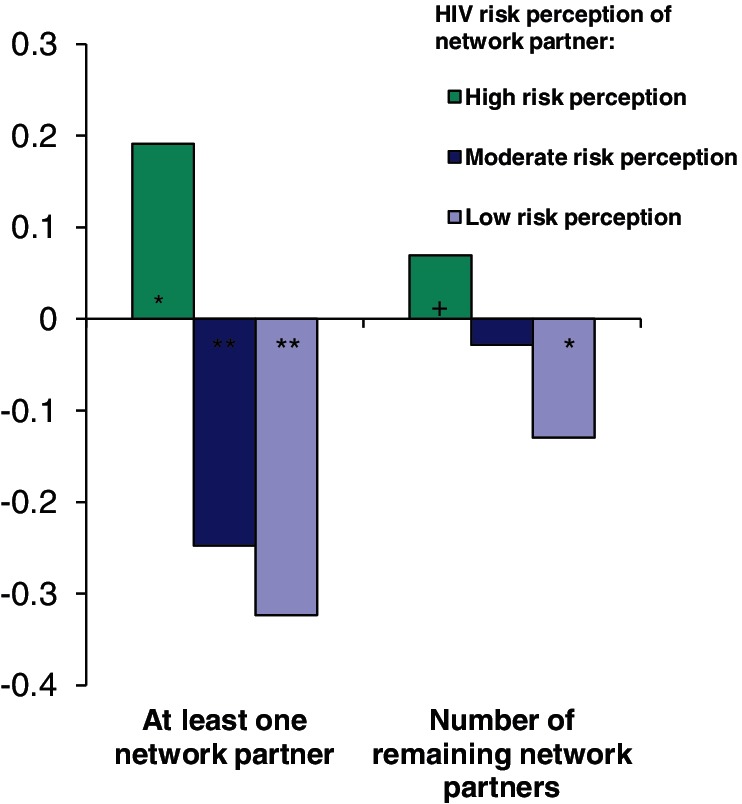
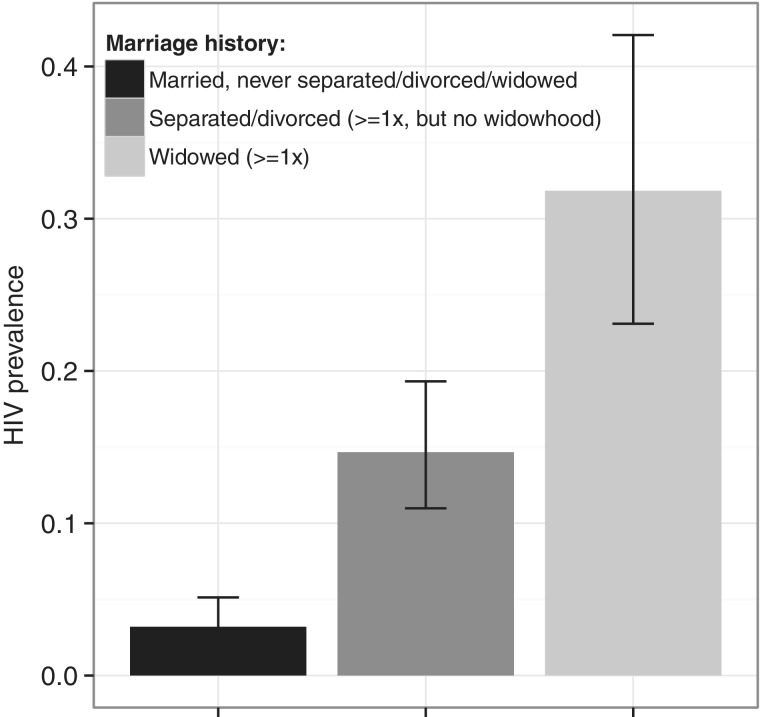
The Malawi Longitudinal Study of Families and Health (MLSFH) is one of very few long-standing, publicly available longitudinal cohort studies in a sub-Saharan African (SSA) context. It provides a rare record of more than a decade of demographic, socioeconomic and health conditions in one of the world's poorest countries. The MLSFH was initially established in 1998 to study social network influences on fertility behaviours and HIV risk perceptions, and over time the focus of the study expanded to include health, sexual behaviours, intergenerational relations and family/household dynamics. The currently available data include MLSFH rounds collected in 1998, 2001, 2004, 2006, 2008, 2010 and 2012 for up to 4000 individuals, providing information about socioeconomic and demographic characteristics, sexual behaviours, marriage, household/family structure, risk perceptions, social networks and social capital, intergenerational relations, HIV/AIDS and other dimensions of health. The MLSFH public use data can be requested on the project website: http://www.malawi.pop.upenn.edu/.


Figures

Figure 1
Figure 1
MLSFH study locations in Malawi
Figure 2
Figure 2
MLSFH sample flow 1998–2012. MLSFH sampling and related relevant data collection procedures are described in Appendix A2. Only MLSFH mature adults, defined as individuals aged 45 and older, who were interviewed in both 2008 and 2010, were eligible for the 2012 MLSFH (Appendix A6.8). MLSFH study instruments are described in Table 3. In addition to the major MLSFH waves noted above, the MLSFH also conducted a migration follow-up in 2007 (Appendix A2.2), a 2006–07 MLSFH Incentive Study (Appendix A6.6) that collected repeated sexual diaries and a 2009 MLSFH Biomarker Study collecting biomarkers for cardiovascular risk, organ/metabolic function and inflammation (Appendix A6.7). The MLSFH survey data are complemented by extensive qualitative and ethnographic data that have been collected during 1998–2012. Prev, previous
Figure 3
Figure 3
Effect of social network partners’ HIV/AIDS risk perceptions of MLSFH respondent’s own HIV/AIDS risk perceptions. The MLSFH survey measured perceived HIV/AIDS risk using the question How worried are you that you might catch AIDS?’, with three response categories ranging from ‘not worried at all (coded as 1) to ‘worried a lot’ (coded as 3). The respondent was asked a corresponding question about his/her social network partners’ HIV/AIDS risk perceptions (for up to four social network partners). The graph shows the effect of the network partners’ risk perception (by number of network partners in each subjective risk category) on the respondent’s own risk perception, estimated based on longitudinal MLSFH 1–2 data using an instrumental-variable fixed-effect regression technique that controls for unobserved respondent characteristics and the potential selective reporting of network partners by respondents. The graph shows that social interactions with network partners who have high HIV risk perceptions increase the respondent’s own risk perceptions about HIV/AIDS, and this effect is particularly pronounced for the first member in a respondent’s network with high risk perceptions. Network partners with moderate or low HIV risk perceptions tend to reduce respondent’s own worries about HIV/AIDS. P-values: +P ≤ 0.10; *P ≤ 0.05; **P ≤ 0.01. Source: based on estimation results in Kohler et al.
Figure 4
Figure 4
HIV prevalence for women aged 35 with different marital histories. Marital histories are measured as: (i) women who are married and have never experienced a separation, divorce or widowhood (predicted HIV prevalence = 3.2%, 95% CI: 2.0%–5.1%); (ii) women who have experienced at least one marital separation or divorce, but not widowhood (predicted HIV prevalence = 14.7%, 95% CI: 11.0%–19.3%); and (iii) women who have entered widowhood at least once (predicted HIV prevalence = 31.8%, 95% CI: 23.1%–42.1%). Predicted HIV status at age 35 is obtained from a logistic regression of HIV status on age and marital history using 947 ever-married women aged 25–45 who were interviewed in the 2008 (MLSFH 5) (57.4% were married and had never experienced a separation, divorce or widowhood; 31.9% had experienced at least one marital separation or divorce, but not widowhood; and 10.7% had entered widowhood at least once). Marital histories up to 2008 were constructed using data from the 2006, 2008 and 2010 MLSFH and were cleaned for consistency (Appendix A6.4). Only respondents with recorded marital histories and at least one valid MLSFH HIV test during 2006–08 are included. Respondents with at least one HIV-positive MLSFH HIV test during 2006–08 are considered HIV-positive and all others are considered HIV-negative at the 2008 MLSFH round (MLSFH 5). Source: own calculations based on reconstructed marriage histories provided by Chae
Figure 5
Figure 5
Distribution of remaining life expectancy (LE) by disability state. The figure shows the proportions of remaining life an average individual will spend in healthy, moderately limited and severely limited life at ages 45, 55, 65 and 75, for females (top panel) and males (bottom panel). The height and area of each bar is proportional to the overall remaining life expectancy of the synthetic cohorts with initial ages of 45, 55, 65 and 75 years, and the differently shaded areas represent the distribution of the remaining life expectancy across the three disability states: healthy, moderately limited and severely limited. The bars do not necessarily reflect the ordering of these life-years by disability states as individuals in our analysis can recover and relapse between disability states, so not all years of limitation are spent at the end of life. Analyses are based on MLSFH respondents from 2006, 2008 and 2010, using longitudinal data to estimate age-patterns of functional limitations and the transitions-over-time between different disability states using a discrete-time hazard model. Based on these transition rates, multi-state life tables (MSLTs) are estimated using microsimulation approaches to estimate the above LEs by disability state. Source: Payne et al. Mod, moderately; sev, severely; y, year

References

    1. Kohler HP, Thornton R. Conditional cash transfers and HIV/AIDS prevention: unconditionally promising? World Bank Econ Rev 2012;26:165–90. - PMC - PubMed
    1. Anglewicz P. Migration, marital dissolution, and HIV infection in Malawi. Demography 2012;49:239–65. - PMC - PubMed
    1. Kohler IV, Soldo BJ, Anglewicz P, Chilima B, Kohler HP. Association of blood lipids, creatinine, albumin and CRP with socioeconomic status in Malawi. Popul Health Metrics 2013;11:1–10. - PMC - PubMed
    1. Kohler IV, Anglewicz P, Kohler HP, Mcabe J, Chilima B, Soldo BJ. Evaluating health and disease in sub-Saharan Africa: minimally invasive collection of plasma in the Malawi Longitudinal Study of Families and Health. Genus 2012;68:1–27. - PMC - PubMed
    1. Gootjes J, Tel RM, Bergkamp FJM, Gorgels JPMC. Laboratory evaluation of a novel capillary blood sampling device for measuring eight clinical chemistry parameters and HbA1c. Clin Chim Acta 2009;401:152–57. - PubMed

Publication types

MeSH terms