

Multidimensional spectroscopy of photoreactivity
- PMID: 24639540
- PMCID: PMC3977289
- DOI: 10.1073/pnas.1323792111
Multidimensional spectroscopy of photoreactivity
Abstract
Coherent multidimensional electronic spectroscopy is commonly used to investigate photophysical phenomena such as light harvesting in photosynthesis in which the system returns back to its ground state after energy transfer. By contrast, we introduce multidimensional spectroscopy to study ultrafast photochemical processes in which the investigated molecule changes permanently. Exemplarily, the emergence in 2D and 3D spectra of a cross-peak between reactant and product reveals the cis-trans photoisomerization of merocyanine isomers. These compounds have applications in organic photovoltaics and optical data storage. Cross-peak oscillations originate from a vibrational wave packet in the electronically excited state of the photoproduct. This concept isolates the isomerization dynamics along different vibrational coordinates assigned by quantum-chemical calculations, and is applicable to determine chemical dynamics in complex photoreactive networks.
Keywords: 2D spectroscopy; photoreactive processes; ultrafast spectroscopy; vibrational coherence.
Conflict of interest statement
The authors declare no conflict of interest.
Figures

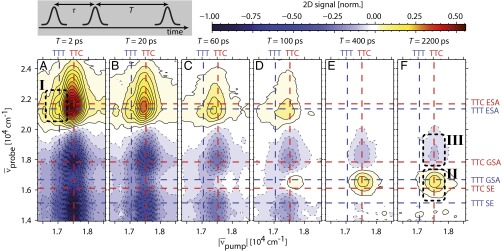
 spectrum. Negative values (blue) correspond to a decrease of the sample absorption, positive ones (yellow/red) to an increase. Contour lines (dashed for negative, solid for positive values) are drawn in intervals of 4% of the maximum amplitude. Maxima of the TTC contributions are indicated by red dashed lines, those of the TTT isomer by blue dashed lines. A scheme of the employed pulse sequence used to collect 2D/3D spectra in the pump–probe beam geometry is shown in the upper left.
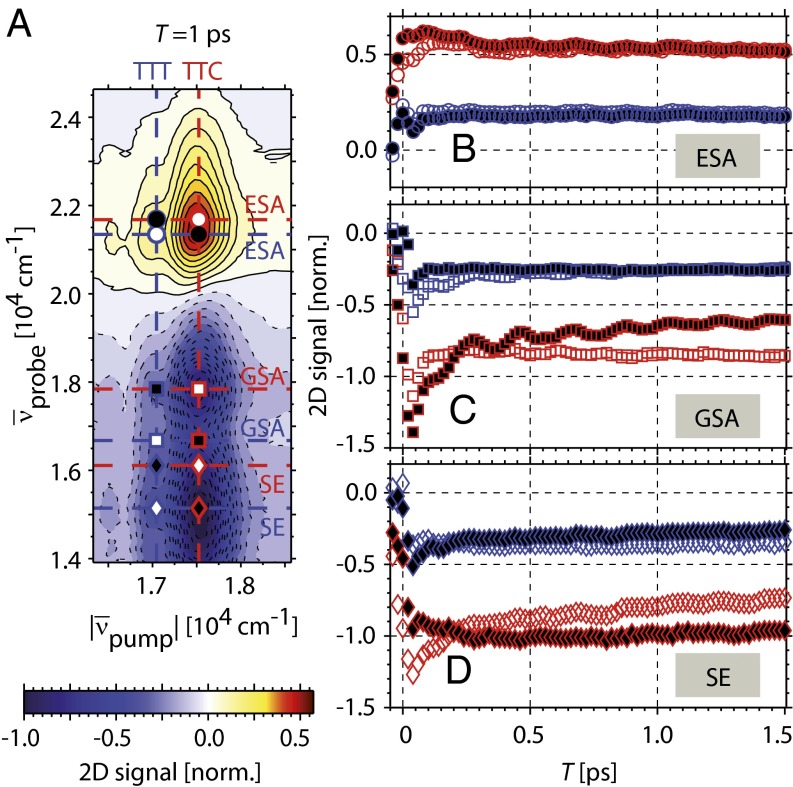
 . The temporal evolution as a function of population time is shown for (B) ESA (circles), (C) GSA (squares), and (D) SE signals (diamonds). Corresponding
  coordinates are indicated in A by their associated markers. Red markers represent contributions after TTC excitation, blue ones those after mostly TTT excitation. White filling corresponds to excitation and probing of the same isomer, black filling to different isomers, respectively.
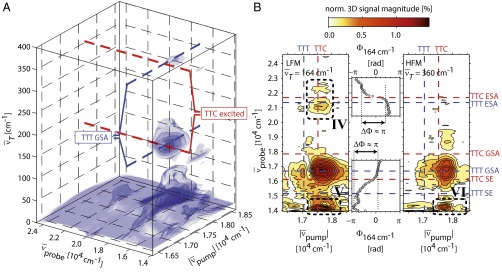
 plane for
  (Left) and 360 cm−1 (Right) and the phase for
  at a vertical cut at the TTC excitation wavenumber (Center).
References
-
- Zewail AH. Femtochemistry: Atomic-scale dynamics of the chemical bond. Angew Chem Int Ed Engl. 2000;39(15):2586–2631. - PubMed
-
- Hybl JD, Albrecht AW, Gallagher Faeder SM, Jonas DM. Two-dimensional electronic spectroscopy. Chem Phys Lett. 1998;297(3-4):307–313.
-
- Mukamel S. Principles of Nonlinear Optical Spectroscopy. New York: Oxford Univ Press; 1995.
-
- Cho M. Coherent two-dimensional optical spectroscopy. Chem Rev. 2008;108(4):1331–1418. - PubMed
-
- Ogilvie JP, Kubarych KJ. Multidimensional electronic and vibrational spectroscopy: An ultrafast probe of molecular relaxation and reaction dynamics. Adv At Mol Opt Phys. 2009;57:249–321.
Publication types
LinkOut - more resources
Full Text Sources
Other Literature Sources
