. 2014 Apr 1;111(13):4916-21.
doi: 10.1073/pnas.1323073111. Epub 2014 Mar 17.

Shifts in flowering phenology reshape a subalpine plant community

Affiliations

Shifts in flowering phenology reshape a subalpine plant community

Paul J CaraDonna et al. Proc Natl Acad Sci U S A. .

Erratum in

Abstract

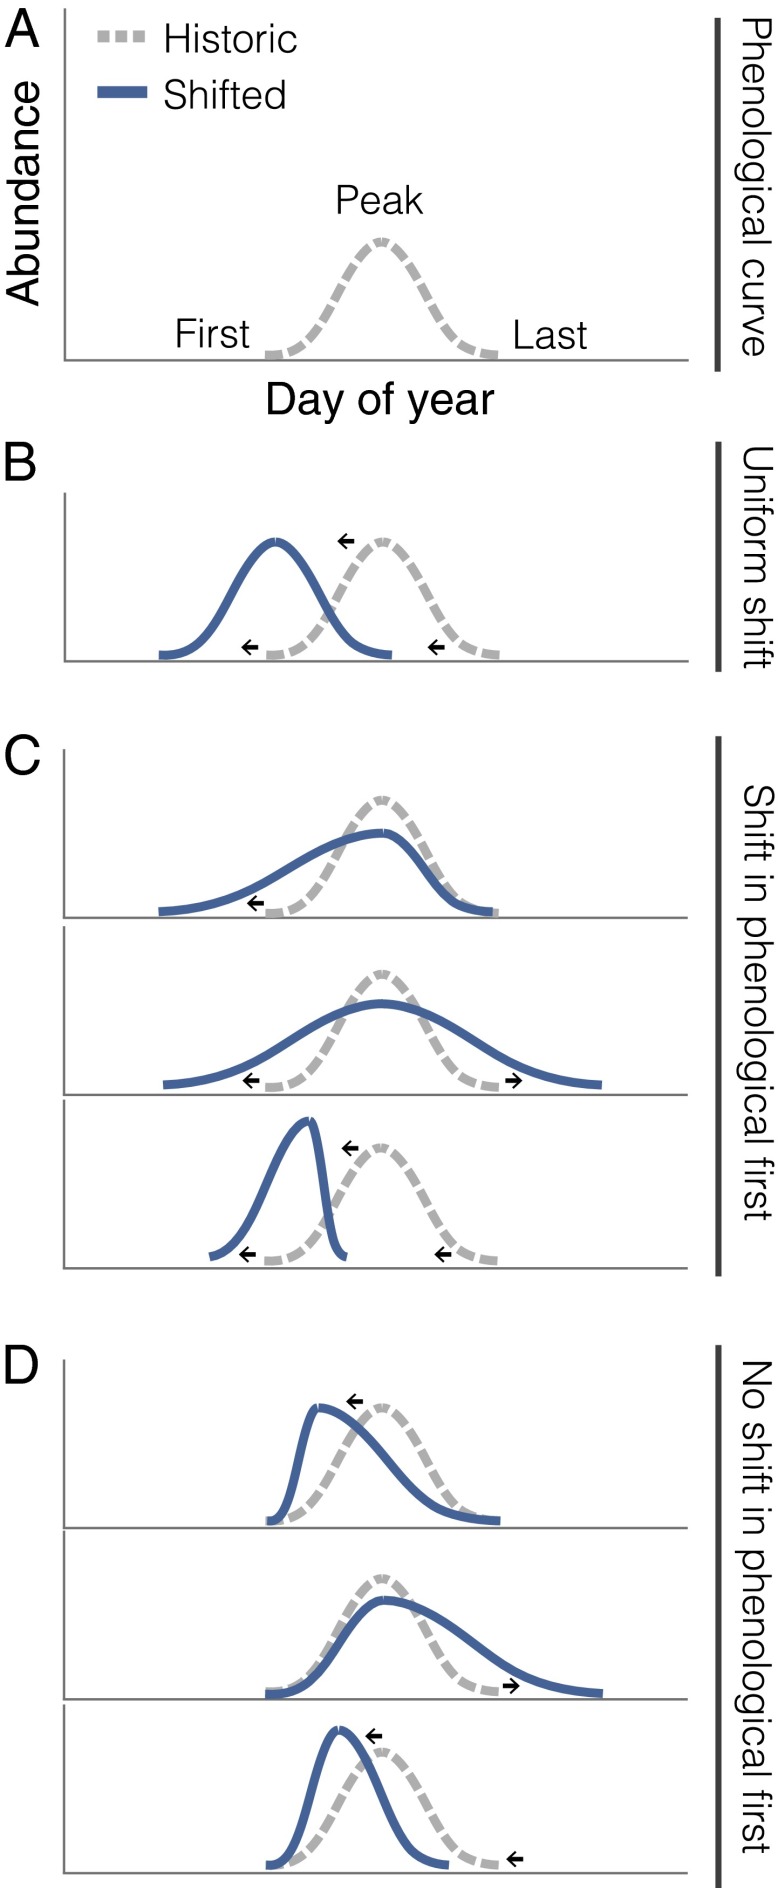
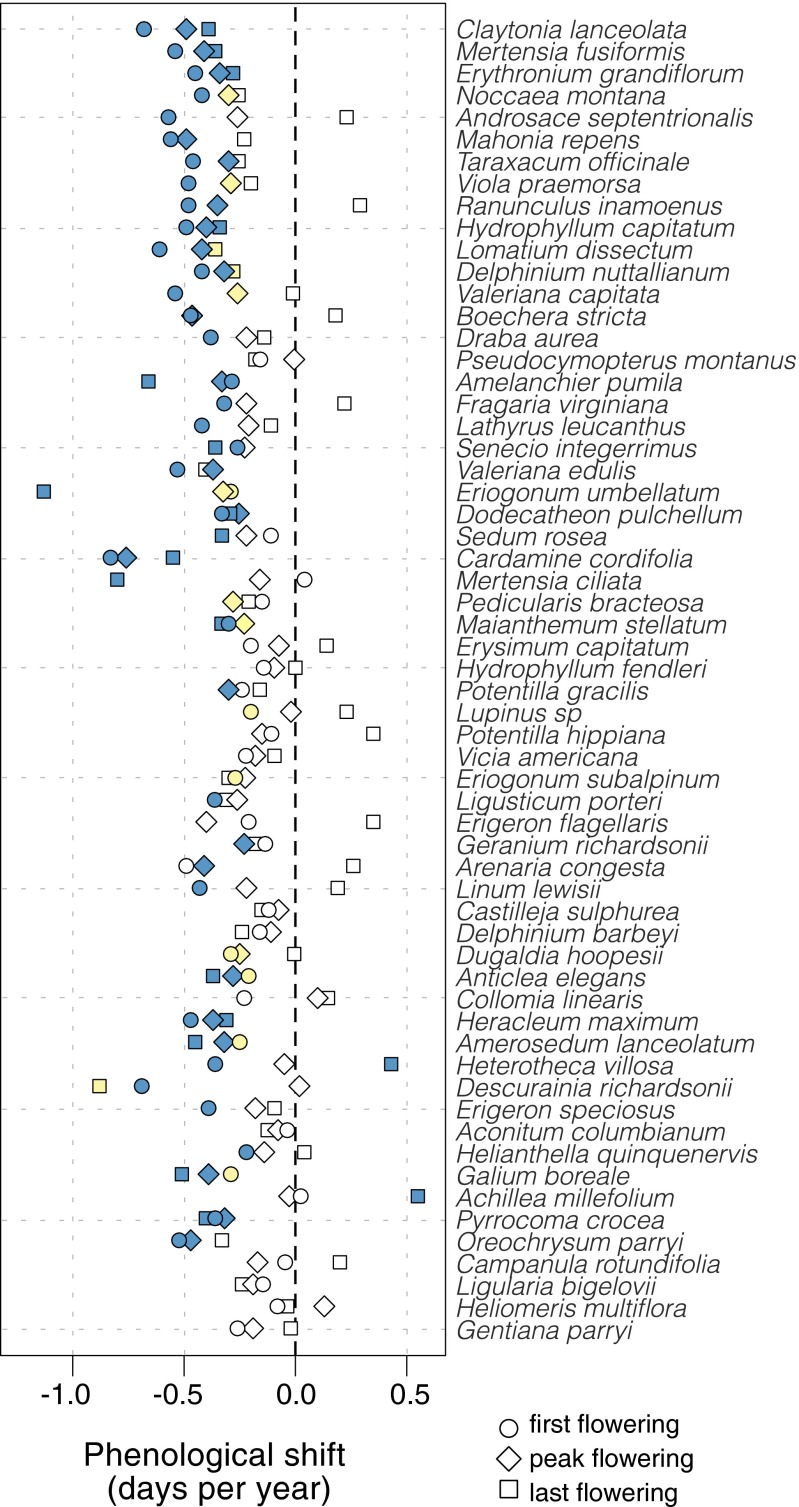
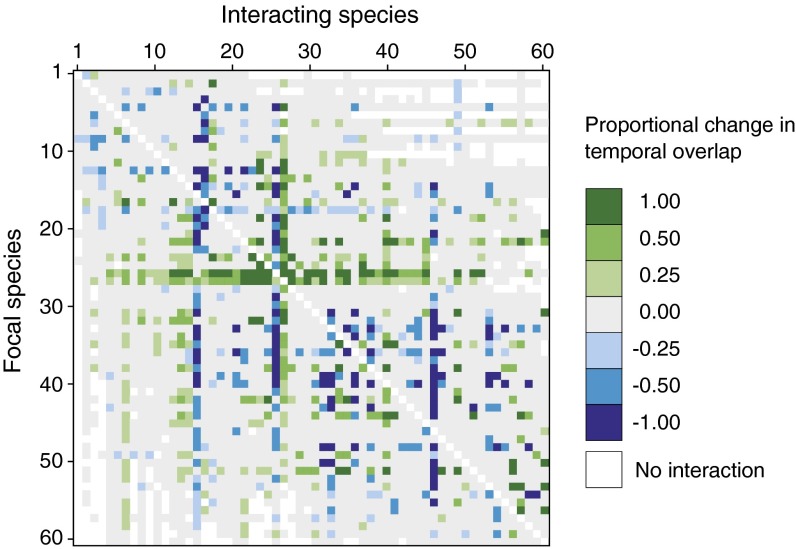
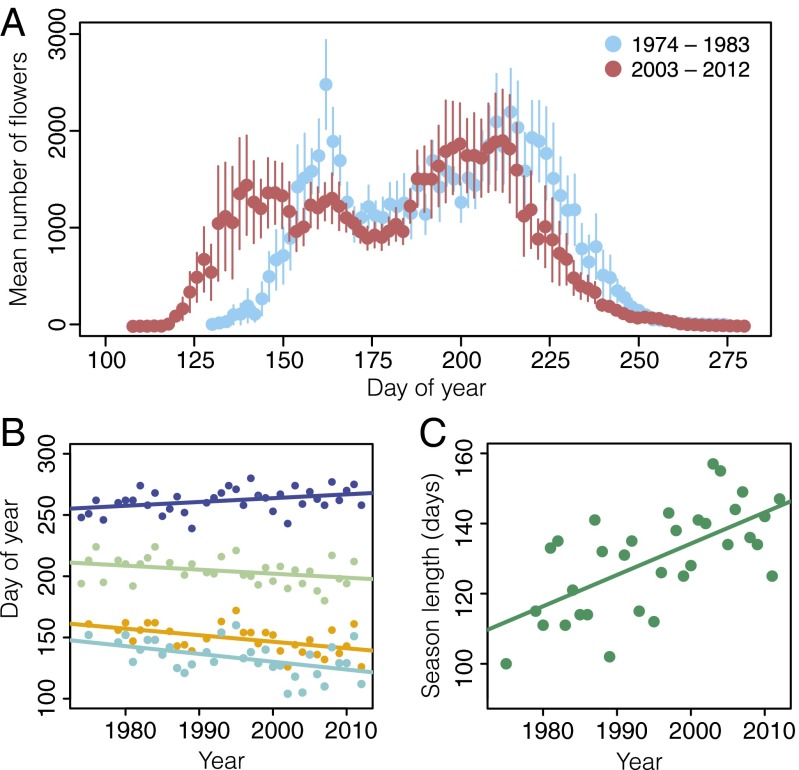
Phenology--the timing of biological events--is highly sensitive to climate change. However, our general understanding of how phenology responds to climate change is based almost solely on incomplete assessments of phenology (such as first date of flowering) rather than on entire phenological distributions. Using a uniquely comprehensive 39-y flowering phenology dataset from the Colorado Rocky Mountains that contains more than 2 million flower counts, we reveal a diversity of species-level phenological shifts that bring into question the accuracy of previous estimates of long-term phenological change. For 60 species, we show that first, peak, and last flowering rarely shift uniformly and instead usually shift independently of one another, resulting in a diversity of phenological changes through time. Shifts in the timing of first flowering on average overestimate the magnitude of shifts in the timing of peak flowering, fail to predict shifts in the timing of last flowering, and underrepresent the number of species changing phenology in this plant community. Ultimately, this diversity of species-level phenological shifts contributes to altered coflowering patterns within the community, a redistribution of floral abundance across the season, and an expansion of the flowering season by more than I mo during the course of our study period. These results demonstrate the substantial reshaping of ecological communities that can be attributed to shifts in phenology.

Keywords: growing season; no-analogue community; phenological mismatch; phenology curve; species interactions.


Conflict of interest statement

The authors declare no conflict of interest.

Figures

Fig. 1.
Fig. 1.
Conceptual representation of shifts in multiple phenological measures for individual species through time. (A) Multiple measures of flowering phenology available for 60 species from a 39-y study of a plant community in the Colorado Rocky Mountains, USA. (B) If shifts in first flowering change at a rate similar to changes in other measures of phenology, then the distribution shifts forward uniformly through time. (C and D) In contrast, shifts in first flowering may be unrepresentative of both the direction and magnitude of changes in peak and last flowering (C), and peak and last flowering may shift while first flowering remains unchanged (D). Arrows indicate a shift in phenology. For simplicity of conceptual illustration, initial species’ distributions are represented as a Gaussian curve, and the area under the curve is held constant.
Fig. 2.
Fig. 2.
Shifts in flowering phenology over 39 y (1974–2012). Each symbol represents a phenological shift as the slope of a line from simple linear regressions of first, peak, and last flowering by year (n = no. of years for each species). Significant shifts are represented in blue (P ≤ 0.05), marginally significant shifts in pale yellow (0.05 < P ≤ 0.10), and nonsignificant shifts in white (P > 0.10). Species are presented in order of mean date of first flowering throughout the growing season.
Fig. 3.
Fig. 3.
Community-level change in interaction potential over 39 y. Each cell represents the proportional change in interaction potential, or coflowering overlap, between species pairs over the 39-y study period (1974–2012). Coflowering was calculated annually as the total number of flowers of every species pair that overlap in time, divided by the total number of flowers of the focal species (see main text for an example). To represent change in coflowering visually for all species, we multiplied each rate of change by 39 y; thus, a proportional change of 0.25 indicates a 25% increase in overlap of a focal species with an interacting species over the course of our study period. Proportional changes in overlap values are binned (e.g., 0.25 = 0.01–0.25). Colored cells indicate significant changes in interaction potential through time (P ≤ 0.05), gray cells indicate no change, and white cells indicate cases in which species pairs did not coflower in any years of the study. Species are ordered by mean first flowering date (as in Fig. 2).
Fig. 4.
Fig. 4.
Aggregate community-level shifts in flowering phenology. (A) Comparison of the season-wide flowering curves for the first and last 10 y of the dataset; 10-y means were used to visualize the amount of change that has occurred in the community flowering curve. Each dot is the 10-y mean number of flowers; error bars are ±1 SEM. (B) Phenological shifts through time for first flowering of the community (cyan), last flowering for the community (dark blue), and timing of community-level spring peak (orange) and summer peak (green); each dot represents a community-level phenological measure in 1 y. (C) Change in the length of the flowering season; each dot represents the total number of days on which open flowers were present in each year.

References

    1. Forrest J, Miller-Rushing AJ. Toward a synthetic understanding of the role of phenology in ecology and evolution. Philos Trans R Soc Lond B Biol Sci. 2010;365(1555):3101–3112. - PMC - PubMed
    1. Parmesan C. Influences of species, latitudes and methodologies on estimates of phenological response to global warming. Glob Change Biol. 2007;13(9):1860–1872.
    1. Cook BI, Wolkovich EM, Parmesan C. Divergent responses to spring and winter warming drive community level flowering trends. Proc Natl Acad Sci USA. 2012;109(23):9000–9005. - PMC - PubMed
    1. Ovaskainen O, et al. Community-level phenological response to climate change. Proc Natl Acad Sci USA. 2013;110(33):13434–13439. - PMC - PubMed
    1. Fitter AH, Fitter RS. Rapid changes in flowering time in British plants. Science. 2002;296(5573):1689–1691. - PubMed

Publication types