. 2014 Apr 1;111(13):4892-7.
doi: 10.1073/pnas.1315445111. Epub 2014 Mar 17.

Genome-wide activity of unliganded estrogen receptor-α in breast cancer cells

Affiliations

Genome-wide activity of unliganded estrogen receptor-α in breast cancer cells

Livia Caizzi et al. Proc Natl Acad Sci U S A. .

Abstract

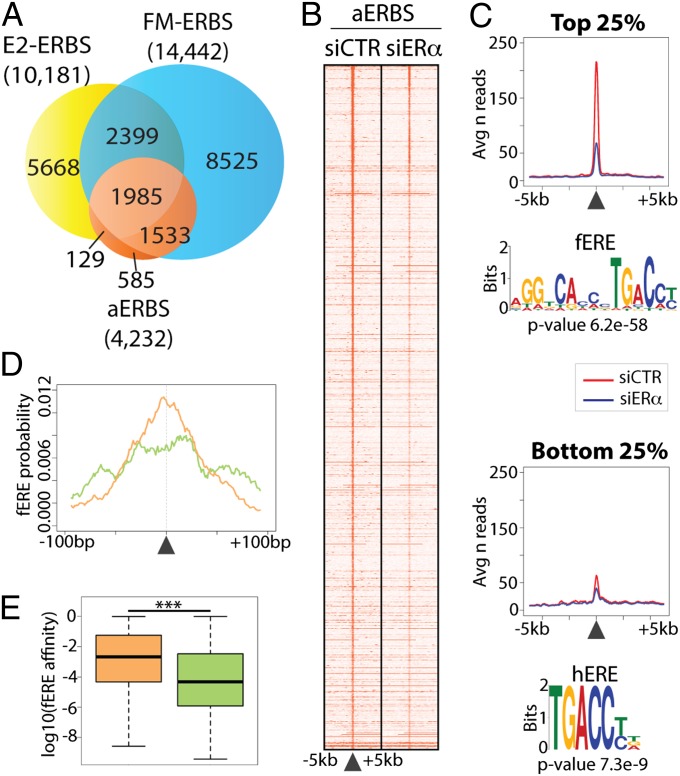
Estrogen receptor-α (ERα) has central role in hormone-dependent breast cancer and its ligand-induced functions have been extensively characterized. However, evidence exists that ERα has functions that are independent of ligands. In the present work, we investigated the binding of ERα to chromatin in the absence of ligands and its functions on gene regulation. We demonstrated that in MCF7 breast cancer cells unliganded ERα binds to more than 4,000 chromatin sites. Unexpectedly, although almost entirely comprised in the larger group of estrogen-induced binding sites, we found that unliganded-ERα binding is specifically linked to genes with developmental functions, compared with estrogen-induced binding. Moreover, we found that siRNA-mediated down-regulation of ERα in absence of estrogen is accompanied by changes in the expression levels of hundreds of coding and noncoding RNAs. Down-regulated mRNAs showed enrichment in genes related to epithelial cell growth and development. Stable ERα down-regulation using shRNA, which caused cell growth arrest, was accompanied by increased H3K27me3 at ERα binding sites. Finally, we found that FOXA1 and AP2γ binding to several sites is decreased upon ERα silencing, suggesting that unliganded ERα participates, together with other factors, in the maintenance of the luminal-specific cistrome in breast cancer cells.

Keywords: chromatin binding; enhancer; epigenetics; pioneer factors; transcriptome.


Conflict of interest statement

The authors declare no conflict of interest.

Figures

Fig. 1.
Fig. 1.
(A) Venn diagram of aERBS, FM-ERBS (17), and in E2-treated MCF7 cells (E2-ERBS) (15). (B) Peak intensity heat map of aERBS in a ± 5-Kbp genomic window. The 4,232 aERBS significantly enriched over IgG (siCTR) are ranked on P value versus ERα ChIP-seq in siERα-treated cells. (C) Average read counts for top and bottom quartiles in siCTR and siERα peaks. The S-logo indicates the most enriched motif in this quartile. (D) Localization probability of a fERE within 200 bp around the peak center of top 25% (orange) and bottom 25% (green). (E) Box plot depicting the predicted affinity of fERE as in D of the top (orange) and bottom (green) 25% (***P < 0.001; two-tailed unpaired t-test). Black arrow indicates ERα peak center.
Fig. 2.
Fig. 2.
(A) Semantic similarity of GO Biological Process terms enriched by GREAT (18) in aERBS, FM-ERBS (17), or in E2-treated cells (E2-ERBS) (15). The heat map (Right) reports the semantic similarity computed between the following subsets: aERBS in common with FM or E2-treated conditions (aERBS/FM-ERBS shared; aERBS/E2-ERBS shared); ERBS detected in FM or E2 only (FM-ERBS only; E2-ERBS only); aERBS not present in FM or E2 (aERBS only/not E2-ERBS and aERBS only/not FM-ERBS). The three most represented GO categories for each cluster are indicated on the left. (B) Circos plot of TFBS predictions versus ChIP-seq datasets overlap relative to aERBS. Left heat map (red scale): predicted TFBS matrix frequency. Right heat map (blue scale): fraction of aERBS overlapped to TFBS reported by ChIP-seq. TFBS and ChIP-seq datasets characterized by the highest similarity are connected by lines of increasing color intensity, proportional to matrix similarity. Veh, untreated; E2, estrogen-treated; FM, full medium.
Fig. 3.
Fig. 3.
ChIP-qPCR analysis of ERα target genes (A) following siCTR or siERα transfection, in HD and in SF medium; (B) after treatment with vehicle (NT) or 10 nM E2 for 45 min (E2). GAPDH promoter was used as a negative control region (Neg). (C) qRT-PCR mRNA analysis of target genes in HD and SF medium. Values are shown as ratios of relative mRNA level in siERα versus siCTR treated cells. (D) qRT-PCR mRNA analysis of TFF1 and FMN1 after siERα transfection or shERα transduction in HD, FM, and 10 nM E2 treatment in HD (E2). Error bars represent the SD of three independent biological replicates.
Fig. 4.
Fig. 4.
(A) Genome-browser view of examples of DE protein coding (TFF1 and TF53INP1) and noncoding genes (H19 and RP11-428L9.2.1) after siCTR or siERα transfection. Only the main gene isoform is shown. (B) Fraction of up-regulated and down-regulated genes upon ERα silencing. C, coding genes; NC, noncoding genes. (C) Heat map representation of the overlap between DE genes (column A) and seven microarray gene expression datasets in E2-treated MCF7 cells (columns B–H) and two datasets in MCF7 switched to HD medium for 48 (column I) and 72 h (column J). Details of each dataset are reported in Dataset S3B. (Right) Relative effect of siERα vs. E2-effect, calculated as siERα Log2FC minus median Log2FC of E2-treated datasets. (D) Box plot distribution of the distance between the TSS of the DE genes and the closest aERBS center, compared with 1,000 random gene sets. (***P < 0.001; two-tailed unpaired t test). Down, down-regulated; Up, up-regulated; Rd, random genes.
Fig. 5.
Fig. 5.
(A) Growth curves of MCF7 cells transduced with control shRNA (black line) or ERα shRNA (gray line) maintained in HD medium. (B) Morphological changes occurring in MCF7 cells after ERα silencing. (C) ChIP analysis of H3K27me3 at selected aERBS (*P < 0.05, **P < 0.01; one-tailed paired t test). (D and E) ChIP analysis of FOXA1 (D) and AP2γ (E) as above. (F) Western blot analysis of ERα, FOXA1 and AP2γ proteins. αtub, α-tubulin: loading control. (G–I) ChIP analysis of ERα (G), FOXA1 (H), and AP2γ (I) at selected aERBS predicted to contain FOXA1 binding but not AP2γ binding sites. Intg1, -2, -3: anonymous intergenic aERBS. For ChIP experiments, GAPDH promoter was used as negative control (Neg). For all of the experiments shown (B–I), MCF7 cells transduced with shCTR or shERα were cultured for three days in HD medium before analysis. Error bars are SD of three independent biological replicates. (Magnification: B, 10×.)

References

    1. Al Saleh S, Al Mulla F, Luqmani YA. Estrogen receptor silencing induces epithelial to mesenchymal transition in human breast cancer cells. PLoS ONE. 2011;6(6):e20610. - PMC - PubMed
    1. Maggi A. Liganded and unliganded activation of estrogen receptor and hormone replacement therapies. Biochim Biophys Acta. 2011;1812(8):1054–1060. - PMC - PubMed
    1. Cvoro A, et al. Distinct roles of unliganded and liganded estrogen receptors in transcriptional repression. Mol Cell. 2006;21(4):555–564. - PubMed
    1. Dhasarathy A, Kajita M, Wade PA. The transcription factor snail mediates epithelial to mesenchymal transitions by repression of estrogen receptor-alpha. Mol Endocrinol. 2007;21(12):2907–2918. - PMC - PubMed
    1. Cardamone MD, et al. ERalpha as ligand-independent activator of CDH-1 regulates determination and maintenance of epithelial morphology in breast cancer cells. Proc Natl Acad Sci USA. 2009;106(18):7420–7425. - PMC - PubMed

Publication types

Associated data