. 2010 Jul 1;121(1):1-27.
doi: 10.1086/669706.

Intellectual property rights and innovation: Evidence from the human genome

Affiliations

Intellectual property rights and innovation: Evidence from the human genome

Heidi L Williams. J Polit Econ. .

Abstract

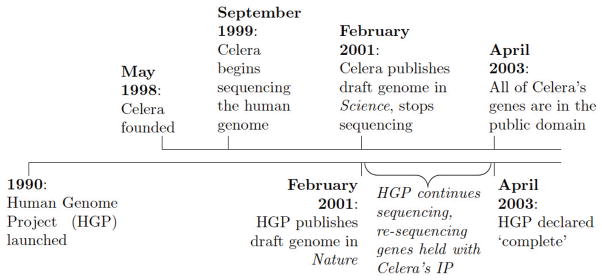
Do intellectual property (IP) rights on existing technologies hinder subsequent innovation? Using newly-collected data on the sequencing of the human genome by the public Human Genome Project and the private firm Celera, this paper estimates the impact of Celera's gene-level IP on subsequent scientific research and product development. Genes initially sequenced by Celera were held with IP for up to two years, but moved into the public domain once re-sequenced by the public effort. Across a range of empirical specifications, I find evidence that Celera's IP led to reductions in subsequent scientific research and product development on the order of 20 to 30 percent. Taken together, these results suggest that Celera's short-term IP had persistent negative effects on subsequent innovation relative to a counterfactual of Celera genes having always been in the public domain.


Figures

Figure 1
Figure 1
Timeline of Key Events Notes: This figure summarizes the key events analyzed in this paper. For details, see Collins and Galas (1993), Venter et al. (1998), Venter (2000), Lander et al. (2001), Venter et al. (2001), and Wade (2003).
Figure 2
Figure 2
Documenting the Link Between Scientific Research & Product Development Notes: These figures provide two sets of descriptive statistics that document the link between scientific research and product development in my data. In sub-figure (a), the dashed line plots the empirical cumulative distribution function of the number of publications between 1970-2000 for genes that do not have a diagnostic test available as of 2009, and the solid line plots the empirical cumulative distribution function of the number of publications between 1970-2000 for genes that do have a diagnostic test available as of 2009. In sub-figure (b), the dashed line plots the distribution of genes by the number of publications between 1970-2000, and the solid line plots the share of genes with a diagnostic test as of 2009 at each number of publications. See text and online appendix for more detailed data and variable descriptions.
Figure 3
Figure 3
Investigating Selection into Celera’s IP Notes: This figure provides three sets of descriptive statistics investigating the selection of genes into Celera’s intellectual property (IP). The solid line (“all genes”) plots the difference in mean publications on Celera genes and mean publications on non-Celera genes in each year from 1970 to 2000. The dashed line (“genes sequenced in 2001”) plots the difference in mean publications on Celera genes and mean publications on non-Celera genes that were sequenced in 2001 in each year from 1970 to 2000. The dotted line (“Celera genes”) plots the difference in mean publications on Celera genes resequenced in 2003 and mean publications on Celera genes resequenced in 2002 in each year from 1970 to 2000. See text and online appendix for more detailed data and variable descriptions.
Figure 4
Figure 4
Panel Estimates: Impact of Celera’s IP on Innovation Outcomes Notes: These figures plot coefficients (and 95 percent confidence intervals) from the event study specification described in Section 3.2. On the x axes are years z relative to a “zero” relative year that marks the last year the gene was held with Celera’s IP (that is, year 1 marks the first year the gene was in the public domain). As in the specifications in Table 4, this specification is based on gene-year level observations, the coefficients are estimates from ordinary-least-squares (OLS) models, the sample includes all gene-years from 2001 to 2009, and the standard errors are robust and clustered at the gene level. See text and online appendix for more detailed data and variable descriptions.
Figure 5
Figure 5
Average Innovation Outcomes for Celera Genes by Year, by Year of Re-sequencing by the Public Effort Notes: These figures plot the descriptive statistics described in Section 3.3. Sample includes all Celera genes. Means are shown separately for Celera genes that were re-sequenced by the public effort in 2002 (N = 1,047) and for Celera genes that were re-sequenced by the public effort in 2003 (N = 635). See text and online appendix for more detailed data and variable descriptions.

References

    1. Aghion Philippe, Dewatripont Mathias, Stein Jeremy. Academic freedom, private-sector focus, and the process of innovation. RAND Journal of Economics. 2008;39(3):617–635.
    1. Anand Bharat, Khanna Tarun. The structure of licensing contracts. Journal of Industrial Economics. 2000;48(1):103–135.
    1. Arrow Kenneth. Economic welfare and the allocation of resources for invention. In: Nelson Richard., editor. The Rate and Direction of Inventive Activity. Princeton University Press; 1962.
    1. Bessen James. Holdup and licensing of cumulative innovations with private information. Economics Letters. 2004;82(3):321–326.
    1. Cho Mildred, Illangasekare Samantha, Weaver Meredith, Leonard Debra, Merz Jon. Effects of patents and licenses on the provision of clinical genetic testing services. Journal of Molecular Diagnostics. 2003;5(1):3–8. - PMC - PubMed

Publication types

LinkOut - more resources