

Next-generation DNA barcoding: using next-generation sequencing to enhance and accelerate DNA barcode capture from single specimens
- PMID: 24641208
- PMCID: PMC4276293
- DOI: 10.1111/1755-0998.12236
Next-generation DNA barcoding: using next-generation sequencing to enhance and accelerate DNA barcode capture from single specimens
Abstract
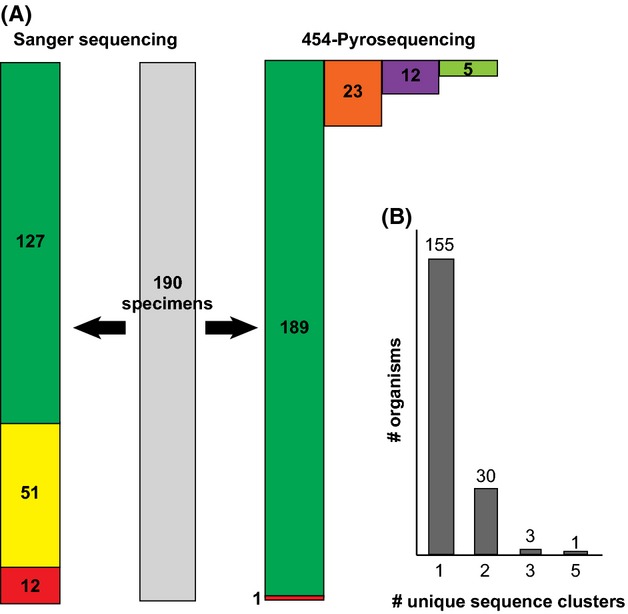
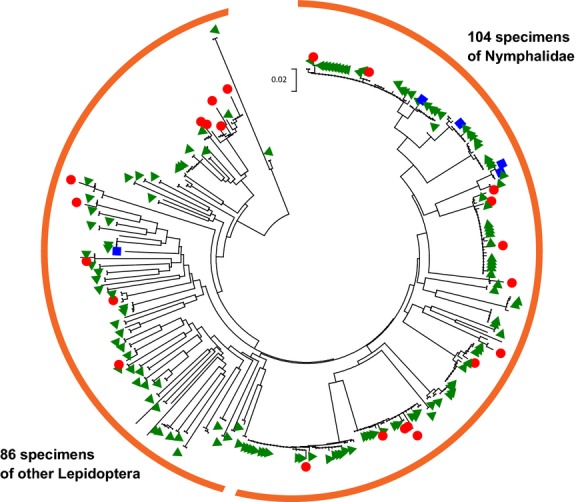
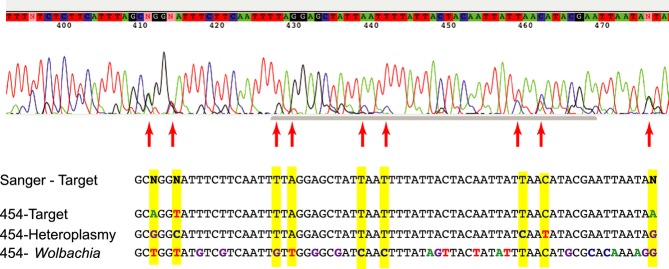
DNA barcoding is an efficient method to identify specimens and to detect undescribed/cryptic species. Sanger sequencing of individual specimens is the standard approach in generating large-scale DNA barcode libraries and identifying unknowns. However, the Sanger sequencing technology is, in some respects, inferior to next-generation sequencers, which are capable of producing millions of sequence reads simultaneously. Additionally, direct Sanger sequencing of DNA barcode amplicons, as practiced in most DNA barcoding procedures, is hampered by the need for relatively high-target amplicon yield, coamplification of nuclear mitochondrial pseudogenes, confusion with sequences from intracellular endosymbiotic bacteria (e.g. Wolbachia) and instances of intraindividual variability (i.e. heteroplasmy). Any of these situations can lead to failed Sanger sequencing attempts or ambiguity of the generated DNA barcodes. Here, we demonstrate the potential application of next-generation sequencing platforms for parallel acquisition of DNA barcode sequences from hundreds of specimens simultaneously. To facilitate retrieval of sequences obtained from individual specimens, we tag individual specimens during PCR amplification using unique 10-mer oligonucleotides attached to DNA barcoding PCR primers. We employ 454 pyrosequencing to recover full-length DNA barcodes of 190 specimens using 12.5% capacity of a 454 sequencing run (i.e. two lanes of a 16 lane run). We obtained an average of 143 sequence reads for each individual specimen. The sequences produced are full-length DNA barcodes for all but one of the included specimens. In a subset of samples, we also detected Wolbachia, nontarget species, and heteroplasmic sequences. Next-generation sequencing is of great value because of its protocol simplicity, greatly reduced cost per barcode read, faster throughout and added information content.
Keywords: COI; DNA; Lepidoptera; Wolbachia; biodiversity; genomics; heteroplasmy; taxonomy.
© 2014 The Authors. Molecular Ecology Resources Published by John Wiley & Sons Ltd.
Figures

References
-
- Berthier K, Chapuis M-P, Moosavi SM, Tohidi-Esfahani D, Sword GA. Nuclear insertions and heteroplasmy of mitochondrial DNA as two sources of intra-individual genomic variation in grasshoppers. Systematic Entomology. 2011;36:285–299.
-
- Boessenkool S, Epp LS, Haile J, et al. Blocking human contaminant DNA during PCR allows amplification of rare mammal species from sedimentary ancient DNA. Molecular Ecology. 2012;21:1806–1815. - PubMed
-
- Brower AVZ. Problems with DNA barcodes for species delimitation: ‘Ten species’ of Astraptes fulgerator reassessed (Lepidoptera: Hesperiidae) Systematics and Biodiversity. 2006;4:127–132.
Publication types
MeSH terms
LinkOut - more resources
Full Text Sources
Other Literature Sources
Miscellaneous
