. 2014 Aug;13(4):584-95.
doi: 10.1111/acel.12210. Epub 2014 Mar 18.

Accelerated microglial pathology is associated with Aβ plaques in mouse models of Alzheimer's disease

Affiliations

Accelerated microglial pathology is associated with Aβ plaques in mouse models of Alzheimer's disease

Rona Baron et al. Aging Cell. 2014 Aug.

Abstract

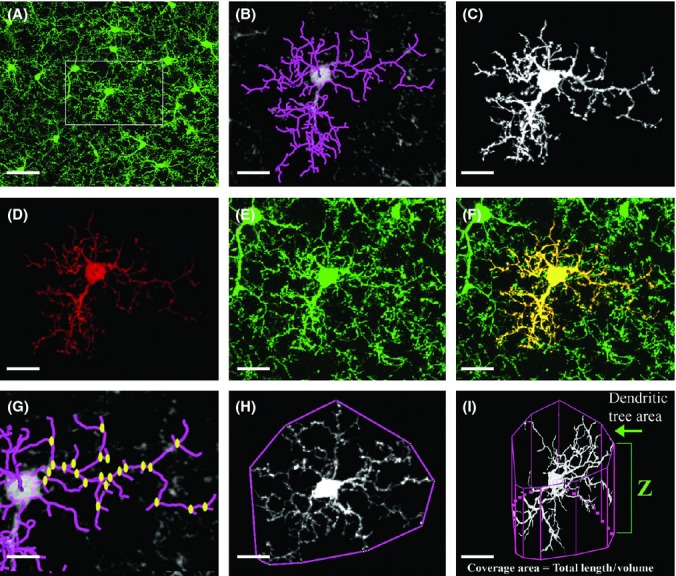
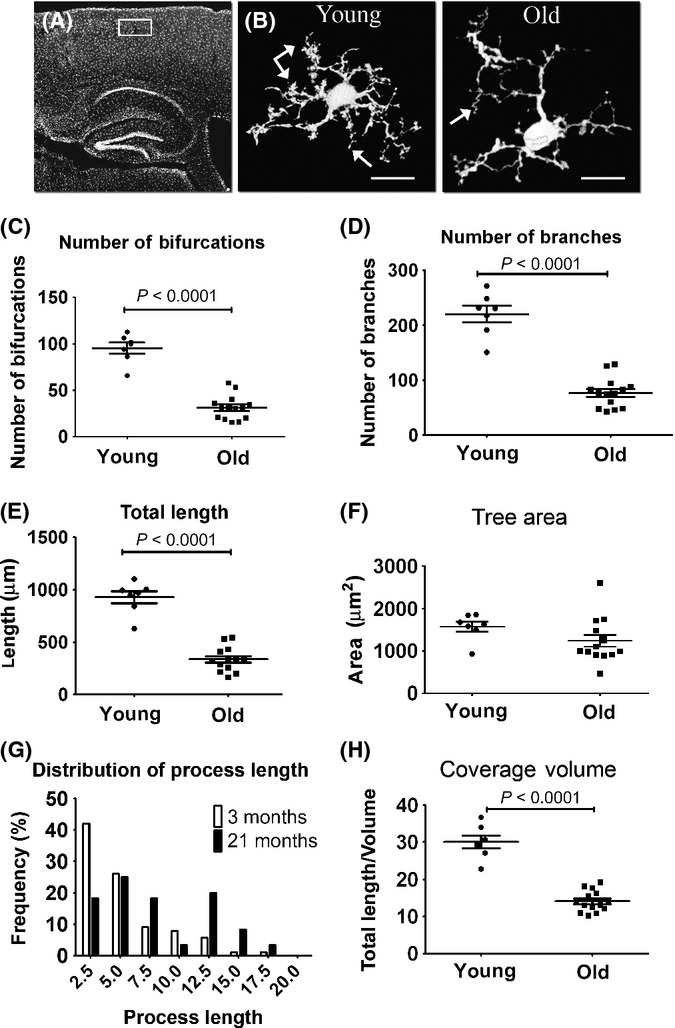
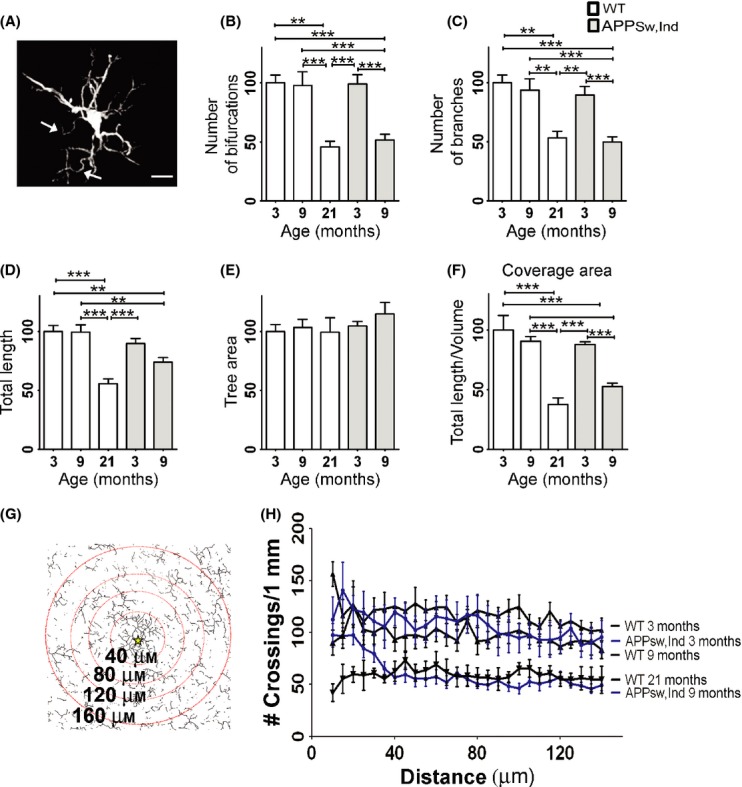
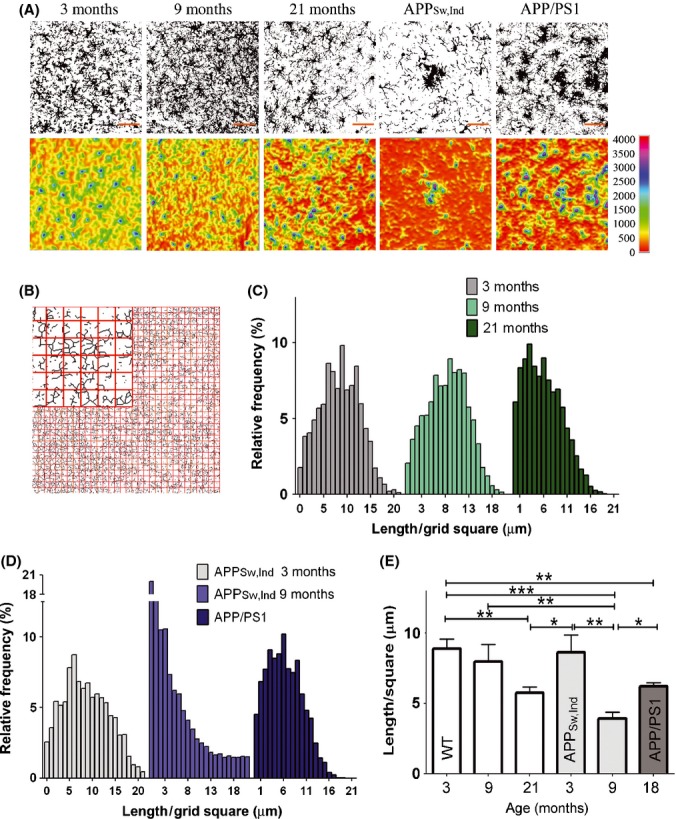
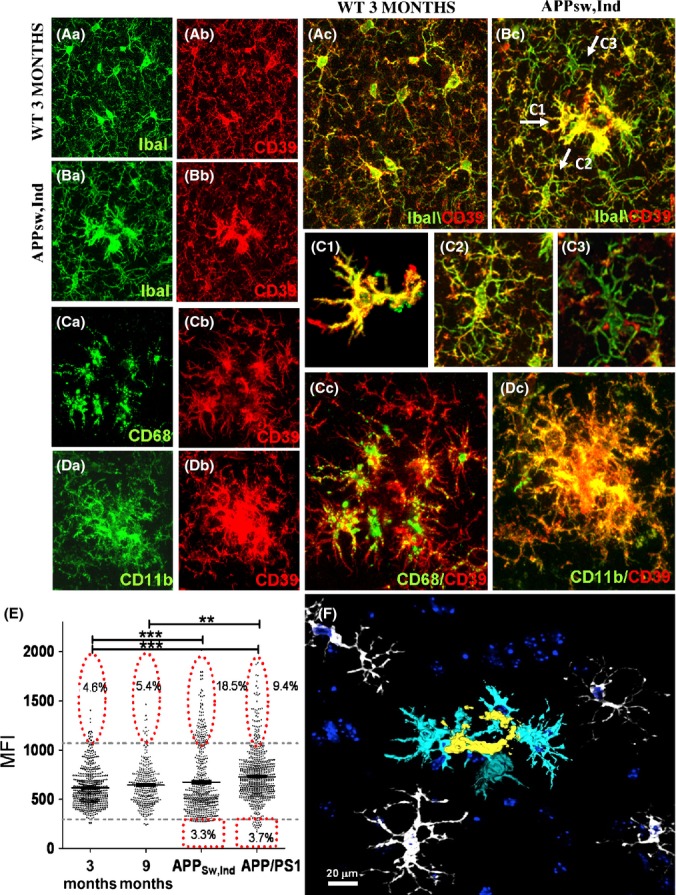
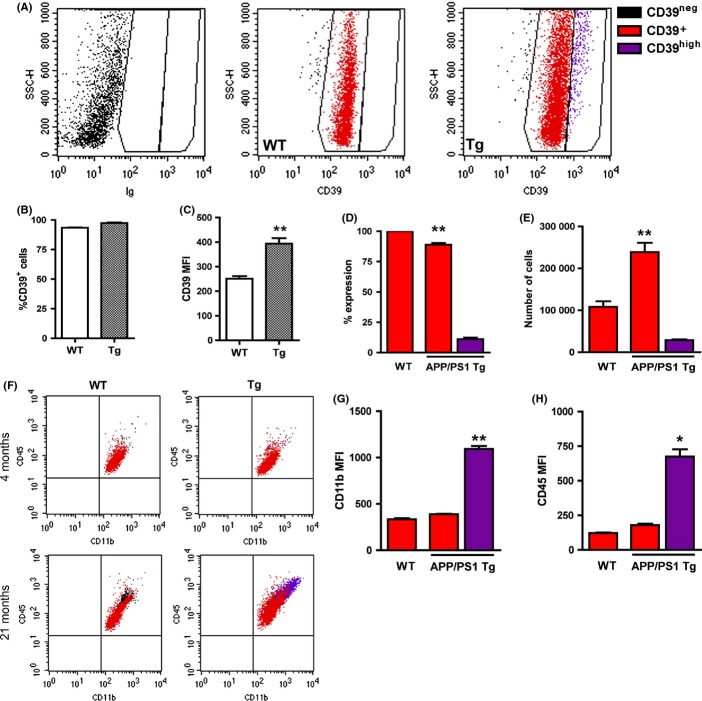
Microglia integrate within the neural tissue with a distinct ramified morphology through which they scan the surrounding neuronal network. Here, we used a digital tool for the quantitative morphometric characterization of fine cortical microglial structures in mice, and the changes they undergo with aging and in Alzheimer's-like disease. We show that, compared with microglia in young mice, microglia in old mice are less ramified and possess fewer branches and fine processes along with a slightly increased proinflammatory cytokine expression. A similar microglial pathology appeared 6-12 months earlier in mouse models of Alzheimer's disease (AD), along with a significant increase in brain parenchyma lacking coverage by microglial processes. We further demonstrate that microglia near amyloid plaques acquire unique activated phenotypes with impaired process complexity. We thus show that along with a chronic proinflammatory reaction in the brain, aging causes a significant reduction in the capacity of microglia to scan their environment. This type of pathology is markedly accelerated in mouse models of AD, resulting in a severe microglial process deficiency, and possibly contributing to enhanced cognitive decline.

Keywords: Alzheimer's disease; aging; amyloid beta-peptide; inflammation; microglia; morphology.


Figures

Figure 1
Figure 1
3-D morphological analysis of individual microglia. Brains from young (3 months old) CX3CR1GFP/+ Tg mice were fixed, sectioned, and subjected to confocal microscopy and digital image analysis as described in Experimental procedures. (A) A representative z-projection image of GFP-labeled cells, showing the distribution of microglia in the cortex. Framed area is enlarged in (B–F). (B) The backbone (purple-colored processes) of a single cell traced with the Simple Neurite Tracer plug-in. (C) A 3-D view of the single cell generated with the ‘filling option’ within Simple Neurite Tracer plug-in and exported for visualization with the Volocity software. (D) A z-projection of the cell, overlaid on top of the original z-projection GFP image (E, enlargement of the framed area in A). (F) The merged image of D and E, showing the individual microglia cell analyzed in yellow. (G–I) The principle parameters analyzed with the L-measure software: (G) the total number of bifurcations (yellow dots) and the total branch length (purple-colored processes); (H) the tree area, calculated as the area constrained by the polygonal object defined by connecting the outer points of the branches; (I) the coverage volume of individual microglia, calculated as the total branch length of the cell divided by its volume and normalized for a 10 μm3 unit of tissue volume. The volume of microglia was calculated by the total tree area multiplied by the cell depth (Z). Bars represent 20 μm (A, I); 15 μm (B–F, H); 10 μm (G).
Figure 2
Figure 2
GFP-labeled microglial process complexity deteriorates with aging. Young (3 months old) and old (21 months old) CX3CR1+/GFP Tg mice were killed, and brain sections were quantitatively analyzed for individual microglial morphology. (A) Overview image of a sagittal brain section showing the cortical area (area denoted by a white rectangle) used for morphological analysis. (B) Representative z-projection images of microglia from young (left panel, arrows point to fine tips) and old (right panel, arrows show twisted processes) mice, traced with the Simple Neurite Tracer plug-in. (C–F) Morphological analysis of randomly selected young and old cortical microglia (layer 2/3), preformed with the L-measure software and statistically analyzed with GraphPad. Scatter plot graphs show means (horizontal line) ±SEM, and each dot represents one cell analyzed. Graphs indicate the number of bifurcations (C), the number of branches (D), the total branch length (E), and the total tree area (F) of individual microglia in young (three mice; n = 7 cells) and old (five mice; n = 14 cells) mice. (G) A histogram indicating the distribution of microglial process length. (H) The coverage volume governed by individual microglia cells, depicted by the length of processes in a 10 μm3 unit of tissue. P values were calculated with Student’s t-test. See Experimental procedures for further details. Bar represents 15 μm (young), 10 μm (old).
Figure 3
Figure 3
Microglial morphology is altered in a mouse model of Alzheimer’s disease (AD). Brains from young (3 months old) and adult (9 months old) APPSw,Ind Tg mice were immnuolabeled with IbaI and quantitatively analyzed for individual microglial morphology compared with 3-, 9-, and 21-month-old WT mice. (A) A representative image of IbaI+ microglial cell from a 9-month-old APPSw,Ind Tg mouse, generated by the Simple Neurite Tracer plug-in. Arrows indicate aberrant twisted processes. (B–F) Morphometric parameters were analyzed with the L-measure software based on IbaI staining in 3- (three mice; n = 15) and 9-month-old (three mice; n = 10) APPSw,Ind Tg mice and WT mice aged 3 (three mice; n = 10 cells), 9 (five mice, n = 14 cells) and 21 (three mice; n = 8 cells) months. To compare the groups, data were first normalized to 3-month-old WT mice. Graphs show means of percent change ± SEM of the number (#) of bifurcations (B), number of branches (C), total branch length (D), tree area (E), and volume coverage of individual microglia cells (F). (G-H) Sholl’s analysis indicating the number of microglial processes crossing concentric circles drawn at 5-μm intervals around Aβ plaques (a star marks the plaque center) in APPSw,Ind Tg mice, or an arbitrary location in the cortex of WT mice (aged 3, 9, and 21 months). A representative illustration of the modified Sholl’s analysis for APPSw,Ind Tg mice is shown in G. For clarity, only a fraction of the circles is shown. Data were analyzed by a one-way Tukey’s ANOVA. *P < 0.05; **P < 0.01, ***P < 0.001. Bar represents 10 μm.
Figure 4
Figure 4
The spatial coverage area of microglia is reduced during aging and in a mouse model of Alzheimer’s disease (AD). Brain sections were taken from WT mice aged 3, 9, and 21 months and from two different AD mouse models, namely the APPSw,Ind (9 months old) and the amyloid precursor proteins (APP)/PS1 (15 months old) Tg mice, and immunolabeled with anti-IbaI. (A) Confocal z-stack images showing microglia process densities. To classify microglia, gray level, maximum z-projection images were generated and then set to eliminate background based on intensity threshold (upper panels). A heat map visualizing microglia process densities (lower panels) was then generated with the 3D Surface Plot plug-in bundled with FIJI software. Areas highly condensed with microglial processes appear in blue-purple, and areas vacant of microglia processes appear in red-yellow. Bars represent 50 μm. (B–E) Spatial coverage of microglia was performed by grid analysis. Grid analysis was performed by opening a grid of 32*32 squares (each square is 25 μm2) on top of a skeletonized image (see a zoom-in image of the grid in panel B). The total calculated length of processes in each square of the grid is presented as a distribution histogram with binning of 1 μm for 3-, 9-, and 21-month-old mice (C) and for APPSw,Ind and, APP/PS1 Tg mice compared with 3-month-old APPSw,Ind Tg mice (D). The length of processes per 1 square of a grid was calculated for each mouse (WT, 3 months n = 3; all other groups n = 5) and averaged for each group. Data were then analyzed by a one-way Tukey’s ANOVA. *P < 0.05; **P < 0.01, ***P < 0.001 (E).
Figure 5
Figure 5
Microglial expression of CD39 is altered in mouse models of Alzheimer’s disease. IbaI and CD39 IHC analyses were performed on brain sections from young, old, and amyloid precursor proteins (APP) Tg mice as described in Experimental procedures. (A, B) Representative z-stack images of WT (aged 3 months) and APPsw,Ind Tg mice (aged 9 months), showing IbaI+ cells (Aa, Ba; green), CD39+ cells (Ab, Bb; red), and the merge images (Ac, Bc) in the cortex. Arrows in Bc point to cells classified as CD39high (C1), CD39+ (C2), and CD39low (C3). (C1–C3) Enlargement of cells depicted in Bc. Cells shown in C1 were traced with Simple Neurite Tracer plug-in followed by process ‘filling’ as detailed in Experimental procedures. (C) Representative z-stack images of APPsw,Ind Tg mice showing cells stained for CD68 (Ca), CD39 (Cb), and merge image (Cc). (D) Representative z-stack images of APPsw,Ind Tg mice stained for CD11b (Da), CD39 (Db), and merge image (Dc). (E) Graph showing CD39 mean fluorescent intensity (MFIs) of IbaI+ cells in images taken from 3- and 21-month-old WT mice and APPSw,Ind (aged 9 months), and APP/PS1 (aged 15 months) Tg mice. Average MFIs were calculated for each experimental group and analyzed by a one-way Tukey’s ANOVA. **P < 0.01, ***P < 0.001. Percent of CD39low and CD39high cells among the CD39+ population was evaluated based on CD39 fluorescence intensity levels. Lower and upper thresholds (horizontal broken lines) were set according to 3-month-old WT mice. (F) A 3-D image of APPsw,Ind stained for IbaI+ cells in the vicinity of Aβ plaques reconstructed with Simple Neurite Tracer plug-in and viewed with 3D Viewer (FIJI software). Three IbaI+ cell populations, distinct by their morphology appearance, are depicted in the image: 1st layer of amoeboid cells (yellow); 2nd layer of cells with enlarged cytoplasm and reduced morphological complexity (light blue); and 3rd layer of ramified cells with reduced morphological complexity (white). Counter staining with TO-PRO-3 appears in dark blue.
Figure 6
Figure 6
CD39high cells in amyloid precursor proteins (APP)/PS1 Tg mice have increased expression of CD11b and CD45. (A) Flow cytometry profiles showing CD39 expression by CD11b+CD45+ gated cells in 21-month-old WT and APP/PS1 Tg mice. Cell populations were defined based on fluorescence levels in isotype-stained control (left panel) and identified throughout the figure as CD39 (black), CD39+ (red), and CD39high (purple). Quantification of FACS data showing %CD39+ among CD11b+CD45+ cells (B) and CD39 mean fluorescent intensity (MFI) (C) in WT and APP/PS1 Tg mice. (D) Percent CD39high cells among CD39+ cells. (E) Numbers of CD39+ and CD39high CD11b+CD45+ cells in WT and APP/PS1 Tg mice. (F) CD45/CD11b plots from WT and APP/PS1 Tg mice at 4 and 21 months of age, with CD39 subpopulations identified by multicolor gating, as defined above. CD11b (G) and CD45 (H) MFIs among CD39+ cells in WT and APP/PS1 Tg mice. *P < 0.05, **P < 0.01.

References

    1. Abutbul S, Shapiro J, Szaingurten-Solodkin I, Levy N, Carmy Y, Baron R, Jung S, Monsonego A. TGF-beta signaling through SMAD2/3 induces the quiescent microglial phenotype within the CNS environment. Glia. 2012;60:1160–1171. - PubMed
    1. Babcock AA, Wirenfeldt M, Holm T, Nielsen HH, Dissing-Olesen L, Toft-Hansen H, Millward JM, Landmann R, Rivest S, Finsen B, Owens T. Toll-like receptor 2 signaling in response to brain injury: an innate bridge to neuroinflammation. J. Neurosci. 2006;26:12826–12837. - PMC - PubMed
    1. Benilova I, Karran E, De Strooper B. The toxic Abeta oligomer and Alzheimer’s disease: an emperor in need of clothes. Nat. Neurosci. 2012;15:349–357. - PubMed
    1. Braun N, Sevigny J, Robson SC, Enjyoji K, Guckelberger O, Hammer K, Di Virgilio F, Zimmermann H. Assignment of ecto-nucleoside triphosphate diphosphohydrolase-1/cd39 expression to microglia and vasculature of the brain. Eur. J Neurosci. 2000;12:4357–4366. - PubMed
    1. Bulavina L, Szulzewsky F, Rocha A, Krabbe G, Robson SC, Matyash V, Kettenmann H. NTPDase1 activity attenuates microglial phagocytosis. Purinergic Signalling. 2013;9:199–205. - PMC - PubMed

Publication types

MeSH terms