. 2014 Mar 19:7:19.
doi: 10.1186/1756-6606-7-19.

Identification of transcriptional regulatory elements for Ntng1 and Ntng2 genes in mice

Affiliations

Identification of transcriptional regulatory elements for Ntng1 and Ntng2 genes in mice

Kunio Yaguchi et al. Mol Brain. .

Abstract

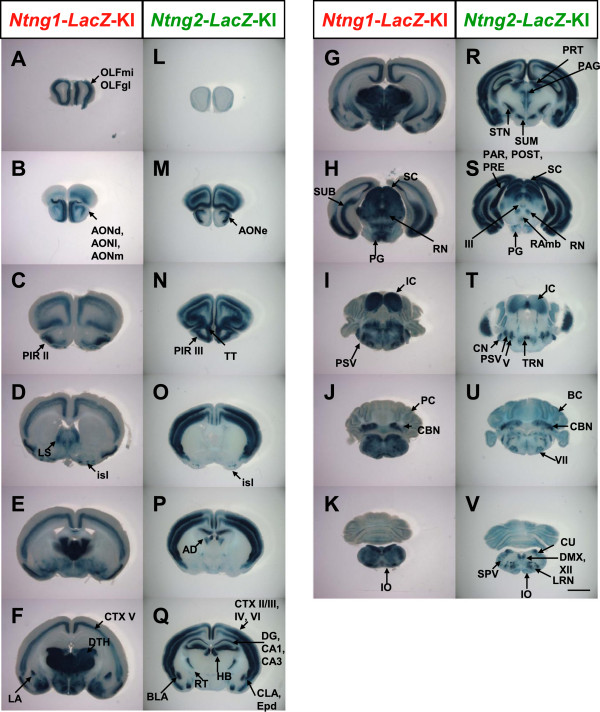
Background: Higher brain function is supported by the precise temporal and spatial regulation of thousands of genes. The mechanisms that underlie transcriptional regulation in the brain, however, remain unclear. The Ntng1 and Ntng2 genes, encoding axonal membrane adhesion proteins netrin-G1 and netrin-G2, respectively, are paralogs that have evolved in vertebrates and are expressed in distinct neuronal subsets in a complementary manner. The characteristic expression patterns of these genes provide a part of the foundation of the cortical layer structure in mammals.

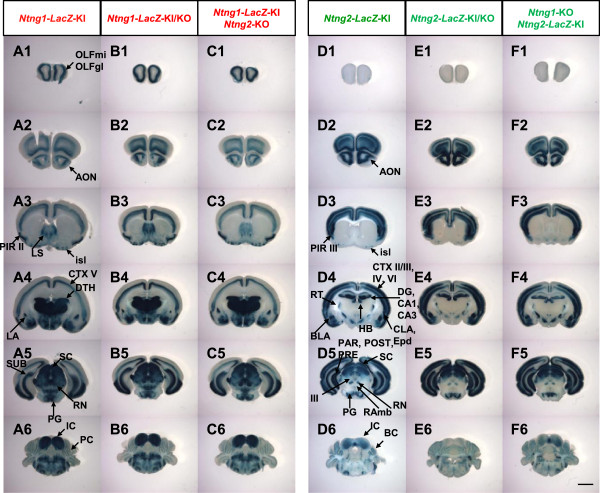
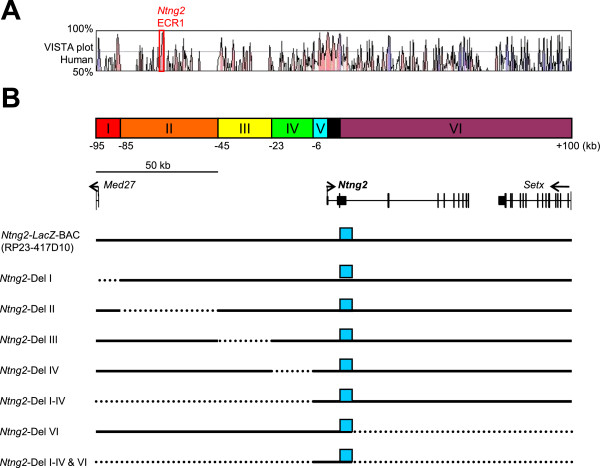
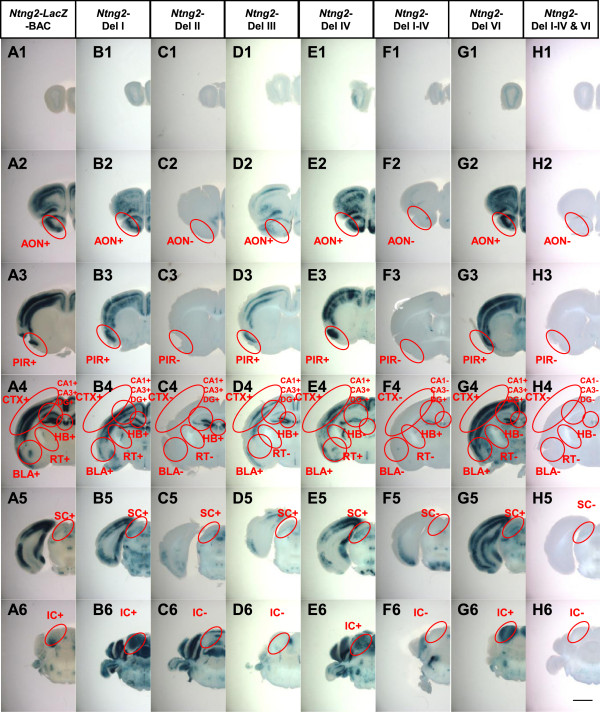
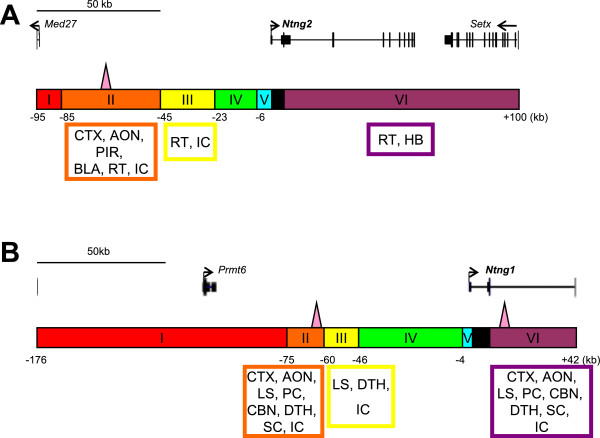
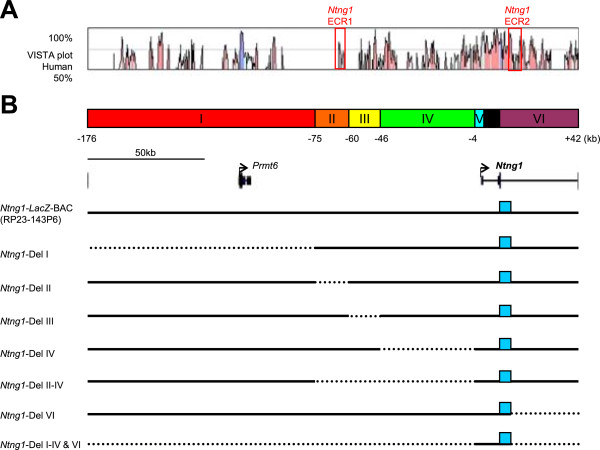
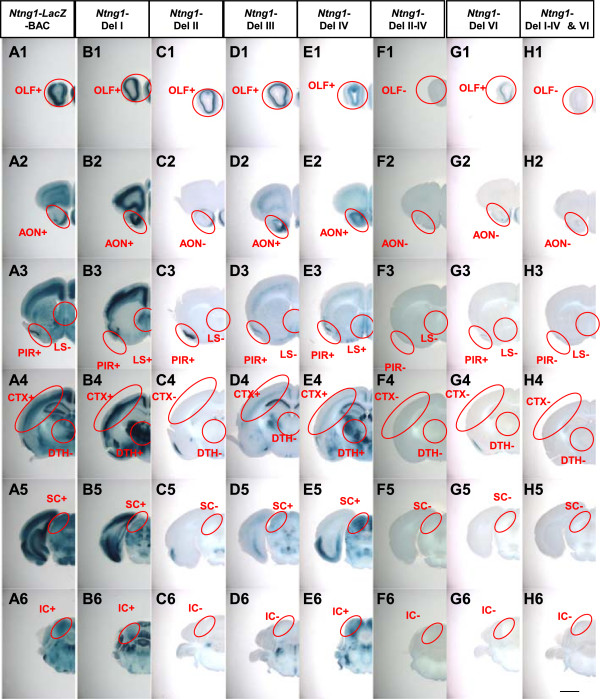
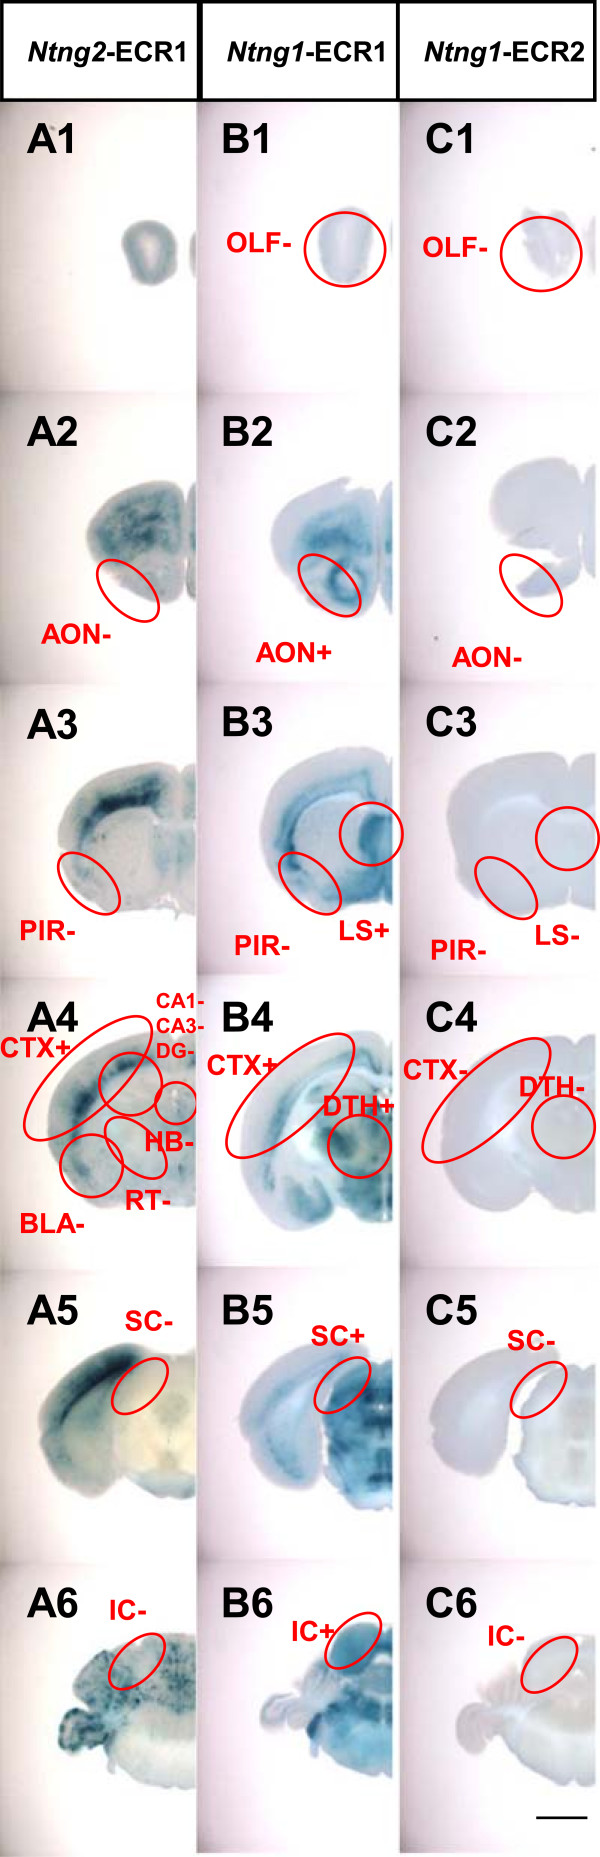
Results: We used gene-targeting techniques, bacterial artificial chromosome (BAC)-aided transgenesis techniques, and in vivo enhancer assays to examine transcriptional mechanisms in vivo to gain insight into how the characteristic expression patterns of these genes are acquired. Analysis of the gene expression patterns in the presence or absence of netrin-G1 and netrin-G2 functional proteins allowed us to exclude the possibility that a feedback or feedforward mechanism mediates their characteristic expression patterns. Findings from the BAC deletion series revealed that widely distributed combinations of cis-regulatory elements determine the differential gene expression patterns of these genes and that major cis-regulatory elements are located in the 85-45 kb upstream region of Ntng2 and in the 75-60 kb upstream region and intronic region of Ntng1. In vivo enhancer assays using 2-kb evolutionarily conserved regions detected enhancer activity in the distal upstream regions of both genes.

Conclusions: The complementary expression patterns of Ntng1 and Ntng2 are determined by transcriptional cis-regulatory elements widely scattered in these loci. The cis-regulatory elements characterized in this study will facilitate the development of novel genetic tools for functionally dissecting neural circuits to better understand vertebrate brain function.


Figures

Figure 1
Figure 1
X-gal staining of Ntng1- and Ntng2-LacZ-KI mouse brains. (A–K) X-gal staining of Ntng1-LacZ-KI mouse brains. (L–V) X-gal staining of Ntng2-LacZ-KI mouse brains. Coronal slices (400 μm) at P21 were stained with X-gal staining solution. In panels A–K and L–V, the stained sections are arranged from anterior to posterior. AD, anterodorsal nucleus of the thalamus; AON, anterior olfactory nucleus; BC, Bergmann glia cells; BLA, basolateral amygdala nucleus; CA1, cornu ammonis 1 field of the hippocampus; CA3, cornu ammonis 3 field of the hippocampus; CBN, cerebellar nuclei; CLA, claustrum; CN, cochlear nuclei; CTX, cerebral cortex; CU, cuneate nucleus; DG, dentate gyrus; DMX, dorsal motor nucleus of the vagus nerve; DTH, dorsal thalamus; ENT, entorhinal area; Epd, endopiriform nucleus, dorsal part; HB, habenula; IC, inferior colliculus; isl, olfactory tubercle; Islands of Calleja; IO, inferior olivary complex; LA, lateral amygdala nucleus; LRN, lateral reticular nucleus; LS, lateral septal nucleus; OLFgl, olfactory bulb, glomerular layer; OLFmi, olfactory bulb, mitral layer; PAG, periaqueductal gray, dorsal division; PC, Purkinje cell; PIR, piriform area; PG, pontine gray; PRT, pretectal region; PSV, principal sensory nucleus of the trigeminal; RAmb, midbrain raphe nuclei; RN, red nucleus; RT, reticular nucleus of the thalamus; SC, superior colliculus; SPV, spinal nucleus of the trigeminal; STN, subthalamic nucleus; SUB, subiculum; SUM, supramammillary nucleus; TRN, tegmental reticular nucleus; TT, taenia tecta; III, oculomotor nucleus; V, trigeminal motor nucleus; VII, facial motor nucleus; XII, hypoglossal nucleus. Scale bar: 2.0 mm for all panels.
Figure 2
Figure 2
LacZ staining in the brains of Ntng1- and Ntng2- KI/KO mice. (A)LacZ staining of Ntng1(LacZ/+) mouse brain. (B)LacZ staining of Ntng1(LacZ/GFP) mouse brain. This mouse lacked netrin-G1. (C)LacZ staining of Ntng1(LacZ/+) and Ntng2(−/−) mouse brain. (D)LacZ staining of Ntng2(LacZ/+) mouse brain. (E)LacZ staining of Ntng2(LacZ/-) mouse brain. (F)LacZ staining of Ntng1(GFP/GFP) and Ntng2(LacZ/+) mouse brain. Coronal slices (400 μm) at P21 were stained with X-gal solution. The panels are arranged from anterior (Top) to posterior (Bottom). Scale bar: 2.0 mm for all panels.
Figure 3
Figure 3
Highly conserved sequences in Ntng2 loci and strategy for analyzing cis-regulatory elements in transgenic mice. (A) Comparative genomic analysis of the mouse Ntng2-BAC sequence (mouse Dec. 2011 [GRCm38/mm10] assembly; chr2: 29,153,280-29,347,847) by the VISTA genome browser [ http://genome.lbl.gov/vista/index.shtml] [32]. Percent nucleotide identities between mouse and human DNA sequences were plotted as a function of the position along the mouse sequence. Peaks of evolutionary conserved exons of Ntng2 and neighboring genes are shaded blue. Aligned regions with more than 70% identity over 100 bases are shaded pink. (B) Schematic diagrams of the Ntng2 deletion series. The Ntng2-BAC sequences are divided into 6 segments (I–VI indicated in colored boxes) along with ECR distribution. Genomic organizations of the mouse Ntng2 and neighbor gene loci are indicated. Short vertical lines indicate positions of exons and arrowheads indicate transcriptional directions. Broken and solid lines represent deleted and preserved regions in the BAC constructs, respectively. Blue boxes on the lines represent the reporter LacZ cassette inserted in each BAC construct. Note that the reporter LacZ cassette, ECRs, and minimal promoter sequences are not represented in accurate scales.
Figure 4
Figure 4
LacZ reporter expression profiles in the Ntng2-BAC deletion series. Brains from transgenic mice at P21 carrying Ntng2-BAC-LacZ (column A), Ntng2-Del I (B), II (C), III (D), IV (E), I–IV (F), VI (G), and I–IV&VI (H) reporter constructs were sliced at 400 μm and stained for LacZ activity. Images of the stained slices are arranged from anterior (Top) to posterior (Bottom). Red circles indicate the regions evaluated for LacZ activity. Abbreviations of the brain regions are the same as those in Figure  1. The (+) and (−) symbols indicate that the given construct induced expression of LacZ at a frequency over the criterion (50% of transgenic founders) or not. Scale bar: 2.0 mm for all panels.
Figure 5
Figure 5
Summary of regulatory regions required for Ntng1 and Ntng2 expression. Genomic organization and genomic segments I–VI along with Ntng2(A) and Ntng1(B) gene organization are shown. Brain regions positively regulated by the genomic segments are indicated within the designated colored boxes at the bottom. The locations of Ntng1 and Ntng2 enhancers identified are indicated by pink triangles. The combinations of cis-elements that locate distantly and widely from the TSS determine differential expression patterns of the vertebrate-specific paralogs, Ntng1 and Ntng2.
Figure 6
Figure 6
Highly conserved sequences in Ntng1 loci and strategy for analyzing cis-regulatory elements in transgenic mice. (A) Comparative genomic analysis of the mouse Ntng1-BAC clone (mouse Dec. 2011 [GRCm38/mm10] assembly; chr3:110,101,082 -110,318,433) by the VISTA genome browser. Percent nucleotide identities between mouse and human DNA sequences were plotted as a function of the position along the mouse sequence. Peaks of evolutionary-conserved exons of Ntng1 and neighboring genes are shaded blue. Aligned regions with more than 70% identity over 100 bases are shaded pink. (B) Schematic diagrams of the Ntng1 deletion series. The Ntng1-BAC sequences are divided into 6 segments (I–VI indicated in colored boxes) along with ECR distribution. Genomic organizations of the mouse Ntng1 and neighbor gene loci are indicated. Short vertical lines indicate positions of exons and arrowheads indicate transcriptional directions. Broken and solid lines represent deleted and preserved regions in the BAC constructs, respectively. Blue boxes on the lines represent the reporter LacZ cassette inserted in each BAC construct. Note that the reporter LacZ cassette, ECRs, and minimal promoter sequences are not represented in accurate scales.
Figure 7
Figure 7
LacZ reporter expression profiles in the Ntng1-BAC deletion series. Brains from transgenic mice at P21 carrying Ntng1-BAC-LacZ (column A), Ntng1-Del I (B), II (C), III (D), IV (E), II–IV (F), VI (G), and I–IV&VI (H) reporter constructs were sliced at 400 μm and stained for LacZ activity. Images of the stained slices are arranged from anterior (Top) to posterior (Bottom). Red circles indicate the regions evaluated for LacZ activity. Abbreviations of the brain regions are the same as those in Figure  1. The (+) and (−) symbols indicate that the given construct-induced expression of LacZ at the frequency over the criterion (50% of transgenic founders) or not. Scale bar: 2.0 mm for all panels.
Figure 8
Figure 8
LacZ reporter expression profiles in the Ntng1 and Ntng2 enhancer assays. Brains from transgenic mice at P21carrying Ntng2-ECR1 (A column), Ntng1-ECR1 (B), and Ntng1-ECR2 (C) reporter constructs were sliced at 400 μm and stained for LacZ activity. Images of the stained slices are arranged from anterior (Top) to posterior (Bottom). Red circles guide the regions evaluated for LacZ activity. Abbreviations of the brain regions are the same as those in Figure  1. The (+) and (−) symbols indicate that the given construct-induced expression of LacZ at the frequency over the criterion (50% of transgenic founders) or not. Scale bar: 2.0 mm for all panels.

Similar articles

Cited by

References

    1. Lewis DA, Sweet RA. Schizophrenia from a neural circuitry perspective: advancing toward rational pharmacological therapies. J Clin Invest. 2009;119:706–716. doi: 10.1172/JCI37335. - DOI - PMC - PubMed
    1. Walsh CA, Morrow EM, Rubenstein JL. Autism and brain development. Cell. 2008;135:396–400. doi: 10.1016/j.cell.2008.10.015. - DOI - PMC - PubMed
    1. Lettice LA, Heaney SJ, Purdie LA, Li L, de Beer P, Oostra BA, Goode D, Elgar G, Hill RE, de Graaff E. A long-range Shh enhancer regulates expression in the developing limb and fin and is associated with preaxial polydactyly. Hum Mol Genet. 2003;12:1725–1735. doi: 10.1093/hmg/ddg180. - DOI - PubMed
    1. Nakashiba T, Ikeda T, Nishimura S, Tashiro K, Honjo T, Culotti JG, Itohara S. Netrin-G1: a novel glycosyl phosphatidylinositol-linked mammalian netrin that is functionally divergent from classical netrins. J Neurosci. 2000;20:6540–6550. - PMC - PubMed
    1. Nakashiba T, Nishimura S, Ikeda T, Itohara S. Complementary expression and neurite outgrowth activity of netrin-G subfamily members. Mech Dev. 2002;111:47–60. doi: 10.1016/S0925-4773(01)00600-1. - DOI - PubMed

Publication types