. 2014 Mar 18:3:e02109.
doi: 10.7554/eLife.02109.

Long term functional plasticity of sensory inputs mediated by olfactory learning

Affiliations

Long term functional plasticity of sensory inputs mediated by olfactory learning

Nixon M Abraham et al. Elife. .

Abstract

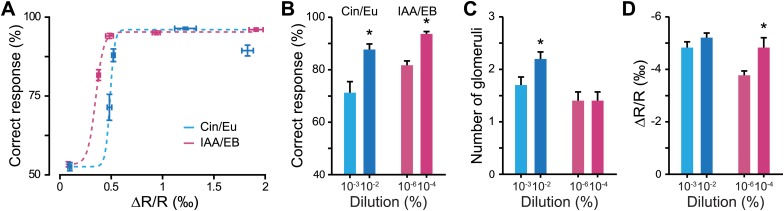
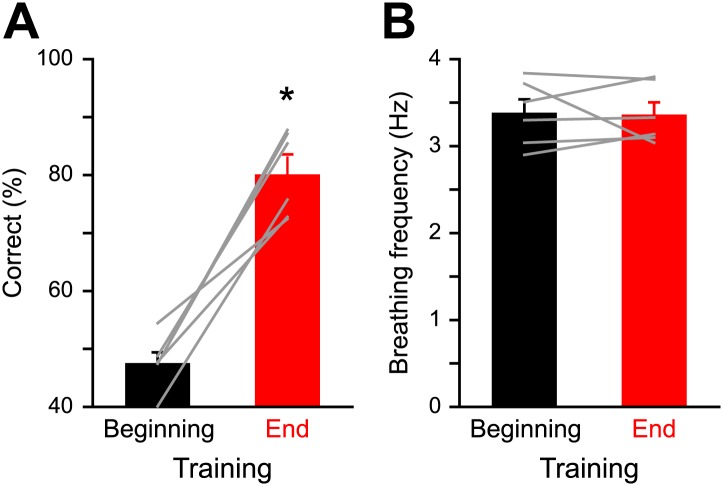
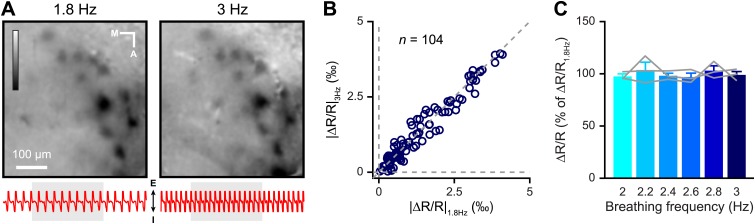
Sensory inputs are remarkably organized along all sensory pathways. While sensory representations are known to undergo plasticity at the higher levels of sensory pathways following peripheral lesions or sensory experience, less is known about the functional plasticity of peripheral inputs induced by learning. We addressed this question in the adult mouse olfactory system by combining odor discrimination studies with functional imaging of sensory input activity in awake mice. Here we show that associative learning, but not passive odor exposure, potentiates the strength of sensory inputs up to several weeks after the end of training. We conclude that experience-dependent plasticity can occur in the periphery of adult mouse olfactory system, which should improve odor detection and contribute towards accurate and fast odor discriminations. DOI: http://dx.doi.org/10.7554/eLife.02109.001.

Keywords: behavior; imaging; sensory perception.


Conflict of interest statement

The authors declare that no competing interests exist.

Figures

Figure 1.
Figure 1.. Experimental design used to assess plasticity of sensory inputs in the mouse OB.
(A and B) Mice are first trained to discriminate pairs of odorants in an automated olfactometer. At the end of the training, odorants evoked input patterns are monitored on the dorsal OB of awake mice using intrinsic optical signal imaging. (C) Timetable of the go/no-go olfactory training for different odorants at different dilutions and then followed by imaging (Trained group). (D) Two other groups of mice have been imaged for comparison. Several mice have been passively exposed to the different odorants used for the training and for the same amount of time (Exposed group). A third group of mice that never experienced the odorants served as control (Naïve group). DOI: http://dx.doi.org/10.7554/eLife.02109.003
Figure 2.
Figure 2.. Defining odor discrimination threshold using wide range of odorant dilutions.
(A) Discrimination accuracy shown as the average percentage of correct choices for different odorants over wide range of dilutions (n = 7 and 11 mice for Cin/Eu and IAA/EB tasks, respectively). The population of mice showed a tendency for learning to discriminate Cin/Eu from 10−3 onwards and IAA/EB from 10−6 onwards [*: Fisher’s Least Significant Difference (LSD) test at least p<0.005]. Data are presented as mean ± SEM. (B and C) Discrimination accuracy measured on the last 300 trials for different dilutions of Cin/Eu and IAA/EB. (D and E) Reaction time (RT) measured on the same trials as in (B and C). Data are presented as box plots showing the median in gray. Whiskers represent the maximum and minimum values of the dataset. DOI: http://dx.doi.org/10.7554/eLife.02109.004
Figure 3.
Figure 3.. Functional plasticity of sensory inputs to the olfactory bulb induced by olfactory learning.
(A and B) Intrinsic optical signal (IOS) imaging of activated glomeruli patterns evoked by different dilutions of Cin/Eu in different groups of mice (trained, naïve and exposed). For each odorant and group, all images for the different dilutions are from the same mouse. For the scale in (A) and (B), respectively, min ΔR/R (‰) = −2 and −2.5, max ΔR/R (‰) = 1.5 and 2. The magenta arrows highlight that more strongly activated glomeruli are visible in the trained mice at lower dilutions. (C) The average number of glomeruli activated by all odorants at higher dilutions (10−3 and 10−2 for Cin/Eu, 10−6 and 10−4 for IAA/EB) is significantly higher in the trained group (T., n = 5 mice; LSD test between T. and N. or E.: p<0.001) than in the naïve (N., n = 5 mice) or exposed (E., n = 5 mice; LSD test between E. and N. p=0.5) groups. (D and E) IOS imaging of the activated glomeruli patterns evoked by different dilutions of IAA/EB. (F) The average number of glomeruli activated by all odorants at lower dilutions (10−1 and 100 for Cin/Eu, 10−2 and 100 for IAA/EB) is similar for all groups (for all comparisons, LSD test p>0.1). For the scale in (D) and (E), respectively, min ΔR/R (‰) = −3.5 and −3, max ΔR/R (‰) = 3 and 2.5. Values are represented as mean ± SEM. DOI: http://dx.doi.org/10.7554/eLife.02109.005
Figure 4.
Figure 4.. Functional plasticity induced by olfactory learning is long lasting and independent of the reward value of odorants.
(AD) Quantification of the average change in reflectance (ΔR/R) in the glomeruli activated by different odorants and dilutions (n = 5 mice for all groups, * indicates LSD test p<0.001). (E) Cumulative distributions of amplitudes of the evoked activity in all glomeruli analyzed in all trained (n = 512 regions of interest), naïve (n = 431) and exposed (n = 427) mice. A significant [Kolmogorov–Smirnov (K.S.) test] increase in amplitude is observed for the population of glomeruli recorded in the trained group. (F-G) In the trained group, no difference in response amplitude was observed between glomeruli activated by different odorants belonging to different chemical classes (F) or between glomeruli activated by rewarded and non-rewarded odorants (G). (H and I) The training is potentiating the input strength for several weeks. All values have been normalized to the average amplitude calculated in the naïve group. *: LSD test between trained and other groups at least p<0.002. DOI: http://dx.doi.org/10.7554/eLife.02109.006
Figure 5.
Figure 5.. Discrimination accuracy around discrimination threshold is dependent on input strength.
(A) Plots showing the relationship between the average input strength monitored by IOS imaging and the discrimination accuracy at different concentrations for different odor pairs. The dotted lines represent Boltzmann function fits in the distributions of points (Boltzmann fit, R2 > 0.95, F = 511.34, ANOVA p<0.032). (B) Discrimination accuracy for odorant concentrations close to discrimination threshold. *: Paired t test: 10−3 vs 10−2 Cin/Eu, p<0.01 and 10−6 vs 10−4 IAA/EB, p<0.01. (C) Average number of activated glomeruli for odorant concentrations close to discrimination threshold. *: Paired t test: 10−3 vs 10−2 Cin/Eu, p<0.05 and 10−6 vs 10−4 IAA/EB, p>0.1. (D) Quantification of the average change in reflectance (ΔR/R) in the glomeruli activated by odorants at concentrations close to discrimination threshold. *: Paired t test: 10−3 vs 10−2 Cin/Eu, p>0.1 and 10−6 vs 10−4 IAA/EB, p<0.01. DOI: http://dx.doi.org/10.7554/eLife.02109.007
Figure 6.
Figure 6.. Respiration behavior is not altered by olfactory discrimination learning.
(A) Performance levels shown by mice at the beginning (black, 300 trials averaged) and at the end of a discrimination training task (red, 300 trials averaged) with Cineol and Eugenol (*paired t test, p<0.001, n = 6 mice). (B) Average respiration frequency from the respective training blocks in (A). Sniff frequency remained unaltered during different learning epochs (*paired t test, p=0.8, n = 6 mice). Values are represented as mean ± SEM. DOI: http://dx.doi.org/10.7554/eLife.02109.008
Figure 7.
Figure 7.. Odor-evoked intrinsic signals are independent of change in breathing frequency.
(A) Single trial map of the amyl acetate-evoked activity reported by IOS when the mouse is breathing at 1.8 (left) and 3 Hz (right). LUT: −0.003 to 0.003. The respiration pattern recorded during each trial is shown below each image (I: inspiration, E: expiration); the light gray vertical bar represents odor presentation (5 s). (B) Average values of glomerular response amplitude (ΔR/R) at 1.8 Hz, plotted against amplitudes at 3 Hz (Wilcoxon signed-rank test, n = 104 glomeruli from three mice, p=0.2945). (C) Average values of glomerular response amplitude at different breathing frequencies (2, 2.2, 2.4, 2.6, 2.8 and 3 Hz). Values are normalized relative to responses recorded at 1.8 Hz (Repeated measure one-way ANOVA, n = 3 mice, F = 0.4499, p=0.6505). Values are represented as mean ± SEM. DOI: http://dx.doi.org/10.7554/eLife.02109.009

References

    1. Abraham NM, Egger V, Shimshek DR, Renden R, Fukunaga I, Sprengel R, Seeburg PH, Klugmann M, Margrie TW, Schaefer AT, Kuner T. 2010. Synaptic inhibition in the olfactory bulb accelerates odor discrimination in mice. Neuron 65:399–411. 10.1016/j.neuron.2010.01.009 - DOI - PMC - PubMed
    1. Abraham NM, Guerin D, Bhaukaurally K, Carleton A. 2012. Similar odor discrimination behavior in head-restrained and freely moving mice. PLOS ONE 7:e51789. 10.1371/journal.pone.0051789 - DOI - PMC - PubMed
    1. Abraham NM, Spors H, Carleton A, Margrie TW, Kuner T, Schaefer AT. 2004. Maintaining accuracy at the expense of speed: stimulus similarity defines odor discrimination time in mice. Neuron 44:865–876. 10.1016/j.neuron.2004.11.017 - DOI - PubMed
    1. Accolla R, Bathellier B, Petersen CCH, Carleton A. 2007. Differential spatial representation of taste modalities in the rat gustatory cortex. The Journal of Neuroscience 27:1396–1404. 10.1523/JNEUROSCI.5188-06.2007 - DOI - PMC - PubMed
    1. Accolla R, Carleton A. 2008. Internal body state influences topographical plasticity of sensory representations in the rat gustatory cortex. Proceedings of the National Academy of Sciences of the United States of America 105:4010–4015. 10.1073/pnas.0708927105 - DOI - PMC - PubMed

Publication types

LinkOut - more resources