. 2014 Apr;124(4):1853-67.
doi: 10.1172/JCI73531. Epub 2014 Mar 18.

IL-6R/STAT3/miR-34a feedback loop promotes EMT-mediated colorectal cancer invasion and metastasis

IL-6R/STAT3/miR-34a feedback loop promotes EMT-mediated colorectal cancer invasion and metastasis

Matjaz Rokavec et al. J Clin Invest. 2014 Apr.

Erratum in

Abstract

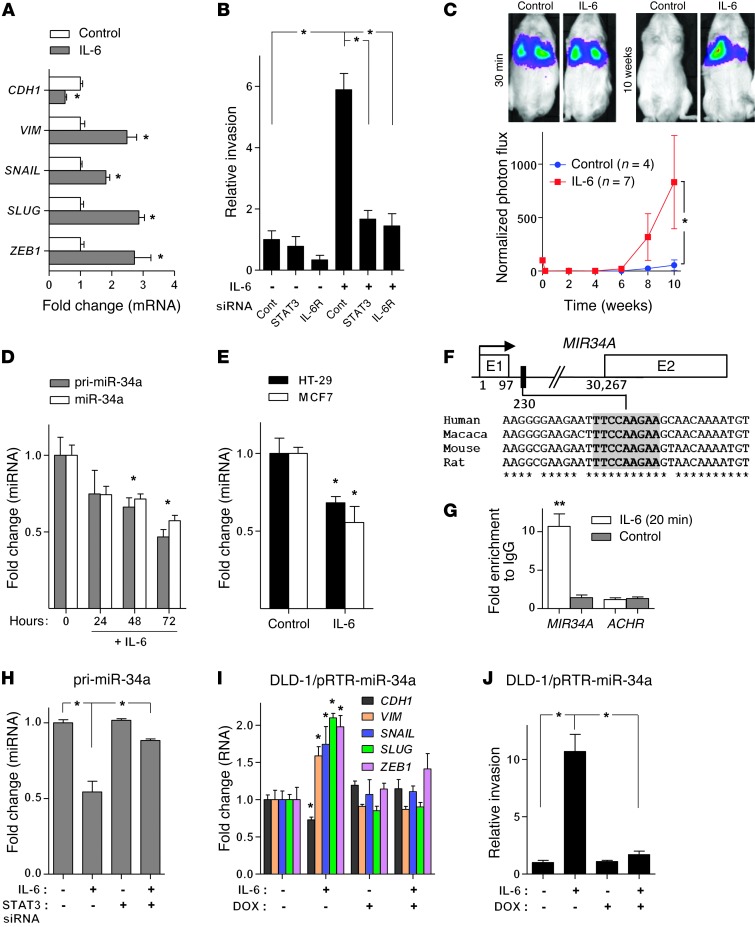
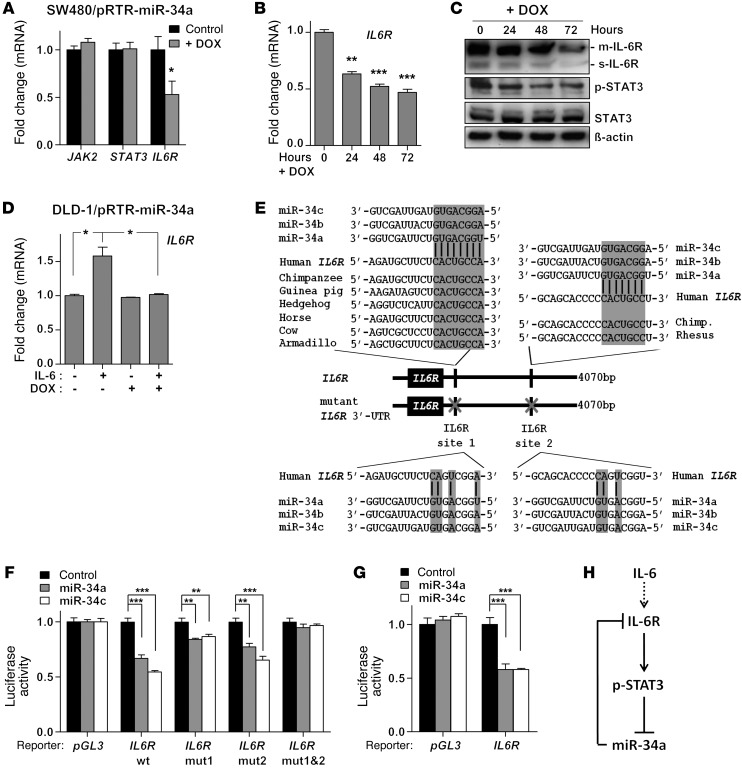
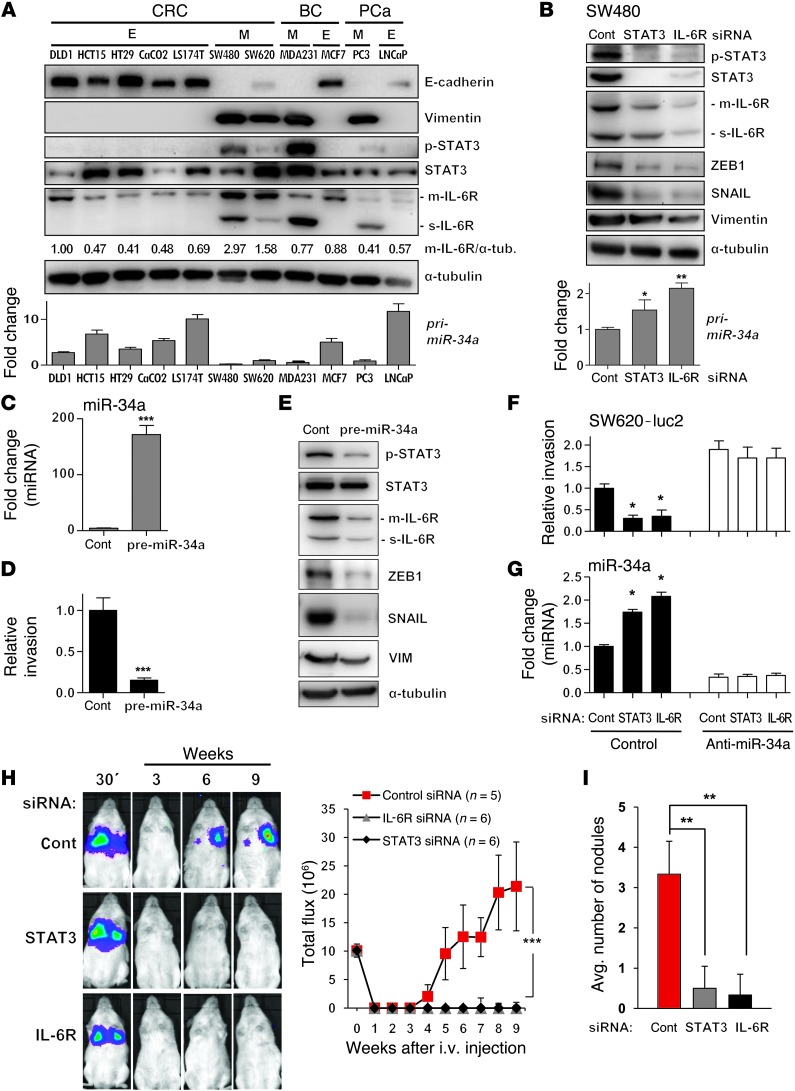
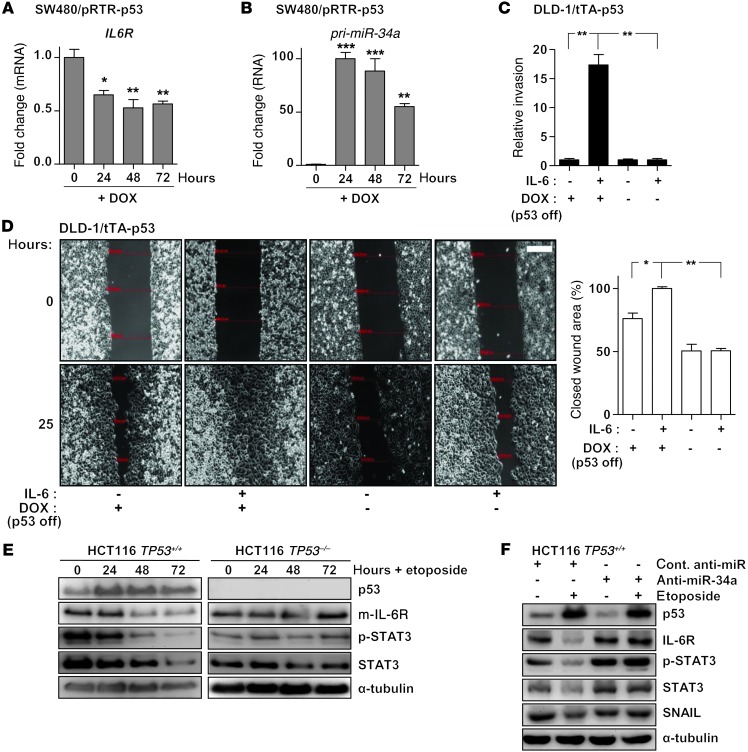
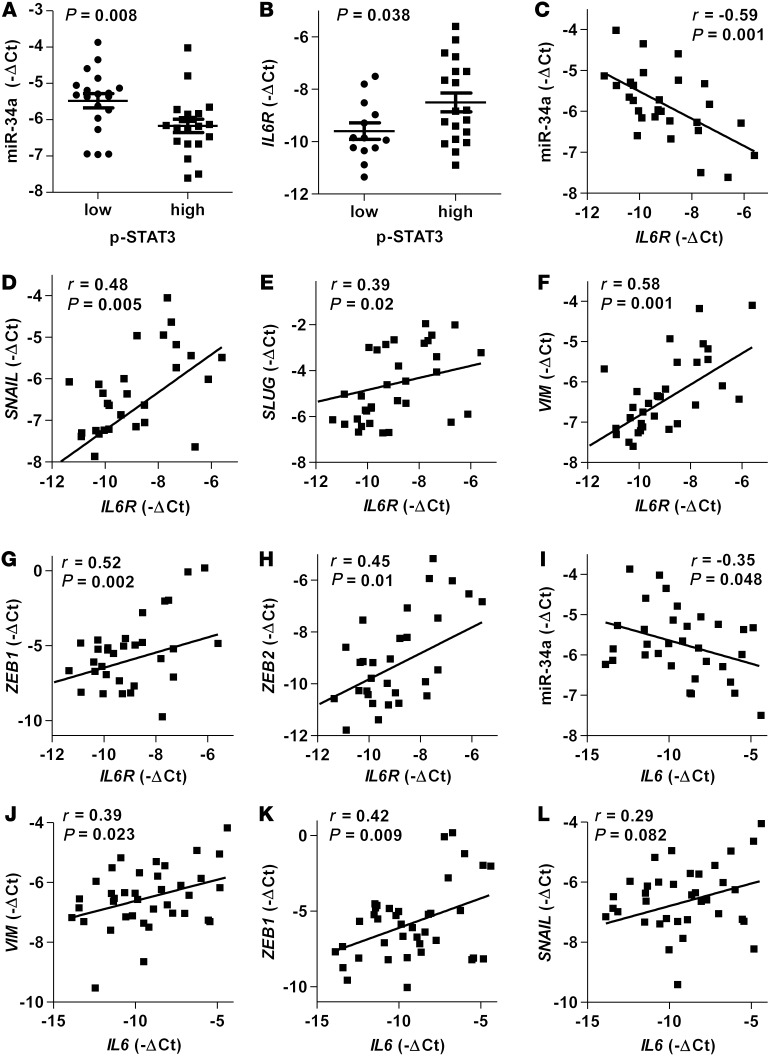
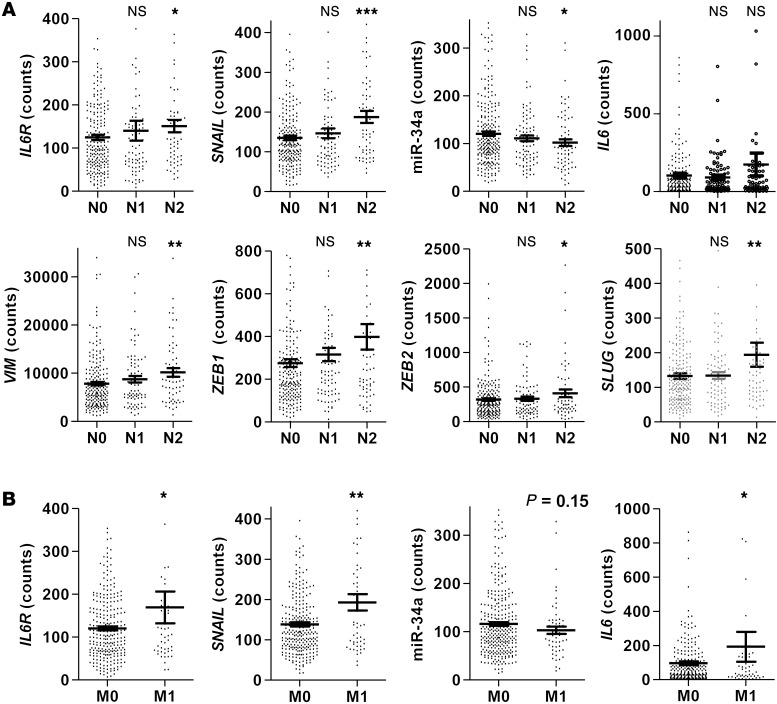
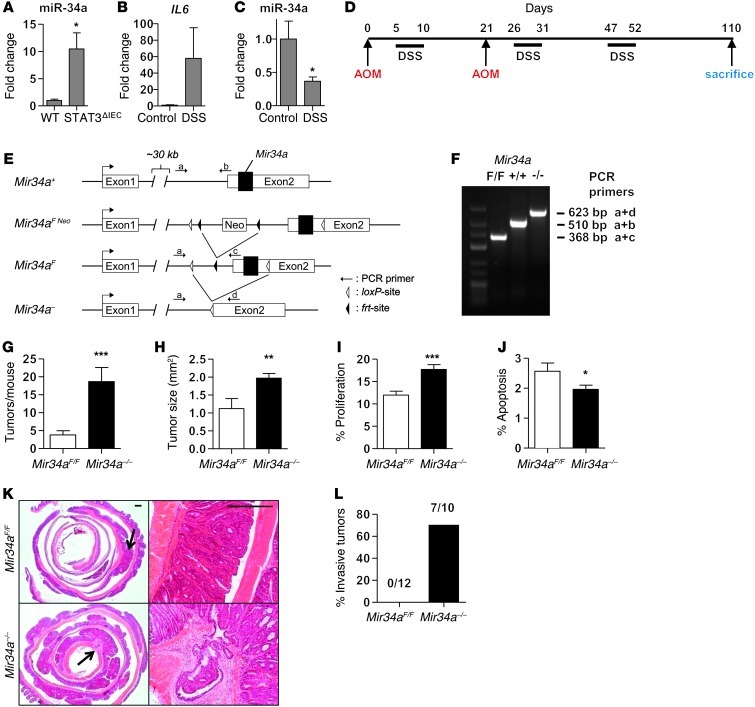
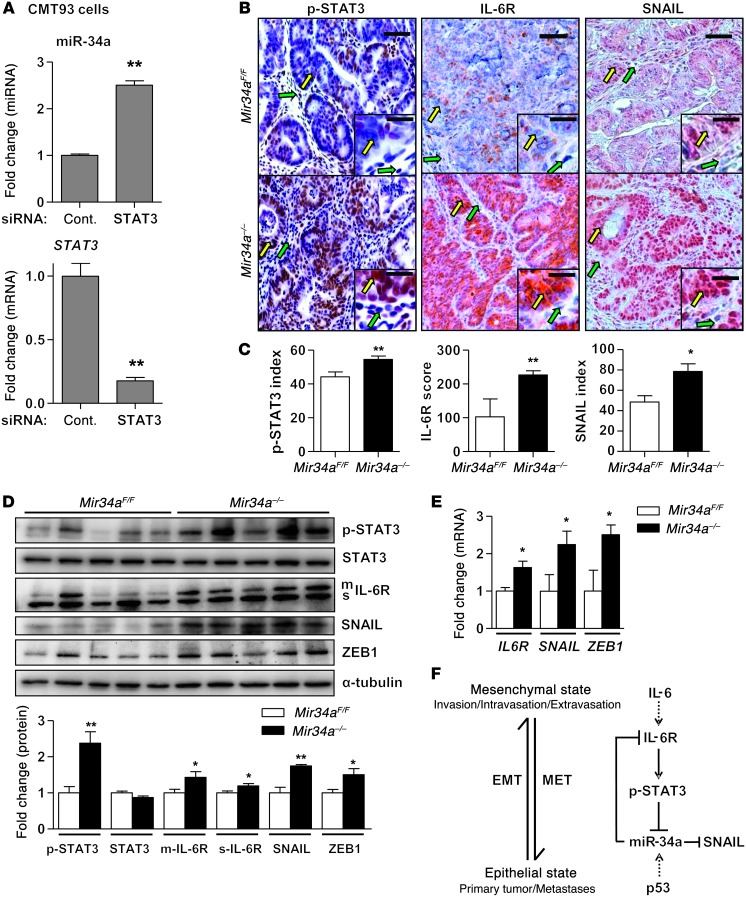
Members of the miR-34 family are induced by the tumor suppressor p53 and are known to inhibit epithelial-to-mesenchymal transition (EMT) and therefore presumably suppress the early phases of metastasis. Here, we determined that exposure of human colorectal cancer (CRC) cells to the cytokine IL-6 activates the oncogenic STAT3 transcription factor, which directly represses the MIR34A gene via a conserved STAT3-binding site in the first intron. Repression of MIR34A was required for IL-6-induced EMT and invasion. Furthermore, we identified the IL-6 receptor (IL-6R), which mediates IL-6-dependent STAT3 activation, as a conserved, direct miR-34a target. The resulting IL-6R/STAT3/miR-34a feedback loop was present in primary colorectal tumors as well as CRC, breast, and prostate cancer cell lines and associated with a mesenchymal phenotype. An active IL-6R/STAT3/miR-34a loop was necessary for EMT, invasion, and metastasis of CRC cell lines and was associated with nodal and distant metastasis in CRC patient samples. p53 activation in CRC cells interfered with IL-6-induced invasion and migration via miR-34a-dependent downregulation of IL6R expression. In Mir34a-deficient mice, colitis-associated intestinal tumors displayed upregulation of p-STAT3, IL-6R, and SNAIL and progressed to invasive carcinomas, which was not observed in WT animals. Collectively, our data indicate that p53-dependent expression of miR-34a suppresses tumor progression by inhibiting a IL-6R/STAT3/miR-34a feedback loop.


Figures

Figure 1
Figure 1. IL-6 induces EMT and invasion of CRC cells through direct repression of MIR34A by STAT3.
(A) qPCR analysis of indicated mRNAs in DLD-1 cells treated with IL-6 for 5 days. (B) Relative invasion of DLD-1 cells transfected with indicated siRNAs for 24 hours, followed by IL-6 treatment for 72 hours. (C) Formation of lung metastases by tail-vein injection of control and IL-6–treated (5 days) DLD-1–Luc2 cells in immunocompromised mice. Representative images of luciferase signals (upper panel). Normalized photon flux (lower panel). (D) qPCR analysis of primary (pri–miR-34a) and mature (miR-34a) miR-34a expression in DLD-1 cells treated with IL-6. (E) Expression of mature miR-34a in HT-29 CRC and MCF7 BC cells after treatment with IL-6 for 72 hours. (F) Map of the human MIR34A genomic region with the indicated phylogenetically conserved STAT3-binding site. (G) ChIP analysis of STAT3 occupancy at the human MIR34A and, as a control, the acetylcholine receptor (ACHR) locus in DLD-1 cells treated with vehicle or IL-6. (H) qPCR analysis of primary miR-34a in DLD-1 cells transfected with control or STAT3 siRNAs for 24 hours and subsequently treated with IL-6 for 72 hours. (I) qPCR analysis of indicated mRNAs in indicated cells, treated with IL-6 and DOX for 5 days. (J) Relative invasion of indicated cells treated with DOX for 24 hours and subsequently with IL-6 for 72 hours. Mean values ± SD (n = 3) are provided. *P < 0.05; **P < 0.01.
Figure 2
Figure 2. The IL6R mRNA is a direct target of miR-34.
(A) qPCR analysis of the indicated mRNAs 48 hours after addition of DOX. (B) qPCR analysis of IL6R mRNA expression after addition of DOX for indicated periods. (C) Western blot analysis of the indicated proteins after addition of DOX for indicated periods. (D) qPCR analysis of IL6R mRNA expression in DLD-1/pRTR–miR-34a cells after IL-6 and DOX treatment for 5 days. (E) Schematic representation of the IL6R 3′ UTR indicating the miR-34 seed-matching sequences, their phylogenetic conservation (upper part), and mutagenesis (lower part). (F and G) Dual reporter assay after transfection of H1299 cells with the indicated miRNA oligonucleotides with either (F) human or (G) murine IL6R 3′ UTR reporter constructs. (H) Schematic representation of the proposed IL-6R/STAT3/miR-34a feedback loop. Mean values ± SD (n = 3) are provided. *P < 0.05; **P < 0.01; ***P < 0.001.
Figure 3
Figure 3. The mesenchymal phenotype of cancer cell lines is associated with the IL-6R/STAT3/miR-34a loop.
(A) Expression of the indicated proteins and primary miRNAs in CRC, breast cancer (BC), and prostate cancer (PCa) cell lines exhibiting epithelial (E) or mesenchymal (M) phenotypes was determined by Western blot (upper panel) and qPCR analysis (lower panel). Relative densitometric quantifications of m–IL-6R protein normalized to α-tubulin are indicated. (B) Detection of protein and RNA expression 48 hours after transfection with the indicated siRNAs. (C, D, and E) Expression of miR-34a (C), invasion (D), and expression of indicated proteins (E) in SW480 cells transfected with control or pre–miR-34a oligonucleotides for 48 hours. (F) Relative invasion of SW620-luc2 cells transfected with STAT3- or IL-6R–specific siRNAs and miR-34a–specific antagomirs. (G) qPCR analysis of mature miR-34a in cells treated as in F. (H and I) SW620-luc2 cells were transfected with control, STAT3-, or IL-6R–specific siRNAs for 48 hours, subsequently injected into the tail vein of NOD/SCID mice, and followed by noninvasive bioluminescence imaging for 9 weeks. In H, the left panels show representative images and the graph shows the photon flux (right). Quantification of metastatic tumor nodules in the lung per mouse 9 weeks after tail-vein injection are shown (I). Mean values ± SD (n = 3) are provided. *P < 0.05; **P < 0.01; ***P < 0.001.
Figure 4
Figure 4. p53 disrupts the IL-6R/STAT3/miR-34a feedback loop by inducing miR-34a.
(A) qPCR analysis of IL6R expression after addition of DOX for indicated periods. (B) qPCR analysis of primary miR-34a expression after addition of DOX for indicated periods. (C) Invasion assay in a modified Boyden chamber. DLD-1/tTA-p53 cells were depleted of DOX for 24 hours to induce ectopic p53, subsequently treated with IL-6 for 72 hours, and then allowed to migrate through Matrigel-coated filter for 48 hours. (D) Wound healing assay: DLD-1/tTA-p53 cells were depleted of DOX for 24 hours and subsequently treated with IL-6 for 72 hours before a scratch in the monolayer of cells was generated. Representative photographs of the initial wound area and the same area 25 hours later are provided in left panel. Twenty-five hours after a scratch was generated, the width of 5 scratches in 2 independent wells was analyzed for each state. Results represent the average (%) of wound closure (right panel). Scale bar: 200 μm. (E) Western blot analysis of the indicated proteins in HCT116 TP53+/+ and HCT116 TP53–/– cells after addition of etoposide (20 μM) for indicated time periods. (F) Western blot analysis of HCT116 cells transfected with control or miR-34a–specific antagomirs for 24 hours, followed by addition of etoposide (20 μM) for 48 hours. Mean values ± SD (n = 3) are provided. *P < 0.05; **P < 0.01; ***P < 0.001.
Figure 5
Figure 5. The IL-6R/STAT3/miR-34a feedback loop is characteristic for primary CRC tumors with mesenchymal features.
(AL) Correlative analysis of the indicated mRNAs, miRNAs, and p-STAT3 in human colon tumors (n = 48). p-STAT3 was detected by immunohistochemistry, while expression of mRNAs and mature miR-34a was determined by qPCR. Mean values ± SEM are provided (A and B). Significance was calculated using the Student’s t test (A and B). Spearman correlation coefficient with the respective significance is indicated (CL).
Figure 6
Figure 6. Activation of the IL-6R/STAT3/miR-34a feedback loop is associated with lymph node and distant CRC metastasis.
(A) Associations of indicated genes with nodal status in the TCGA collection of human colon adenocarcinomas (n = 425). (B) Associations of indicated genes with metastasis status in the TCGA collection of human colon adenocarcinomas. Mean values ± SEM are provided. Significance was calculated using Student’s t test. *P < 0.05; **P < 0.01; ***P < 0.001.
Figure 7
Figure 7. Loss of MiR34a facilitates tumor invasion after AOM/DSS treatment.
(A) Expression of miR-34a in colon tissue of WT and Stat3ΔIEC mice. (B) Expression of Il6 mRNA in colon tissue of Mir34aF/F mice after 5 days of DSS treatment. (C) Expression of miR-34a in colon epithelial cells of Mir34aF/F mice after 5 days of DSS treatment. (D) Schematic overview of the CAC regimen as described in Methods. (E) Outline of the Mir34a targeting strategy in mice. (F) Genotyping PCR for determination of Mir34a–/– mice. (G) Tumor incidence in indicated mice (n ≥ 10 for each genotype). (H) Mean tumor size in indicated mice (n ≥ 5 for each genotype). (I) Tumor cell proliferation was determined by BrdU incorporation. Percentage of proliferation indicates BrdU-positive cells (n ≥ 10 tumors of each genotype). (J) Tumor cell apoptosis was determined by detection of cleaved caspase-3. Percentage of positive cells is indicated (n ≥ 10 tumors of each genotype). (K) H&E-stained sections of colons from Mir34aF/F and Mir34a–/– mice with arrows indicating magnified areas showing tumor morphology and representative invasive colon carcinoma in Mir34a–/– mice. Scale bars: 500 μm. (L) Percentage of mice showing invasive tumors for indicated genotypes. Number of mice with invasive tumors/total number of mice for each genotype is indicated above the bars. Mean values ± SEM are provided. *P < 0.05; **P < 0.01; ***P < 0.001.
Figure 8
Figure 8. The tumors of Mir34a–/– mice show characteristics of EMT and enhanced IL-6R/STAT3 signaling.
(A) Expression of mature miR-34a and Stat3 in mouse rectal cancer cell line CMT93 transfected with control or STAT3 siRNA. (B and C) Immunohistochemical analysis of p-STAT3, IL-6R, and SNAIL in tumors of Mir34aF/F and Mir34a–/– mice. Yellow and green arrows indicate tumor and stromal cells, respectively. Scale bars: 50 μm; 20 μm (insets). Bar charts (C) show the percentage of positive tumor cells (index; p-STAT3 and SNAIL) or expression score (IL-6R) determined as described in Methods (n ≥10 tumors from each genotype). (D) Western blot analysis of indicated proteins in lysates prepared from tumors of Mir34aF/F and Mir34a–/– mice (n = 5 from each genotype). Relative densitometric quantifications of indicated proteins are shown in lower panel. (E) qPCR analysis of indicated mRNAs in tumors of Mir34aF/F and Mir34a–/– mice (n = 3 from each genotype). (F) Schematic representation of the proposed IL-6R/STAT3/miR-34a feedback loop and its potential involvement in cancer progression. The activation of the loop by IL-6 induces EMT and shifts the cellular phenotype toward a mesenchymal state that is advantageous for invasion, intravasation, and extravasation steps of the metastatic cascade. On the contrary, the inactivation of the loop by p53 induces MET and switches cells to an epithelial state, which allows colonization and outgrowth of metastases. Shown are mean values ± SEM. *P < 0.05; **P < 0.01; ***P < 0.001.

Comment in

References

    1. Gupta GP, Massague J. Cancer metastasis: building a framework. Cell. 2006;127(4):679–695. doi: 10.1016/j.cell.2006.11.001. - DOI - PubMed
    1. Brabletz T, et al. Invasion and metastasis in colorectal cancer: epithelial-mesenchymal transition, mesenchymal-epithelial transition, stem cells and beta-catenin. Cells Tissues Organs. 2005;179(1–2):56–65. doi: 10.1159/000084509. - DOI - PubMed
    1. Thiery JP, Acloque H, Huang RY, Nieto MA. Epithelial-mesenchymal transitions in development and disease. Cell. 2009;139(5):871–890. doi: 10.1016/j.cell.2009.11.007. - DOI - PubMed
    1. Kalluri R, Weinberg RA. The basics of epithelial-mesenchymal transition. J Clin Invest. 2009;119(6):1420–1428. doi: 10.1172/JCI39104. - DOI - PMC - PubMed
    1. Lopez-Novoa JM, Nieto MA. Inflammation and EMT: an alliance towards organ fibrosis and cancer progression. EMBO Mol Med. 2009;1(6–7):303–314. doi: 10.1002/emmm.200900043. - DOI - PMC - PubMed

Publication types

MeSH terms