. 2014 Feb;6(2):118-30.
doi: 10.18632/aging.100639.

Age-dependent changes in mitochondrial morphology and volume are not predictors of lifespan

Affiliations

Age-dependent changes in mitochondrial morphology and volume are not predictors of lifespan

Saroj G Regmi et al. Aging (Albany NY). 2014 Feb.

Abstract

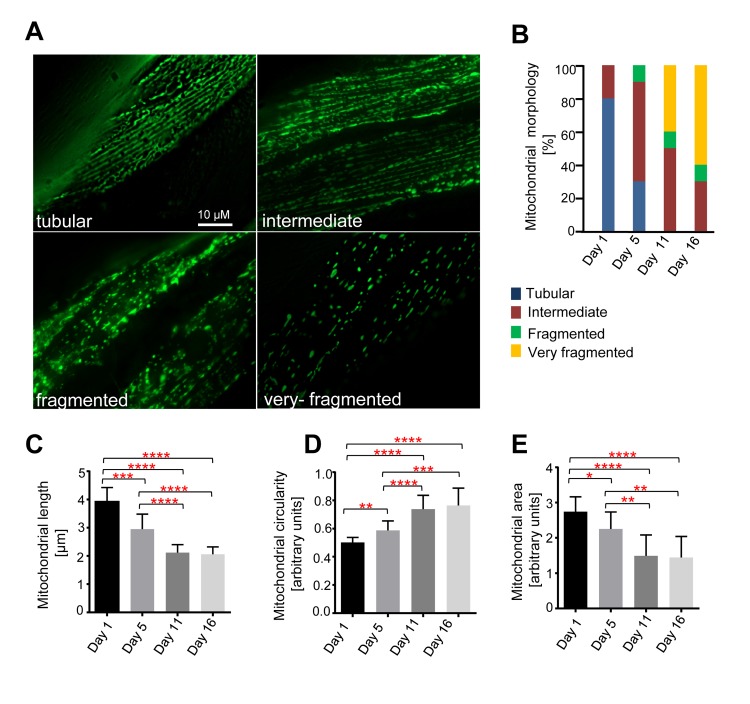
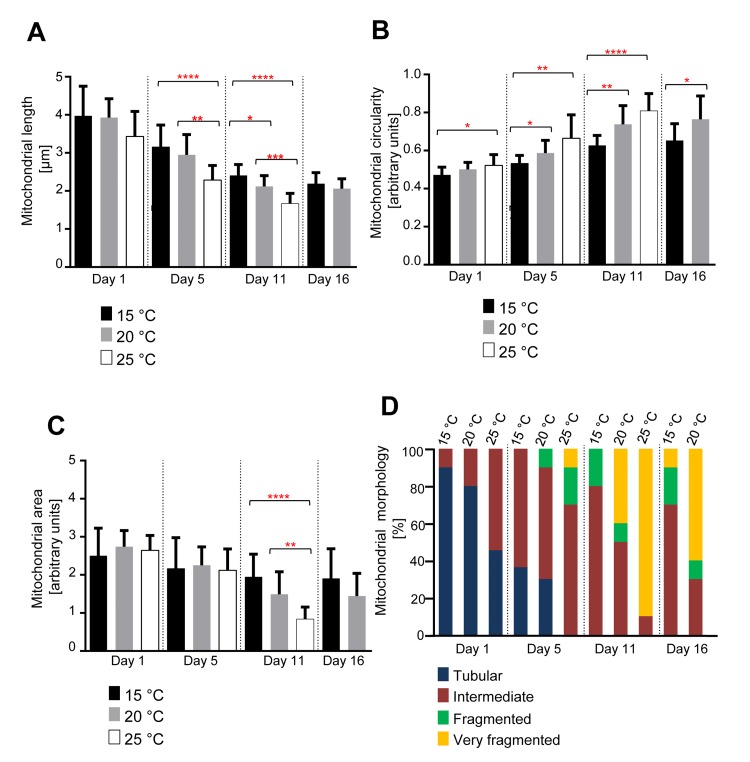
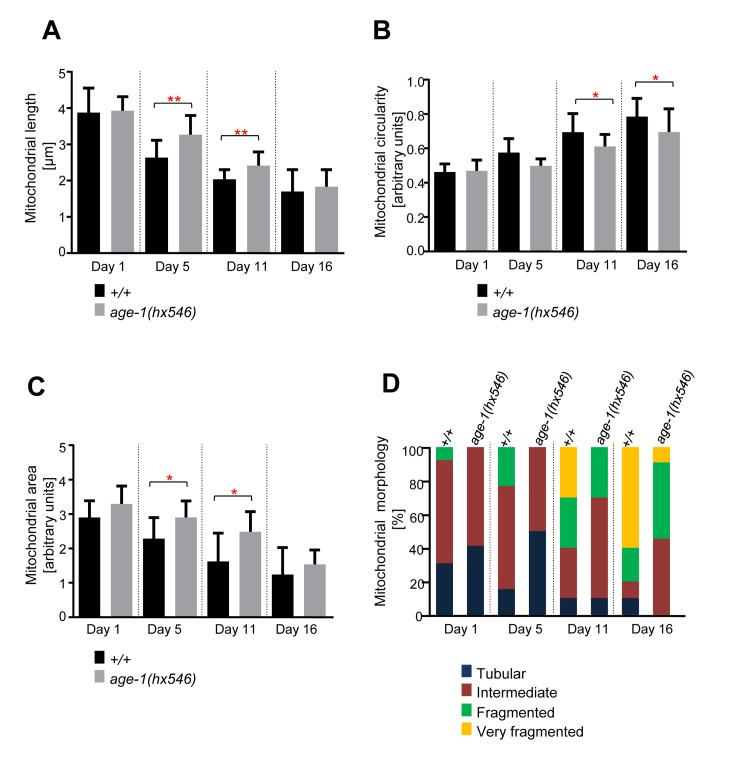
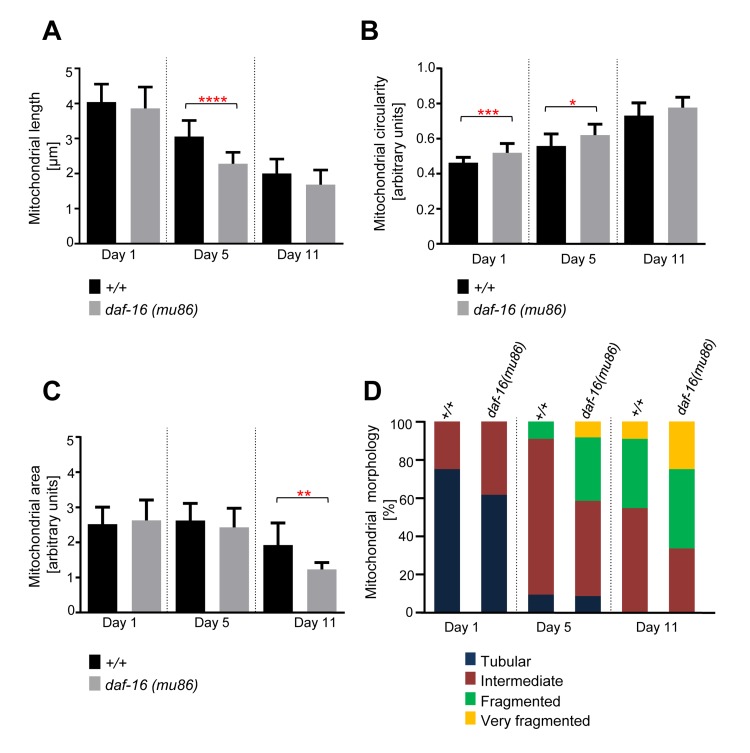
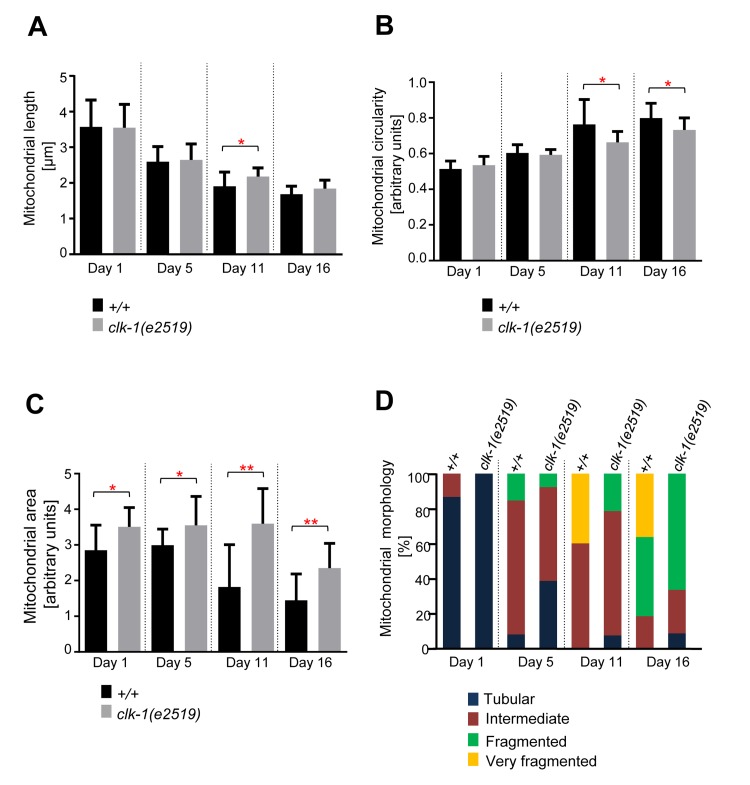
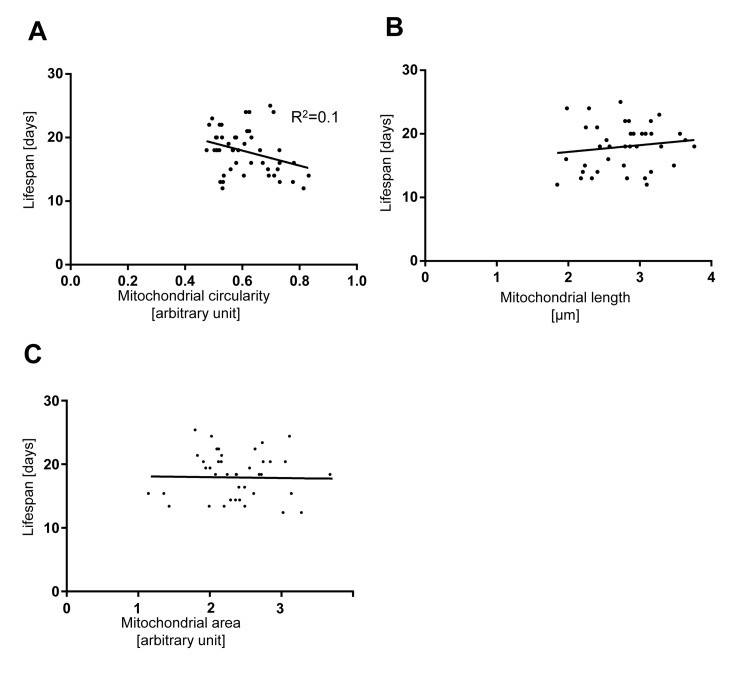
Mitochondrial dysfunction is a hallmark of skeletal muscle degeneration during aging. One mechanism through which mitochondrial dysfunction can be caused is through changes in mitochondrial morphology. To determine the role of mitochondrial morphology changes in age-dependent mitochondrial dysfunction, we studied mitochondrial morphology in body wall muscles of the nematodeC. elegans. We found that in this tissue, animals display a tubular mitochondrial network, which fragments with increasing age. This fragmentation is accompanied by a decrease in mitochondrial volume. Mitochondrial fragmentation and volume loss occur faster under conditions that shorten lifespan and occur slower under conditions that increase lifespan. However, neither mitochondrial morphology nor mitochondrial volume of five- and seven-day old wild-type animals can be used to predict individual lifespan. Our results indicate that while mitochondria in body wall muscles undergo age-dependent fragmentation and a loss in volume, these changes are not the cause of aging but rather a consequence of the aging process.


Conflict of interest statement

The authors of this manuscript have no conflict of interest to declare.

Figures

Figure 1
Figure 1. Age-dependent mitochondrial changes in C. elegans body wall muscle cells
Transgenic animals expressing mitoGFP in body wall muscle cells (bcIs78 [Pmyo-3 mitoGFP]) were analyzed at different days after the L4 larval stage (Day 1, Day5, Day 11 and Day 16). (A) Representative images of the different mitochondrial morphologies observed. (B) Qualitative analysis of mitochondrial morphology with age. Blue, Red, Green and Yellow represent percentage of animals displaying tubular, intermediate, fragmented and very fragmented mitochondrial morphology, respectively (n=10-13 images). Using the same dataset, mitochondrial length (n=10-13 cells) (C), circularity (n=10-13 cells) (D) and area (n=9-11 images) (E) were measured. Error bars indicate standard deviations. Statistical significance was tested using the Student t-test (* p<0.05, ** p<0.01, *** p<0.001 and **** p<0.0001).
Figure 2
Figure 2. Age-dependent mitochondrial changes occur faster at 25 °C and slower at 15 °C
(A) Mitochondrial length (n=9-15 cells), (B) circularity (n=9-15 cells), and (C) area (n=9-10 images) of animals expressing mitoGFP in body wall muscle cells (bcIs78 [Pmyo-3 mitoGFP]) raised at 15°C, 20°C and 25°C. Error bars indicate standard deviations. Statistical significance was tested using the Student t-test (* p<0.05, ** p<0.01, *** p<0.001 and **** p<0.0001). (D) Qualitative analysis of mitochondrial morphology with age. Blue, Red, Green and Yellow represent percentage of animals displaying tubular, intermediate, fragmented and very fragmented mitochondrial morphology, respectively (n=10-11 images).
Figure 3
Figure 3. Age-dependent mitochondrial changes occur slower in age-1(hx546) animals
Comparison of (A) mitochondrial length (n=12-17 cells), (B) circularity (n=12-17 cells), and (C) area (n=9-13 images) in wild-type animals expressing mitoGFP in body wall muscle cells (bcIs78 [Pmyo-3 mitoGFP]) and in isogenic age-1(hx546) animals (age-1(hx546); bcIs78). Error bars indicate standard deviations. Statistical significance was tested using the Student t-test (* p<0.05, ** p<0.01, *** p<0.001 and **** p<0.0001). (D) Qualitative analysis of mitochondrial morphology with age. Blue, Red, Green and Yellow represent percentage of animals displaying tubular, intermediate, fragmented and very fragmented mitochondrial morphology, respectively (n=10-17 images).
Figure 4
Figure 4. Age-dependent mitochondrial changes occur faster in daf-16(mu86) animals
Comparison of (A) mitochondrial length (n=12-20 cells), (B) circularity (n=12-20 cells), and (C) area (n=11-13 images) in wild-type animals expressing mitoGFP in body wall muscle cells (bcIs78 [Pmyo-3 mitoGFP]) and in isogenic daf-16(mu86) animals (daf-16(mu86); bcIs78). Error bars indicate standard deviations. Statistical significance was tested using the Student t-test (* p<0.05, ** p<0.01, *** p<0.001 and **** p<0.0001). (D) Qualitative analysis of mitochondrial morphology with age. Blue, Red, Green and Yellow represent percentage of animals displaying tubular, intermediate, fragmented and very fragmented mitochondrial morphology, respectively (n=11-13 images).
Figure 5
Figure 5. Age-dependent mitochondrial changes occur slower in clk-1(e2519) animals
Comparison of (A) mitochondrial length (n=14-21 cells), (B) circularity (n=14-21 cells), and (C) area (n=9-13 images) in wild-type animals expressing mitoGFP in body wall muscle cells (bcIs78 [Pmyo-3 mitoGFP]) and in isogenic clk-1(e2519) animals (clk-1(e2519); bcIs78). Error bars indicate standard deviations. Statistical significance was tested using the Student t-test (* p<0.05, ** p<0.01, *** p<0.001 and **** p<0.0001). (D) Qualitative analysis of mitochondrial morphology with age. Blue, Red, Green and Yellow represent percentage of animals displaying tubular, intermediate, fragmented and very fragmented mitochondrial morphology, respectively (n=10-15 images).
Figure 6
Figure 6. The extent of mitochondrial fragmentation at day 5 and 7 is not a bio-marker of aging
Lifespan plotted against (A) mitochondrial circularity, (B) mitochondrial length, and (C) mitochondrial area in control bcIs78 animals at day 5 and 7. Each dot represents a single worm.

References

    1. Marzetti E, Calvani R, Cesari M, Buford TW, Lorenzi M, Behnke BJ, Leeuwenburgh C. Mitochondrial dysfunction and sarcopenia of aging: from signaling pathways to clinical trials. Int J Biochem Cell Biol. 2013;45:2288–2301. - PMC - PubMed
    1. Janssen I, Baumgartner RN, Ross R, Rosenberg IH, Roubenoff R. Skeletal muscle cutpoints associated with elevated physical disability risk in older men and women. Am J Epidemiol. 2004;159:413–421. - PubMed
    1. Visser M, Schaap LA. Consequences of sarcopenia. Clin Geriatr Med. 2011;27:387–399. - PubMed
    1. Bruusgaard JC, Egner IM, Larsen TK, Dupre-Aucouturier S, Desplanches D, Gundersen K. No change in myonuclear number during muscle unloading and reloading. J Appl Physiol. 2012;113:290–296. - PubMed
    1. Carlson BM, Faulkner JA. Muscle transplantation between young and old rats: age of host determines recovery. Am J Physiol. 1989;256:C1262–1266. - PubMed

Publication types