. 2014 Apr;24(4):639-50.
doi: 10.1101/gr.162529.113. Epub 2014 Mar 18.

Evolutionary conservation of the eumetazoan gene regulatory landscape

Affiliations

Evolutionary conservation of the eumetazoan gene regulatory landscape

Michaela Schwaiger et al. Genome Res. 2014 Apr.

Abstract

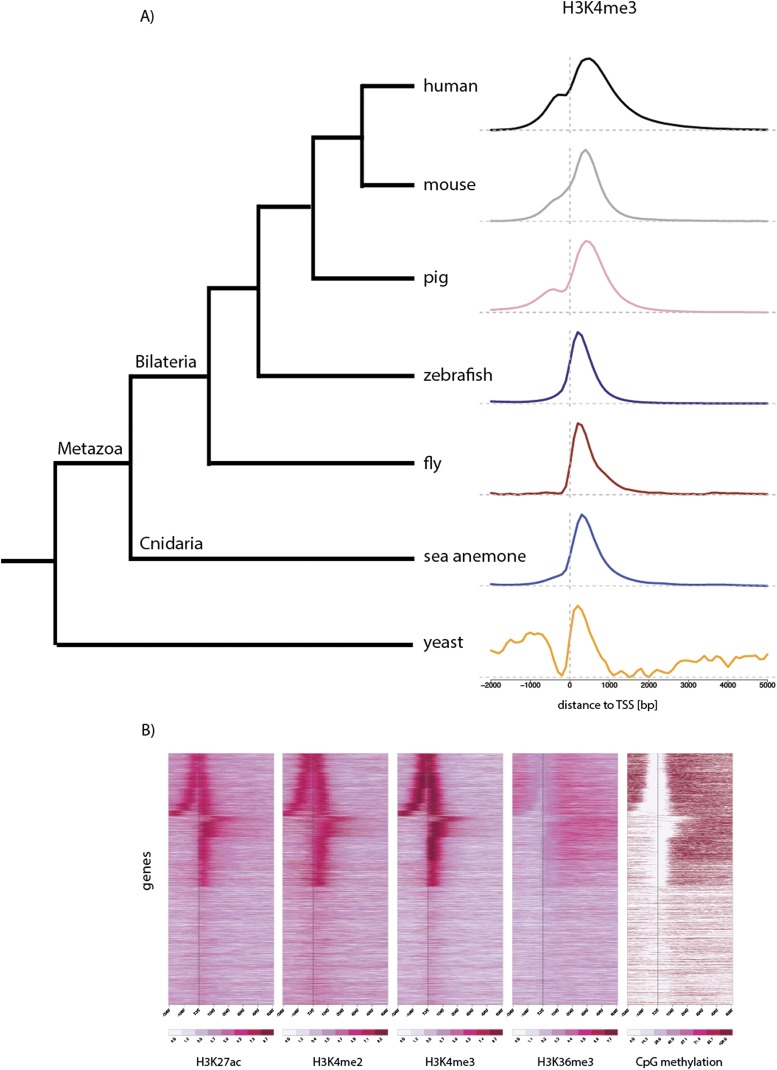
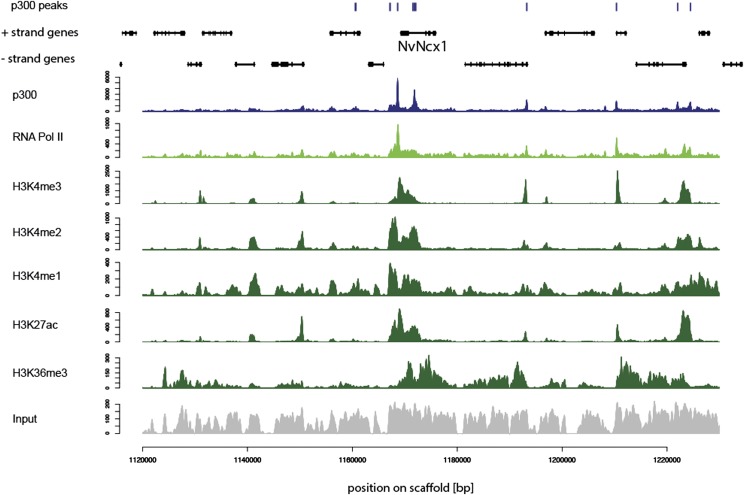
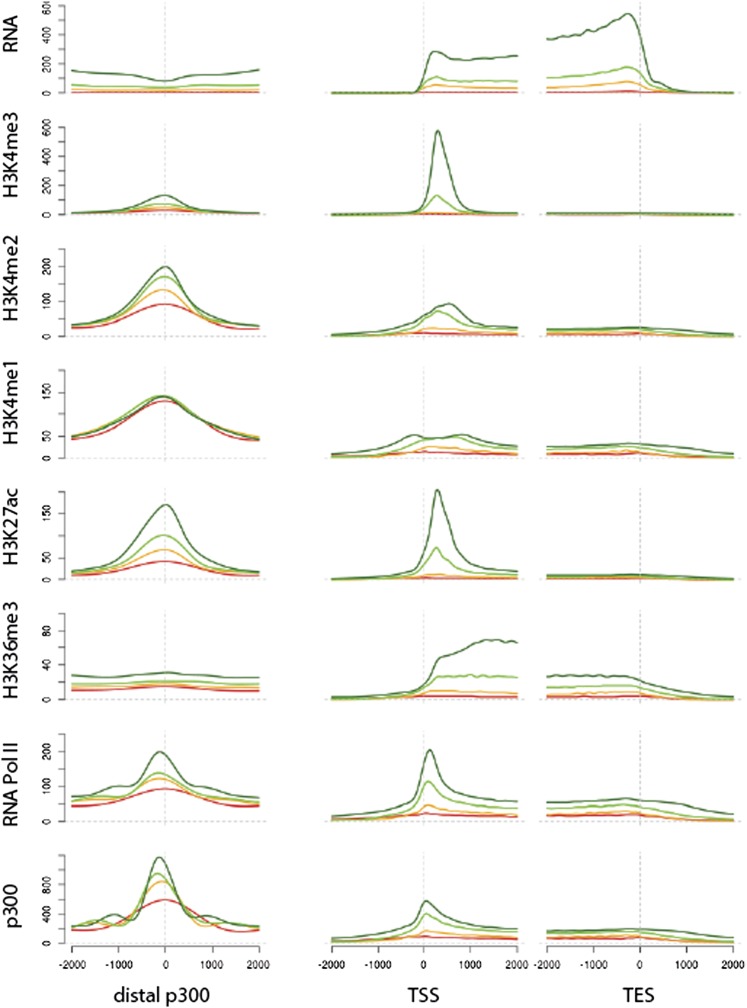
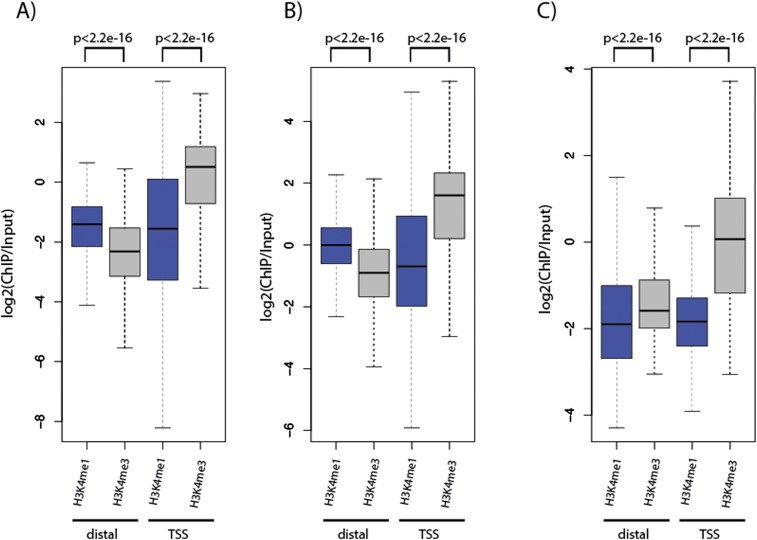
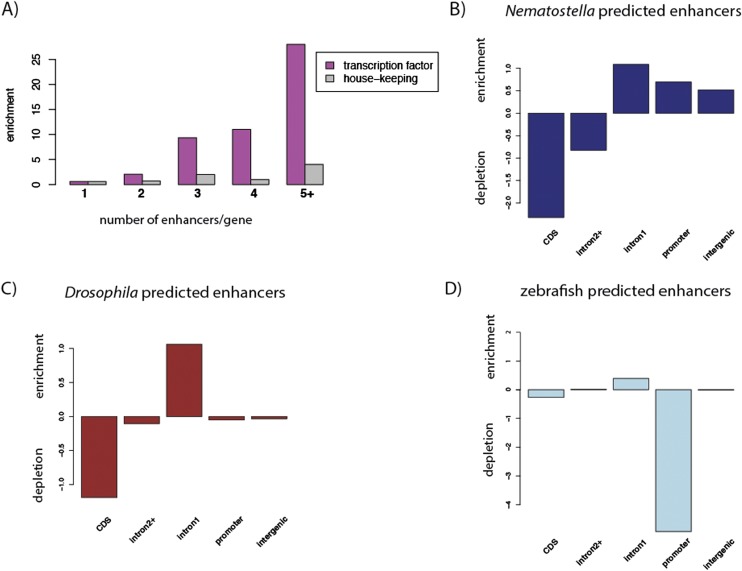
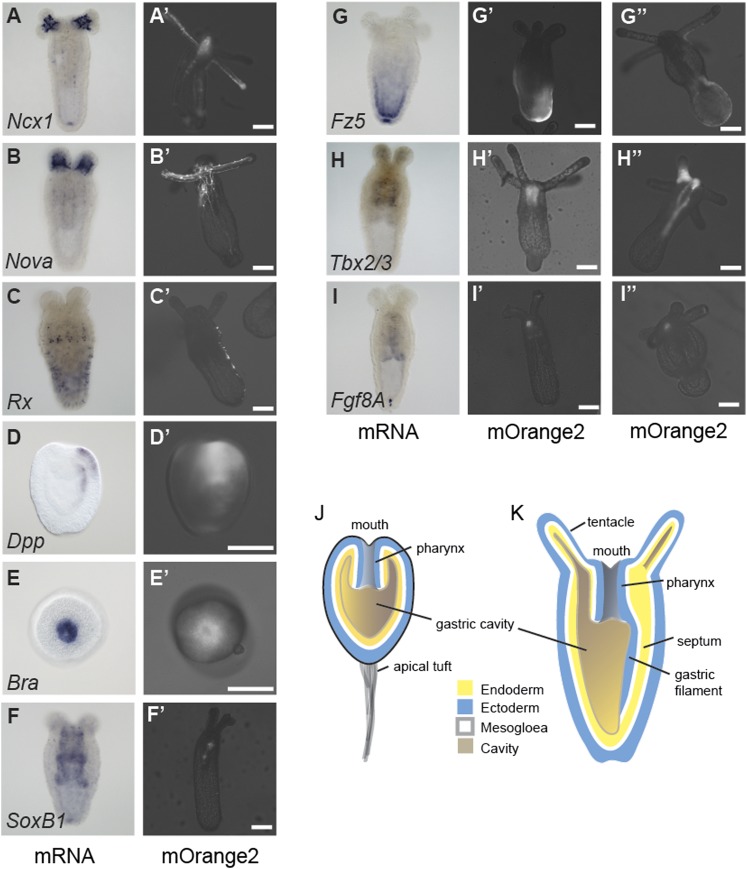
Despite considerable differences in morphology and complexity of body plans among animals, a great part of the gene set is shared among Bilateria and their basally branching sister group, the Cnidaria. This suggests that the common ancestor of eumetazoans already had a highly complex gene repertoire. At present it is therefore unclear how morphological diversification is encoded in the genome. Here we address the possibility that differences in gene regulation could contribute to the large morphological divergence between cnidarians and bilaterians. To this end, we generated the first genome-wide map of gene regulatory elements in a nonbilaterian animal, the sea anemone Nematostella vectensis. Using chromatin immunoprecipitation followed by deep sequencing of five chromatin modifications and a transcriptional cofactor, we identified over 5000 enhancers in the Nematostella genome and could validate 75% of the tested enhancers in vivo. We found that in Nematostella, but not in yeast, enhancers are characterized by the same combination of histone modifications as in bilaterians, and these enhancers preferentially target developmental regulatory genes. Surprisingly, the distribution and abundance of gene regulatory elements relative to these genes are shared between Nematostella and bilaterian model organisms. Our results suggest that complex gene regulation originated at least 600 million yr ago, predating the common ancestor of eumetazoans.


Figures

Figure 1.
Figure 1.
Conserved distribution of chromatin marks across genes. (A) The distribution of H3K4me3 ChIP-seq reads (y-axis) is shown around genes of different species; human (The ENCODE Project Consortium 2012), mouse (Xiao et al. 2012), pig (Xiao et al. 2012), fish (Bogdanovic et al. 2012), fly (Bonn et al. 2012), sea anemone (adult female polyps), and yeast (Maltby et al. 2012) aligned at their TSSs. TSSs were obtained from Ensembl Biomart, except for Nematostella, where they are based on RNA-seq data (D Fredman, M Schwaiger, F Rentzsch, and U Technau, in prep.). The x-axis spans −2 kb to +5 kb around TSSs. Genes with TSSs closer than 2 kb (yeast: 1 kb) to each other and shorter than 5 kb (yeast: 2 kb) were excluded from the analysis. (B) Heatmaps of histone modifications and CpG methylation (Zemach et al. 2010) in adult female Nematostella polyps around genes aligned at their TSSs, as in A. Each line of the heatmap represents a single gene (y-axis); only nonoverlapping genes longer than 5 kb were plotted. The colors indicate the number of reads on a log-scale (histone modifications) or the average percentage of CpG methylation. Note that many genes are transcribed in the opposite direction from nearby TSSs.
Figure 2.
Figure 2.
Many p300 peaks overlap with sites of open chromatin. Region surrounding the NvNcx1 gene showing the distribution of p300 peaks (top, blue), gene models (black), p300 (blue), RNA Pol II (light green), several histone modifications (dark green), and input. (x-axis) Position on the scaffold; (y-axis) number of reads. The data are derived from planula larvae.
Figure 3.
Figure 3.
Enhancer-related chromatin modifications are associated with distal p300 peaks. Distribution of chromatin marks, RNA polymerase II, and p300 across distal p300 peaks and genes. Planula p300 peaks that do not overlap with TSSs were aligned relative to their peak summit (left plots), and genes were aligned relative to their annotated transcription start (middle plots) and end (right plots). The x-axis in each plot represents the position within the gene relative to peak summits, transcription start sites, and 3′ ends. The y-axis in each plot represents the relative enrichment for epigenomic variables such as several histone modifications in the planula stage. (Red line) Nonexpressed genes (FPKM <1.5). (Orange line) Lowly expressed genes. (Green line) Medium expressed genes. (Dark green line) Highly expressed genes. (Expressed genes) FPKM >2. The expressed genes were divided into three bins of an equal number of genes according to their FPKM values.
Figure 4.
Figure 4.
H3K4me1 is enriched at distal p300 peaks in Nematostella. (A,B) Gastrula (A) or planula (B) p300 peaks were split into peaks >300 bp distal to transcription start sites (TSSs) (distal, left) and peaks within 300 bp around TSSs (TSS, right). On the y-axis, the enrichment of H3K4me1 (blue boxes) or H3K4me3 (gray boxes) normalized to input is plotted. Distal p300 peaks have higher H3K4me1 than H3K4me3 levels, a characteristic of enhancers. As expected, p300 peaks around TSSs are more enriched in H3K4me3. (C) Peaks of three different transcription factors (Reb1, Gal4, Phd1) derived from ChIP-exo experiments (Rhee and Pugh 2011) in Saccharomyces cerevisiae were split into distal and TSS overlapping peaks as in A and B. A total of 70% of peaks overlapped TSSs, and the remaining peaks were still within 2 kb around the TSS. On the y-axis, the enrichment of H3K4me1 (blue boxes) or H3K4me3 (gray boxes) normalized to input (Kirmizis et al. 2007) is plotted. P-values were calculated using the Wilcoxon rank sum test.
Figure 5.
Figure 5.
Similar genomic distribution of predicted enhancers in different eumetazoans. (A) The number of genes associated with 1, 2, 3, 4, and 5 or more predicted enhancers in Nematostella is plotted for genes encoding transcription factors (pink) and housekeeping genes (gray). The counts of genes with a given number of predicted enhancers have been normalized to the counts of genes associated with a given number of shuffled predicted enhancers. (BD) Distribution of predicted enhancer regions normalized to shuffled predicted enhancers across genomic annotations in Nematostella (B), Drosophila (C), and zebrafish (D). Positive numbers indicate enrichment, and negative numbers indicate depletion of predicted enhancers in a certain genomic region compared with the random expectation. Promoter regions are defined from the TSS to 1 kb upstream of the TSS.
Figure 6.
Figure 6.
Predicted enhancer elements activate transcription in vivo. (AI) Whole-mount in situ hybridizations of Nematostella embryos and primary polyps. (A′I′) Fluorescent mOrange2 signal of live embryos or primary polyps injected with a construct where a predicted enhancer region of the indicated Nematostella gene was driving mOrange2 expression. (G″I″) Fluorescent mOrange2 signal of live primary polyps injected with a construct where a second predicted enhancer region (different from the region in G′–I′) of the indicated Nematostella gene was driving mOrange2 expression. The Nematostella gene names are indicated inside the in situ hybridization pictures (Nv in the beginning of the gene name was omitted due to space constraints). The white scale bars represent 100 µm. All pictures were taken at the primary polyp stage (>8 d post-fertilization; lateral view) except D and E, which depict planula larvae (lateral view: D,D′; oral view: E,E′). (J,K) Schematic representation of a Nematostella planula larva (J) and primary polyp (K).

References

    1. Arnold CD, Gerlach D, Stelzer C, Boryn LM, Rath M, Stark A 2013. Genome-wide quantitative enhancer activity maps identified by STARR-seq. Science 339: 1074–1077 - PubMed
    1. Bardet AF, Steinmann J, Bafna S, Knoblich JA, Zeitlinger J, Stark A 2013. Identification of transcription factor binding sites from ChIP-seq data at high resolution. Bioinformatics 29: 2705–2713 - PMC - PubMed
    1. Barnett DW, Garrison EK, Quinlan AR, Strömberg MP, Marth GT 2011. BamTools: A C++ API and toolkit for analyzing and managing BAM files. Bioinformatics 27: 1691–1692 - PMC - PubMed
    1. Barski A, Cuddapah S, Cui K, Roh T-Y, Schones DE, Wang Z, Wei G, Chepelev I, Zhao K 2007. High-resolution profiling of histone methylations in the human genome. Cell 129: 823–837 - PubMed
    1. Bejerano G, Pheasant M, Makunin I, Stephen S, Kent WJ, Mattick JS, Haussler D 2004. Ultraconserved elements in the human genome. Science 304: 1321–1325 - PubMed

Publication types

Associated data