

Nutritional transition in children under five years and women of reproductive age: a 15-years trend analysis in Peru
- PMID: 24643049
- PMCID: PMC3958518
- DOI: 10.1371/journal.pone.0092550
Nutritional transition in children under five years and women of reproductive age: a 15-years trend analysis in Peru
Erratum in
- PLoS One. 2014;9(7):e103356
Abstract
Background: Rapid urbanization, increase in food availability, and changes in diet and lifestyle patterns have been changing nutritional profiles in developing nations. We aimed to describe nutritional changes in children under 5 years and women of reproductive age in Peru, during a 15-year period of rapid economic development and social policy enhancement.
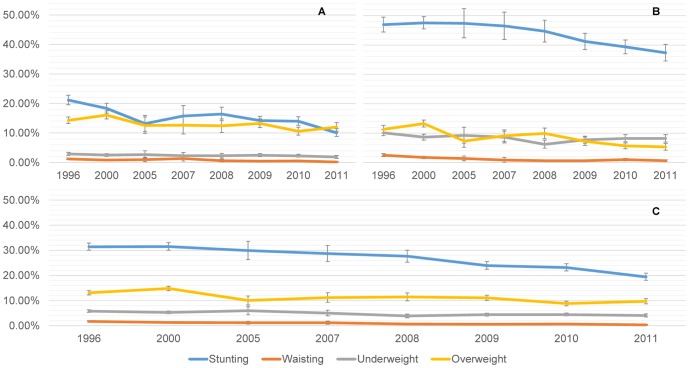
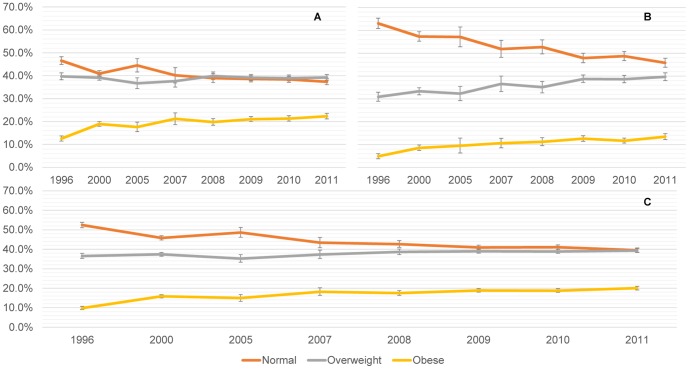
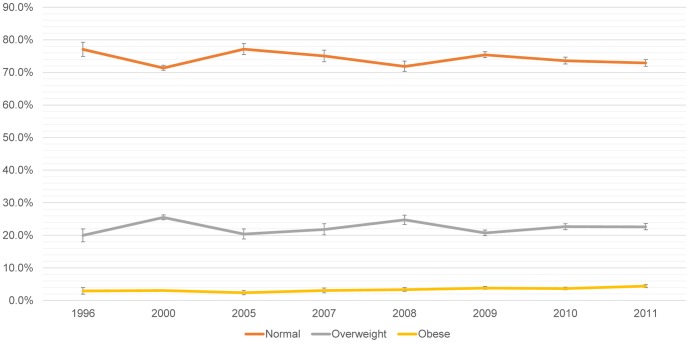
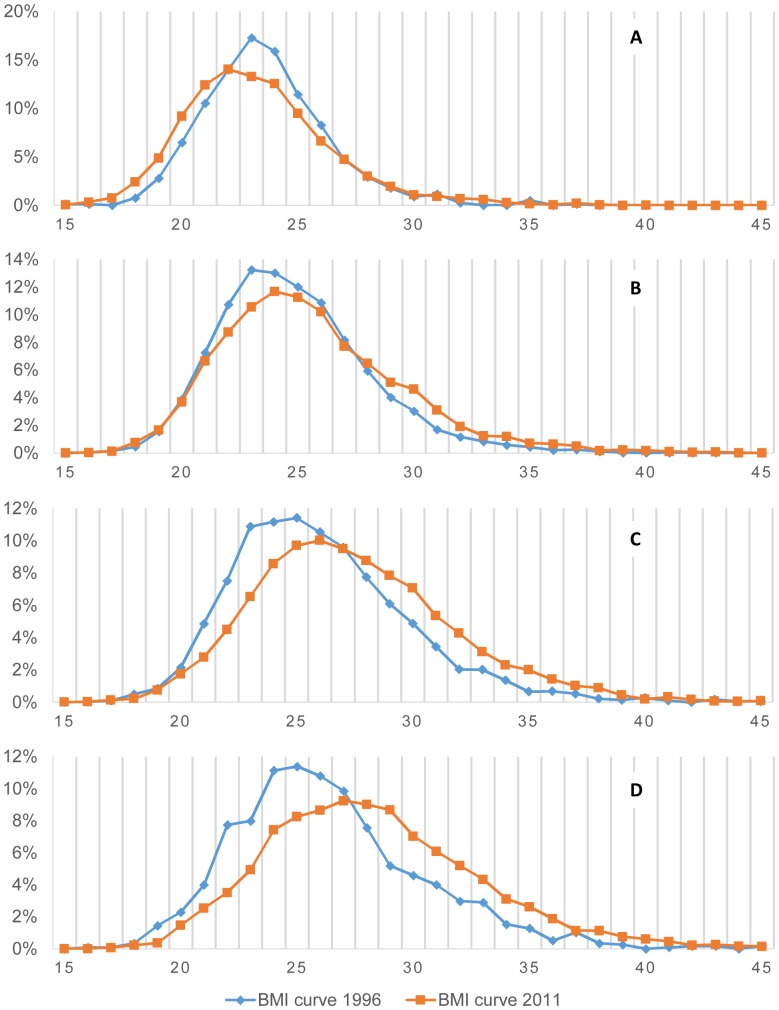
Materials and methods: Trend analyses of anthropometric measures in children of preschool age and women between 15-49 years, using the Peruvian National Demographic and Family Health Surveys (DHS) from 1996 to 2011. WHO growth curves were used to define stunting, underweight, wasting and overweight in children <5 y. We employed the WHO BMI-age standardized curves for teenagers between 15-19 y. In women >19 years, body mass index (BMI) was analyzed both categorically and as a continuous variable. To statistically analyze the trends, we used regression models: Linear and Poisson for continuous and binary outcomes, respectively.
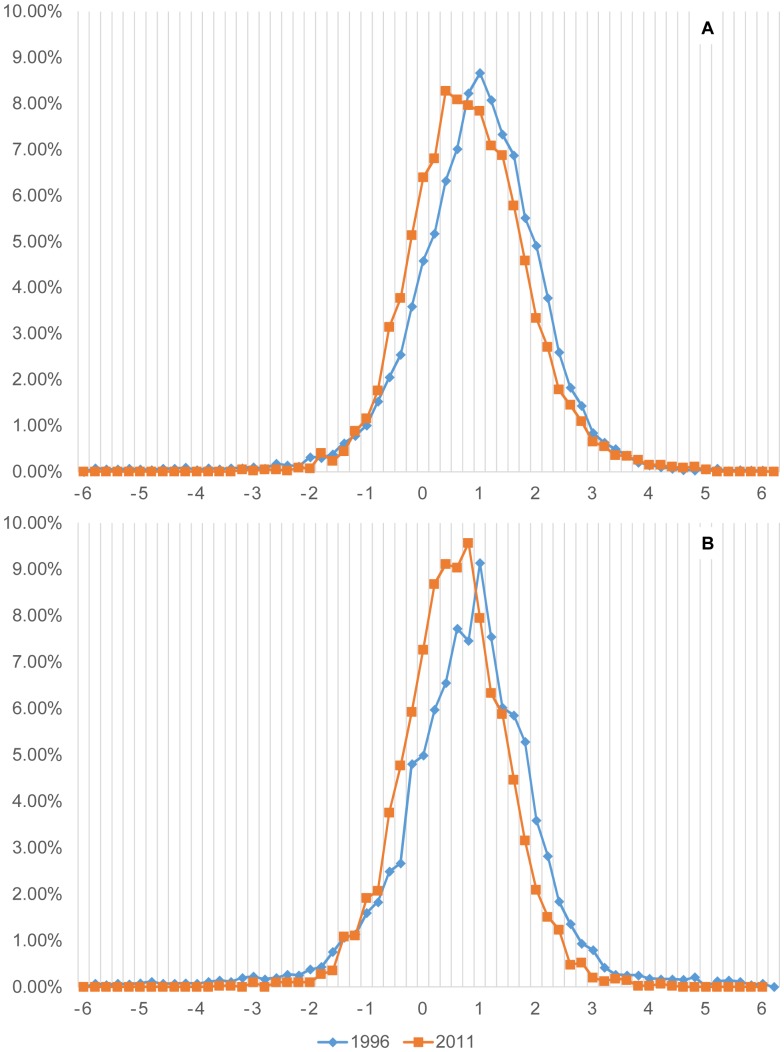
Results: We analyzed data from 123 642 women and 64 135 children, from 1996 to 2011. Decreases over time were evidenced for underweight (p<0.001), wasting (p<0.001), and stunting (p<0.001) in children under 5 y. This effect was particularly noted in urban settings. Overweight levels in children reduced (p<0.001), however this reduction stopped, in urban settings, since 2005 (∼12%). Anemia decreased in children and women (p<0.001); with higher reduction in urban (↓43%) than in rural children (↓24%). BMI in women aged 15-19 years increased (p<0.001) across time, with noticeable BMI-curve shift in women older than 30 years. Moreover, obesity doubled during this period in women more than 19 y.
Conclusion: Nutrition transition in Peru shows different patterns for urban and rural populations. Public policies should emphasize targeting both malnutrition conditions--undernutrition/stunting, overweight/obesity and anemia--considering age and place of residence in rapid developing societies like Peru.
Conflict of interest statement
Figures
References
-
- Drewnowski A, Popkin BM (1997) The nutrition transition: new trends in the global diet. Nutr Rev 55: 31–43. - PubMed
-
- WHO U, World Bank (2012) Level & Trends in Child Malnutrition. UNICEF-WHO-The World Bank: Joint child malnutrition estimates - Levels and trends.
-
- Wang Y, Monteiro C, Popkin BM (2002) Trends of obesity and underweight in older children and adolescents in the United States, Brazil, China, and Russia. Am J Clin Nutr 75: 971–977. - PubMed
-
- Finucane MM, Stevens GA, Cowan MJ, Danaei G, Lin JK, et al. (2011) National, regional, and global trends in body-mass index since 1980: systematic analysis of health examination surveys and epidemiological studies with 960 country-years and 9.1 million participants. Lancet 377: 557–567. - PMC - PubMed
MeSH terms
LinkOut - more resources
Full Text Sources
Other Literature Sources
