. 2014 Mar 18;9(3):e92039.
doi: 10.1371/journal.pone.0092039. eCollection 2014.

Subcellular localization of ENS-1/ERNI in chick embryonic stem cells

Affiliations

Subcellular localization of ENS-1/ERNI in chick embryonic stem cells

Sophie Blanc et al. PLoS One. .

Abstract

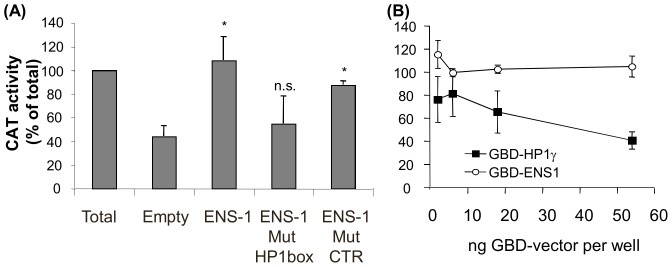
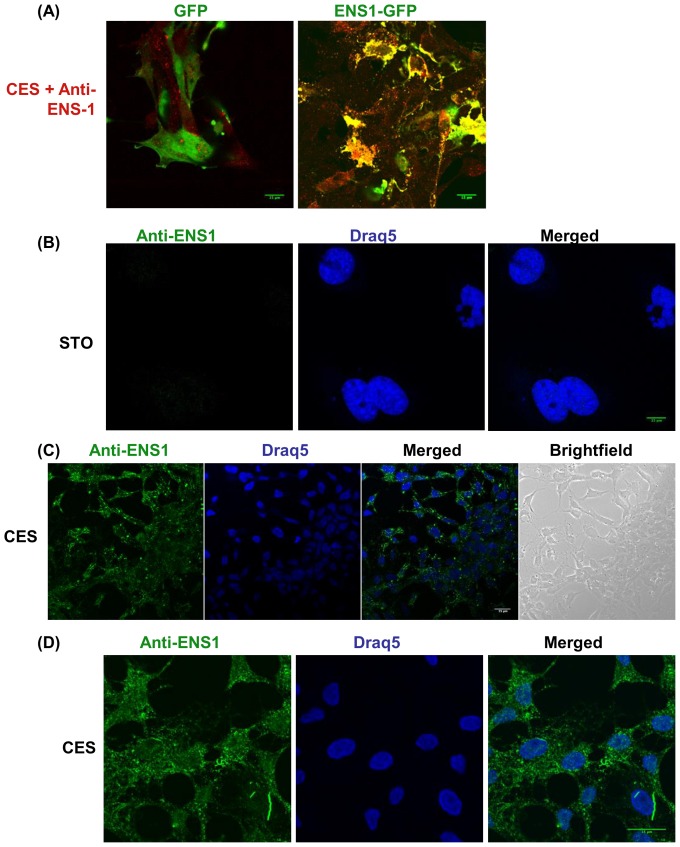
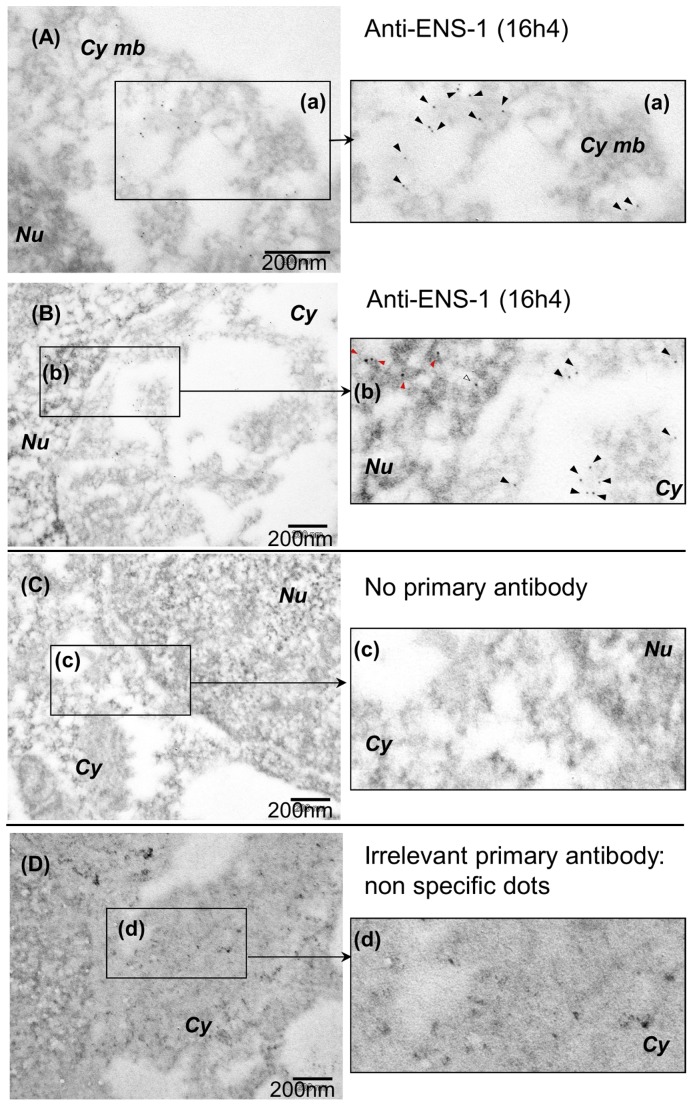
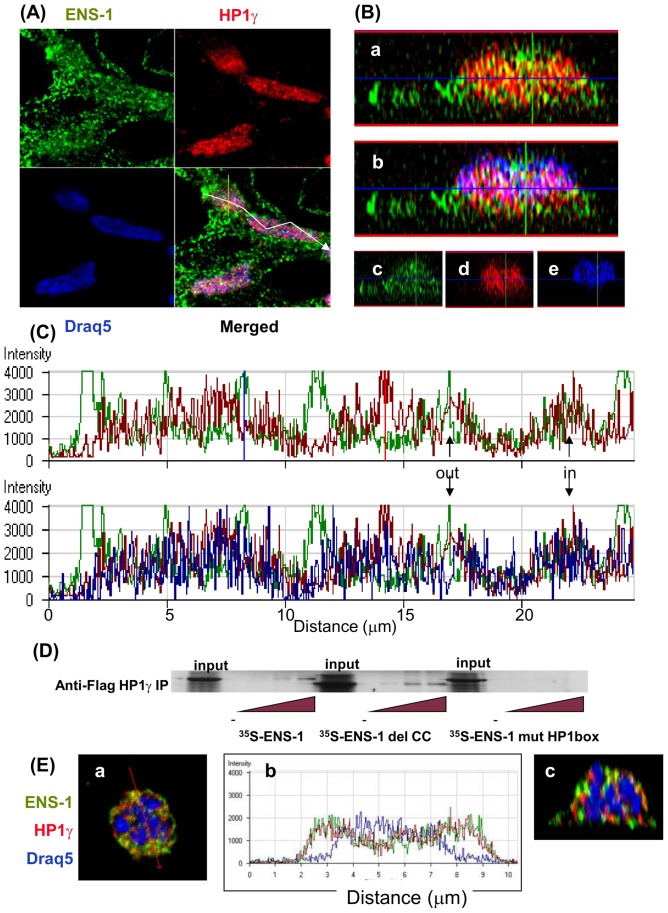
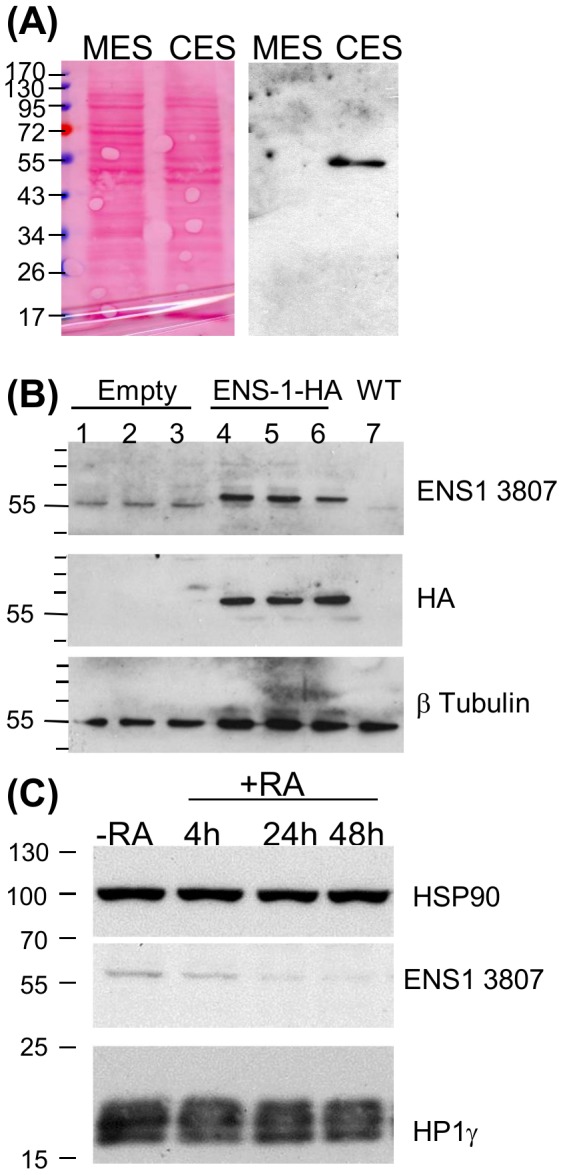
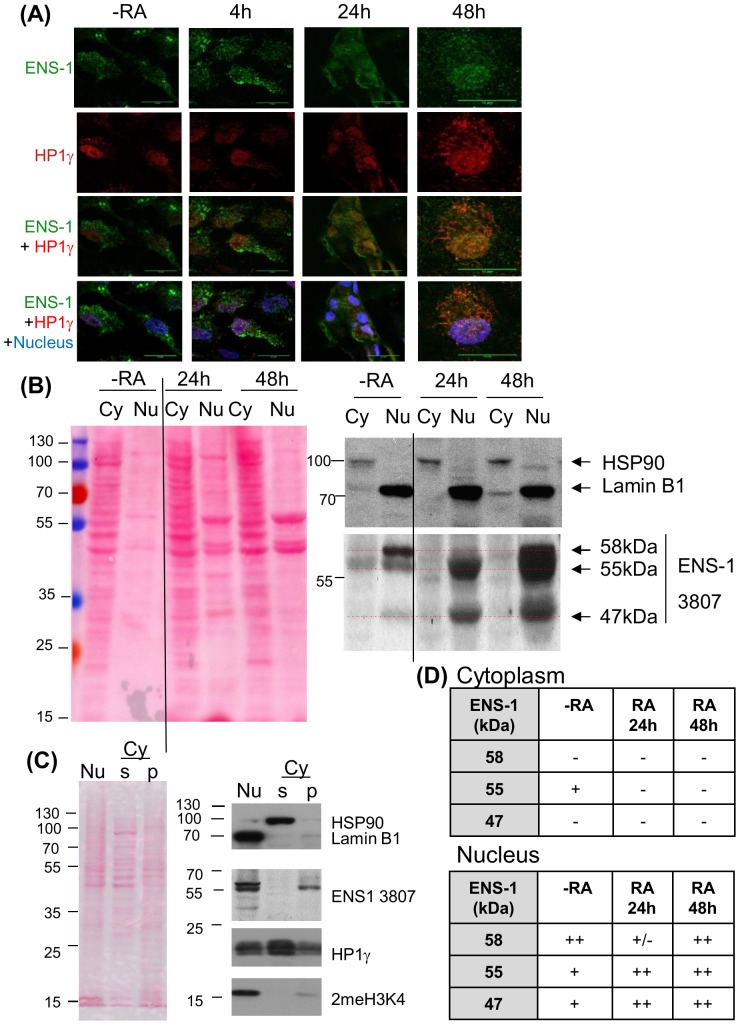
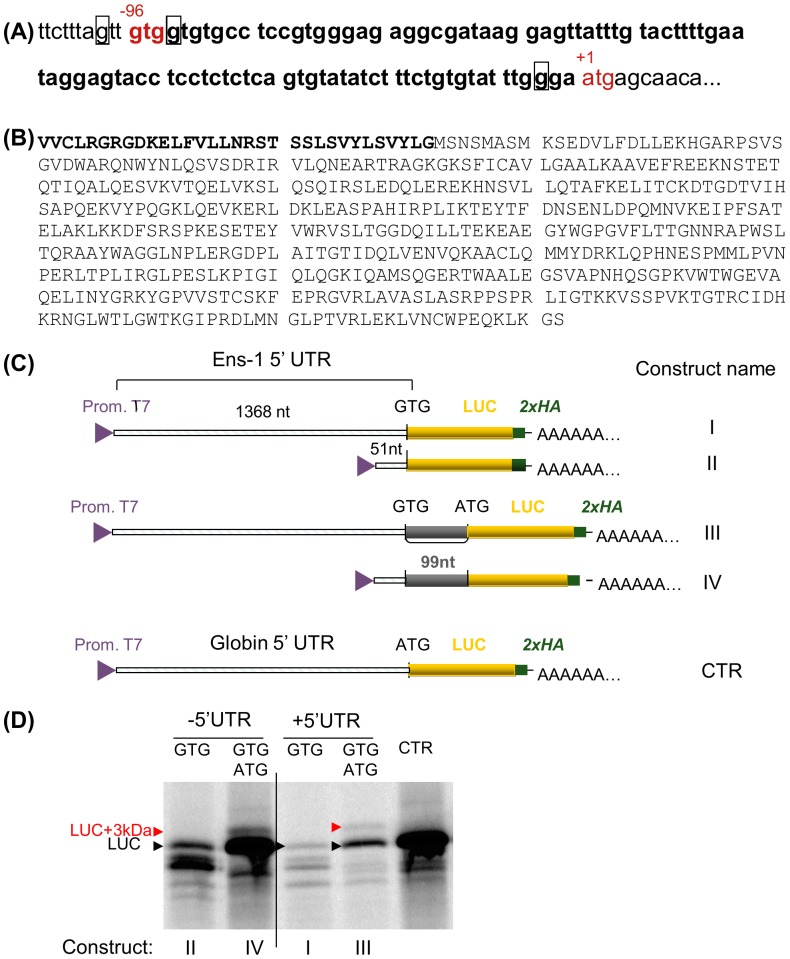
The protein of retroviral origin ENS-1/ERNI plays a major role during neural plate development in chick embryos by controlling the activity of the epigenetic regulator HP1γ, but its function in the earlier developmental stages is still unknown. ENS-1/ERNI promoter activity is down-regulated upon differentiation but the resulting protein expression has never been examined. In this study, we present the results obtained with custom-made antibodies to gain further insights into ENS-1 protein expression in Chicken embryonic stem cells (CES) and during their differentiation. First, we show that ENS-1 controls the activity of HP1γ in CES and we examined the context of its interaction with HP1γ. By combining immunofluorescence and western blot analysis we show that ENS-1 is localized in the cytoplasm and in the nucleus, in agreement with its role on gene's promoter activity. During differentiation, ENS-1 decreases in the cytoplasm but not in the nucleus. More precisely, three distinct forms of the ENS-1 protein co-exist in the nucleus and are differently regulated during differentiation, revealing a new level of control of the protein ENS-1. In silico analysis of the Ens-1 gene copies and the sequence of their corresponding proteins indicate that this pattern is compatible with at least three potential regulation mechanisms, each accounting only partially. The results obtained with the anti-ENS-1 antibodies presented here reveal that the regulation of ENS-1 expression in CES is more complex than expected, providing new tracks to explore the integration of ENS-1 in CES cells regulatory networks.


Conflict of interest statement

Competing Interests: The authors have declared that no competing interests exist.

Figures

Figure 1
Figure 1. Transcriptional repression by HP1γ is modified by its interaction with ENS-1 in CES.
CES cells were co-transfected with the pG4-TK-CAT reporter plasmid and the plasmid encoding for the indicated protein in fusion with a Gal4-DNA binding domain (GBD). An equal amount of pRL-CMV plasmid encoding for Renilla Luciferase was added to each well for normalization. (A) Transcription inhibition of the CAT reporter gene by GBD-HP1γ in the presence of pCi expression vectors encoding for ENS-1, for ENS-1 mutated in the HP1box. Mutation in an irrelevant PxVxL sequence was used as control. Maximal inhibition by HP1γ was given by co-transfection with the empty pCi vector (Empty). (B) Promoter activity was compared in the presence of GBD-ENS-1 and GBD-HP1γ. In (A) and (B) the promoter activity was assayed by quantifying the amount of CAT protein expressed by CAT-ELISA. Data were normalized on the basis of the luciferase activity in each well. Results represent CAT expressions in the presence of GBD-fusion proteins as percent of the maximal expression obtained with GBD alone in the same conditions. They are mean of four (A) and two (B) independent experiments +/− SD. Statistics are results of t test relative to the value obtained in the Empty condition: * p<0.005; n.s. not significant (p>0.1). In (B), CAT activity difference between 2 and 6 ng of GBD-ENS-1 vector is not significant.
Figure 2
Figure 2. Localization of ENS-1 in the cytoplasm and in the nucleus of CES.
(A) CES transfected with an expression vector for GFP alone or in fusion with the ENS1 protein were incubated with the 16h4antibody produced against ENS1. An anti-mouse antibody coupled with Alexa555 was used as secondary antibody (red) while GFP proteins were in green. Overlapping signals gave a yellow staining. In (B), (C) and (D) immunostaining with the 16h4 antibody was detected with an Alexa488 anti-mouse antibody (green) and the nucleus was localized by DNA staining with Draq5 (blue). (B) The 16h4 anti-ENS-1 antibody does not label STO murine embryonic fibroblasts (used as negative control). (C) ENS-1 detected in CES cells cultivated in proliferating conditions. (D) ENS-1 in CES cells at a higher magnification. All observations were performed by confocal microscopy. Is shown: the signal over the background obtained with the secondary antibodies in the absence of primary antibody. Scale bar 15 μm. The images are representative of three independent experiments.
Figure 3
Figure 3. Subcellular localization of ENS-1 by electron microscopy.
CES were labeled with the 16h4 anti-ENS1 antibody. The secondary antibody was a gold-conjugated anti-mouse antibody (gold particles are seen as black dots). To preserve the affinity of the antibody for ENS-1 a moderate fixative procedure (4% PFA) was performed. Some sub-cellular structures were not well preserved and showed an empty appearance in the cytoplasm. (A) Observation of ENS-1 close to the cytoplasmic membrane Cy mb. (a) Magnification of the rectangle designed in (A).Black arrowheads show the 16h4 dots. (B) Observation at the junction between the cytoplasm Cy and the nucleus Nu. (b) Magnification of the rectangle designed in (B) shows ENS-1 in the chromatin (red arrowheads), in interchromatin spaces (white arrowheads) and in the cytoplasm (black arrowheads). (C) No labeling was obtained in the absence of the 16h4 antibody nor (D) with the anti-human androgen receptor 441 used as negative control in the same conditions. (c) and (d) show magnification of the rectangles designed in (C) and (D) respectively. Non specific dots with the irrelevant primary antibody in (D) and (d) were larger and have irregular outlines when compared with the 16h4 antibody (C) and (c).
Figure 4
Figure 4. Sparse co-localization of ENS-1 and HP1γ in CES nuclei.
(A) Immunostaining of CES cells was performed simultaneously with the rabbit anti- HP1γ (red) and the mouse anti-ENS-1 antibodies (green) detected using Alexa 555 and Alexa 488 conjugated secondary antibodies respectively. DNA was stained with Draq5 (blue). Observations were performed by confocal microscopy. (B) Distribution of ENS-1 and HP1γ in the thickness of CES. The z-cut axis is reported in (A) with a yellow bar on the merge panel. Distribution of HP1γ and ENS-1 is shown in panel a, co-localization of both proteins gives a yellow spot. In panel b the DNA staining was shown and white spots indicate ENS-1 and HP1γ proteins co-localizing on DNA. Individual distributions of ENS-1, HP1γ and DNA merged in a and b are represented in panels c, d and e respectively. (C) Fluorescence intensity for the three labels along the line represented in (A) by the white arrow. The upper panel represents fluorescence intensities obtained for HP1γ (red) and ENS-1 (green), the intensities obtained for chromatin (blue) have been added to the lower panel. Arrows point out co-localizations of HP1γ and ENS-1 in or out the chromatin. Intensity axis is in arbitrary units. (D) Pull-down experiments of 35S-ENS-1 with Flag-HP1γ. Lysates from COS cells transfected with pCi-flag- HP1γ were used as a source for the flag tagged chicken HP1γ protein. 35S labeled ENS-1 proteins were obtained by in vitro translation from pGBKT7 constructs coding for intact or mutated ENS-1 proteins: del CC indicates deletion of the coiled-coil domain (-50AA, 5.56 kDa), mutHP1 box indicates mutation in the HP1 box. After incubation of COS7 cell lysates with different dilutions of the ENS-1 proteins, HP1γ was precipitated with an anti-flag antibody and the association with 35S-ENS-1 was revealed by fluorography. Representative results of at least three different experiments. (E) Confocal analysis of a CES cell entering in mitosis (prometaphase) from the same experiment as in A. In panel a, merge representation of the labeling for ENS-1, HP1γ and DNA as in A. In panel (b), fluorescence intensity along the line represented in panel (a) by the red arrow for the three markers labeled. The panel (c) is a z-cut representation of the same cell.
Figure 5
Figure 5. Western blot analysis of the protein ENS-1.
(A) Proteins (15 μg) of whole cell lysates from murine (MES) and chicken (CES) cells were analyzed by western blot using the anti-ENS-1 3807 antibody. Protein loading was equivalent in both conditions as illustrated by the Ponceau's red staining of the blot. (B) Proteins lysates (20 μg) from CES cells transfected with an HA-tagged ENS-1 protein (lanes 4,5,6) or with an empty vector (lanes 1,2,3) were compared with untransfected cells (WT, lane 7). Triplicates were from three independent transfection experiments. The HA-tagged protein was detected by the 3807 antibody and by the anti-HA antibody at a molecular weight of 60 kDa. The anti-ENS1 antibody also detected the endogenous protein at 55 kDa. Both proteins differed in size by 3 kDa corresponding to the 33 additional amino acids added at the C-terminal part of ENS-1 in the transgenic protein in addition to the two HA tags (2.4 kDa). (C) Western blot analysis of ENS-1 and HP1γ (Chemicon antibody) in whole cell lysates (12 μg) from undifferentiated CES (-RA) or CES induced to differentiate with retinoic acid (RA, 10−6M) for 4 to 48 h as indicated. HSP90 was used as protein loading control.
Figure 6
Figure 6. Subcellular distribution of ENS-1 in CES and during differentiation.
(A) Immunostaining of ENS-1 (16h4 antibody) and HP1γ (Abcam antibody) in CES (-RA) and CES differentiated with retinoic acid for the indicated period. Nuclei are labeled with Draq5 and are in blue in merging panels. Image acquisition was optimized to observe the distribution of the proteins and does not reflect the real expression level. Scale bar 15 μm. (B) Western blot analysis of ENS-1 in the cytoplasmic (Cy) and in the nuclear (Nu) fractions of undifferentiated CES (-RA) or CES induced to differentiate with retinoic acid for 24h or 48h. Ponceau's red staining serves as a protein loading control between both fractions. In the nucleus soluble and insoluble components were separated and only the precipitating fraction that contains ENS-1 is shown. The volume corresponding to 6×10⁶ cells was loaded for the N fraction and Lamin B1 was used as loading control. In the cytoplasm (Cy) ENS-1 was in the supernatant, 15 μg of proteins were loaded and HSP90 was used as loading control. The vertical line indicates missing lanes between the two presented parts of the same gel. Dotted lines in red indicate the position of three ENS-1 related proteins. (C) Separation of soluble and insoluble components from the cytoplasm. The cytoplasmic fraction separated from the nucleus was subjected to extended centrifugation. The pellet (Cy p) and the supernatant (Cy s) were analyzed for ENS-1 protein and HP1γ. The nuclear fraction corresponding to the whole nuclear proteins is represented (Nu). Protein loading was 10 μg for each fraction. HSP90 identifies the cytoplasmic soluble fraction, Lamin B1 identifies fractions containing membrane proteins and 2MeH3K4 identifies fractions containing chromatin. Results in (B) and (C) were obtained from two independent experiments using distinct fractionation protocols. (D) Summary tables of the ENS-1 forms found in the cytoplasm (upper table) and in the nucleus (lower table) from CES cells (-RA) and from CES induced to differentiate with retinoic for 24 h or 48 h.
Figure 7
Figure 7. Presence of two start codons in the Ens-1 5′UTR.
(A) The region containing the two putative start codons in the sequence encoding the whole mRNA (NM_001080873) is represented. The ATG start codon (in red) is the authentic initiation site and generates the 54 kDa protein that has been published previously (NM_001080873.1). The GTG codon (in red) is positioned 96 nucleotides. upstream of the AUG and generates a 57 kDa protein. The purine in positions -3 or +4 from the first base of each start codon is squared (Kozak consensus sequence). (B) Putative sequence of both proteins that only differ by the 3 kDa peptide in N-terminal position represented in bold. (C) Schematic representation of the constructs used to validate the translation initiation from the GTG and the ATG start codons in the 5′ UTR of Ens-1. (D) RNA generated from the constructs depicted in (C) were used for in vitro translation of the luciferase protein in the presence of radioactive methionine. [35S]methionine-labelled proteins were separated on SDS-PAGE and revealed by autoradiography. The position of the luciferase protein (LUC) generated by constructs with only one start codon is indicated (GTG in Ens-1 5′UTR or ATG in CTR). Initiation from the two start codons generates LUC with ATG and a larger protein (LUC+3 kDa) resulting from initiation at the upstream GTG.

References

    1. Macfarlan TS, Gifford WD, Driscoll S, Lettieri K, Rowe HM, et al. (2012) Embryonic stem cell potency fluctuates with endogenous retrovirus activity. Nature 487: 57–63. - PMC - PubMed
    1. Kunarso G, Chia N-Y, Jeyakani J, Hwang C, Lu X, et al. (2010) Transposable elements have rewired the core regulatory network of human embryonic stem cells. Nat Genet 42: 631–634. - PubMed
    1. Pi W, Yang Z, Wang J, Ruan L, Yu X, et al. (2004) The LTR enhancer of ERV-9 human endogenous retrovirus is active in oocytes and progenitor cells in transgenic zebrafish and humans. Proceedings of the National Academy of Sciences of the United States of America 101: 805–810. - PMC - PubMed
    1. Blond J-L, Lavillette D, Cheynet Vr, Bouton O, Oriol G, et al. (2000) An Envelope Glycoprotein of the Human Endogenous Retrovirus HERV-W Is Expressed in the Human Placenta and Fuses Cells Expressing the Type D Mammalian Retrovirus Receptor. Journal of Virology 74: 3321–3329. - PMC - PubMed
    1. Lerat E, Birot AM, Samarut J, Mey A (2007) Maintenance in the chicken genome of the retroviral-like cENS gene family specifically expressed in early embryos. J Mol Evol 65: 215–227. - PubMed

Publication types

MeSH terms

LinkOut - more resources