. 2014 Mar 18;12(3):e1001809.
doi: 10.1371/journal.pbio.1001809. eCollection 2014 Mar.

A functional screen reveals an extensive layer of transcriptional and splicing control underlying RAS/MAPK signaling in Drosophila

Affiliations

A functional screen reveals an extensive layer of transcriptional and splicing control underlying RAS/MAPK signaling in Drosophila

Dariel Ashton-Beaucage et al. PLoS Biol. .

Abstract

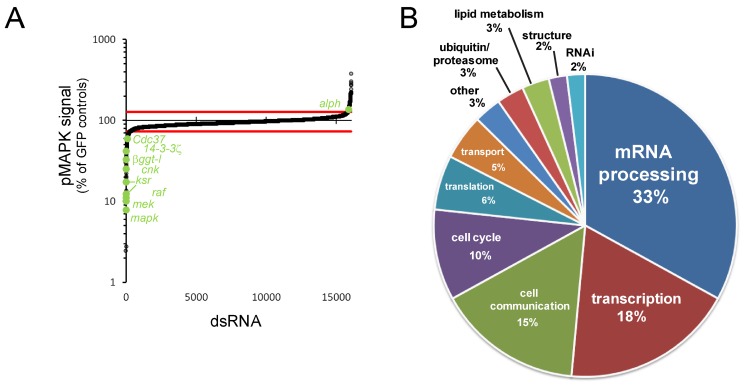
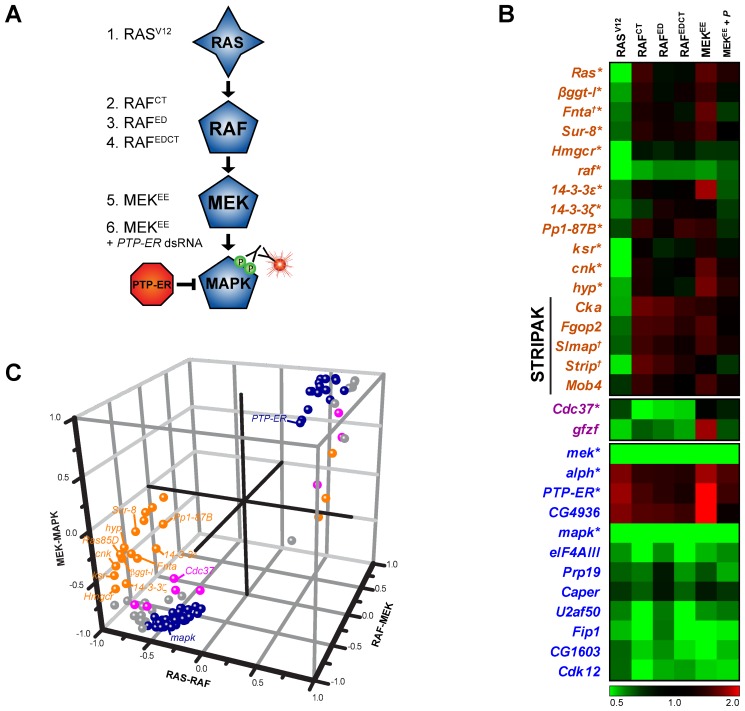
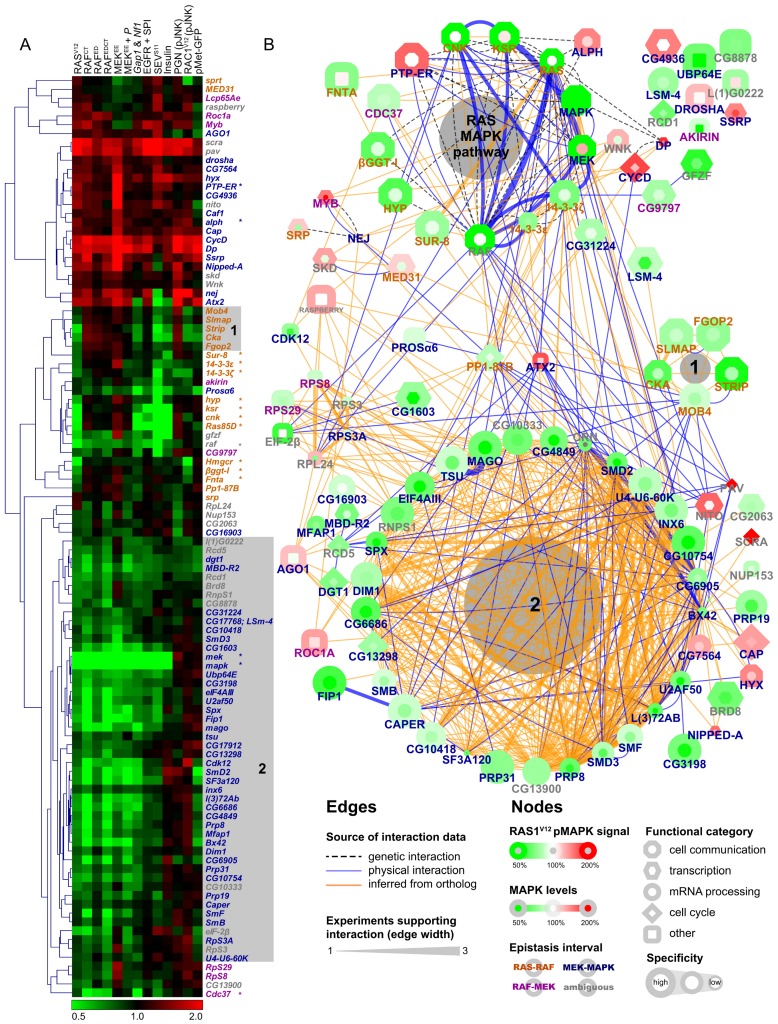
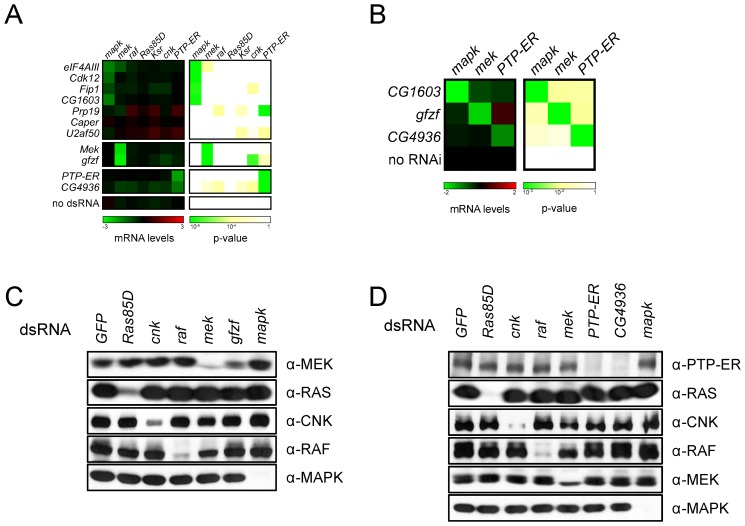
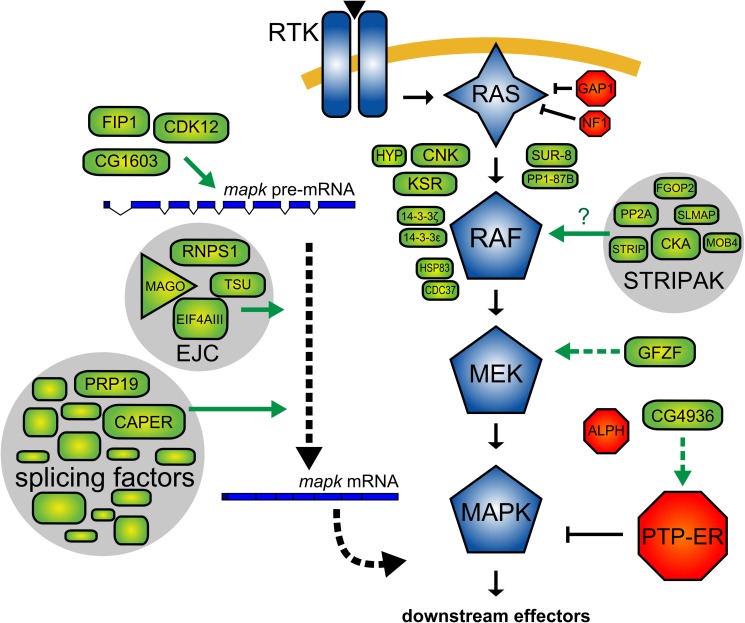
The small GTPase RAS is among the most prevalent oncogenes. The evolutionarily conserved RAF-MEK-MAPK module that lies downstream of RAS is one of the main conduits through which RAS transmits proliferative signals in normal and cancer cells. Genetic and biochemical studies conducted over the last two decades uncovered a small set of factors regulating RAS/MAPK signaling. Interestingly, most of these were found to control RAF activation, thus suggesting a central regulatory role for this event. Whether additional factors are required at this level or further downstream remains an open question. To obtain a comprehensive view of the elements functionally linked to the RAS/MAPK cascade, we used a quantitative assay in Drosophila S2 cells to conduct a genome-wide RNAi screen for factors impacting RAS-mediated MAPK activation. The screen led to the identification of 101 validated hits, including most of the previously known factors associated to this pathway. Epistasis experiments were then carried out on individual candidates to determine their position relative to core pathway components. While this revealed several new factors acting at different steps along the pathway--including a new protein complex modulating RAF activation--we found that most hits unexpectedly work downstream of MEK and specifically influence MAPK expression. These hits mainly consist of constitutive splicing factors and thereby suggest that splicing plays a specific role in establishing MAPK levels. We further characterized two representative members of this group and surprisingly found that they act by regulating mapk alternative splicing. This study provides an unprecedented assessment of the factors modulating RAS/MAPK signaling in Drosophila. In addition, it suggests that pathway output does not solely rely on classical signaling events, such as those controlling RAF activation, but also on the regulation of MAPK levels. Finally, it indicates that core splicing components can also specifically impact alternative splicing.


Conflict of interest statement

The authors have declared that no competing interests exist.

Figures

Figure 1
Figure 1. Primary screen results.
(A) pMAPK signal of primary screen dsRNA probes normalized to GFP dsRNA-treated controls. A majority of expected pathway regulators were identified as hits (labeled in green) outside of the cutoff margins (red lines). (B) Functional distribution of validated hits, based on GO term annotation of Drosophila genes or their predicted homologs.
Figure 2
Figure 2. Epistasis analysis.
(A) MAPK pathway models depicting the secondary screen assays used to conduct the epistasis analysis. See Text S1 for full secondary assay information. (B) Epistasis screen results are shown for bona fide MAPK pathway components as well as a selection of candidates. Results are presented as pMAPK values normalized to GFP dsRNA treated controls. Bona fide MAPK pathway components are identified with an asterisk (*). Genes to which we have associated new gene symbols are marked with a cross (†). (C) Known pathway components (labeled) and experimental candidates are assigned to specific epistasis intervals. The calculated Pearson correlation r between the epistasis screen data profiles and the three predetermined profiles for epistasis intervals (see Methods) are represented on three axes (x-axis, RAS-RAF; y-axis, MEK-MAPK; z-axis, RAF-MEK). Values near 0 represent poor correlation while values near 1 (negative regulators) or −1 (positive regulators) indicate high correlation with a given epistasis profile. Candidates were assigned to the RAS-RAF (orange), RAF-MEK (magenta), or MEK-MAPK (dark blue) interval on the basis of the highest distance value. Candidates that could not be assigned to a specific interval (distance values within [−0.5, 0.5]) are shown in grey. Detailed epistasis screen results are available in Table S3.
Figure 3
Figure 3. Predicted protein complexes have similar secondary screen functional profiles.
(A) Unsupervised hierarchical clustering of secondary screen results. The 13 secondary assays are listed at the top of the clustering diagram. Bona fide MAPK pathway components are identified with an asterisk. (B) Protein interaction network (PIN) assembled using interaction data from Drosophila and homologs from other species. Edge color represents the source of the interaction data and edge width denotes the number of distinct experimental evidences for a given interaction. The coloring of the node border represents RASV12 screen results while the coloring of the node center reflects MAPK protein levels. Node shapes reflect the functional category of the hits and specificity results are represented by the size of nodes. In both panels, epistasis results are represented by the coloring of gene symbols in orange (RAS-RAF), magenta (RAF-MEK), dark blue (MEK-MAPK), or grey (ambiguous). MAPK pathway components, STRIPAK (shaded area 1) and splicing factors (shaded area 2) group together in both the clustering analysis and PIN. Note that the full name is used for the gene raspberry, instead of ras, to avoid confusion with Ras85D.
Figure 4
Figure 4. Screen candidates modify the expression of RAS/MAPK components.
(A) The transcript levels of RAS/MAPK components are altered by the depletion of some candidates. All candidates were tested in an initial qPCR secondary screen; the results shown here are from a separate qPCR confirmation experiment (see Text S1). The left panel shows transcript levels for the RAS/MAPK components listed on the top following treatment with the indicated dsRNAs (labels to the left). mRNA levels are expressed as log2 ratios of GFP dsRNA treated controls. The right panel shows the associated p-values (unpaired two-tailed Student's t-test). dsRNA targeting gfzf had a similar effect to the mek dsRNA with a −2.86 reduction in mek transcript levels (p-value, 4.2×10⁻⁸). CG4936 dsRNA caused a −1.37 reduction in PTP-ER transcript levels (p-value, 1.2×10⁻⁸), which was slightly weaker than the −1.88 reduction (p-value, 3.0×10⁻⁹) measured for the PTP-ER dsRNA. Cdk12, Fip1, and CG1603 dsRNAs behaved similarly to eIF4AIII dsRNA, used as a control for mapk transcript depletion, with mapk transcript levels <−0.75 and a p-value<1×10⁻⁴. (B) In vivo RNAi experiments confirm cell culture qPCR results. Hairpin RNAi constructs were expressed in larvae under the control of a heat shock-inducible flip-out actin promoter. qPCR experiments were performed on L3 eye disc lysates. mRNA levels are expressed as log2 ratios of a no RNAi control (flies carrying the flip-out promoter without a RNAi construct). Results were similar to those in cell culture qPCR experiments in (A): CG1603 RNAi caused a reduction in mapk levels (−2.06; p-value, 5.3×10⁻⁴), gfzf RNAi reduced mek levels (−1.66; p-value, 5.4×10⁻⁴), and CG4936 reduced PTP-ER levels (−1.06; p-value, 5.7×10⁻⁴). (C and D) The levels of RAS/MAPK pathway components in S2 cells were evaluated by Western blot with the indicated antibodies (labels to right of panel) following treatment with the indicated dsRNA reagents (top labels). (C) Mirroring the qPCR data, a specific depletion of MEK levels was observed in gfzf dsRNA treated cells. (D) Also in agreement with the qPCR data, a specific decrease in PTP-ER levels was observed upon depletion of CG4936.
Figure 5
Figure 5. Splicing factors cause a decrease in MAPK protein levels.
(A) Candidates were tested in an immunofluorescence-based secondary screen to evaluate their impact on MAPK protein levels. The results from this experiment show that RNA processing factors (red) cause a reduction in MAPK levels without impacting AKT (used as a negative control). This impact is similar to that which was observed for EJC components (blue). mapk and Akt dsRNA positive controls are also shown (green). (B) The specific effect on MAPK levels is confirmed by Western blot for both Prp19 and Caper dsRNA treated samples. The impact on MAPK is similar, albeit slightly weaker, to that observed following eIF4AIII depletion. The levels of other MAPK pathway components (RAS, RAF, and MEK) as well as other signaling pathway components (AKT and JNK) did not appear to vary significantly following depletion of these factors.
Figure 6
Figure 6. RNAi screen candidates interact genetically with RAS/MAPK pathway components.
(A–J) The RasV12 rough eye phenotype is dominantly suppressed by heterozygous mutations in Cka, gfzf, CG1603, Fip1, Prp19, Caper, and a trans-heterozygous mutation in CG4936. Fly eyes of the indicated genotypes were imaged by stereomicroscopy. The mapk alleles mapkE1171 and rl1 are used as positive controls. All fly eye images are from female flies except CG4936DG10305/CG4936EY10172, which is from a male fly; the rough eye phenotype was observed to be similar in males and females except in this case where males displayed a stronger genetic interaction. (K–N) Genetic interactions with rl1 wing vein deletion phenotypes. rl1/rl1 flies display a slight deletion of the mid-section of the L4 wing vein that is not fully penetrant. The L4 deletion is enhanced, sometimes extending to the posterior cross vein (pcv) in Prp19CE162 and Caperf07714 heterozygous backgrounds (pictures shown served to illustrate detailed scoring results in Figure S8H). (O–R) Genetic interactions with rl1 rough-eye phenotypes. The weak rough eye phenotype observed in rl1 homozygotes is shown. The severity of this phenotype is increased in heterozygous mutant backgrounds for Prp19 and Caper; these flies display a further decrease in eye size and an increased eye roughness.
Figure 7
Figure 7. In vivo evidence of impact of RAS/MAPK signaling.
(A) Impact of candidates on RasV12-induced hemocyte proliferation. A Hemolectin-Gal4 driver was used to co-express RASV12 (on either Chromosome 2 or 3) with the RNAi constructs or a UAS-lacZ control. GFP positive hemocytes were counted by automated microscopy. The total hemocyte count is expressed as log10 ratio of the RasV12 control (second chromosome UAS-RasV12 fly line). Expression of RasV12 increased hemocyte count by approximately 100-fold compared to a UAS-mcherry RNAi negative control without RasV12. Co-expression of a mapk RNAi with RasV12 was used as a control for reduced proliferation. A Student's t-test (unpaired, two-tailed) was performed comparing candidates to the appropriate RasV12 control. (B–D) 3rd instar larval imaginal discs showing reduction in MAPK protein levels in GFP positive clones expressing RNAi hairpin constructs. Two different Prp19 RNAi constructs were tested in wing imaginal discs (one is shown here) and found to produce a slight, but consistent reduction in MAPK levels in the clonal tissue. This was more visible in clones with a stronger GFP signal and was sometimes accompanied by signs of apoptosis (small GFP positive fragments), which are visible in (D).
Figure 8
Figure 8. Prp19 and Caper regulate mapk AS.
(A) Schematic representation of the four annotated mapk splice isoforms observed in S2 cells. Exons are numbered from I to VIII based on the rl-RE transcript for simplicity in addition to the official Flybase exon names (e.g., “rl:14”). Introns lengths are also indicated. (B) An RT-PCR assay encompassing the entire mapk transcript (primers bind in exons I and VIII) for the four principle mapk isoforms is used to evaluate changes in the mapk transcript. In the untreated and GFP dsRNA controls, the two most abundant bands on the gel correspond to the RD isoform (topmost) and the RB/RE isoform (immediately below RD). Both Caper and Prp19 knockdown are found to cause important shifts in the abundance and length of the mapk transcript (red labels), which differ from those produced by the depletion of the EJC component, eIF4AIII (blue labels). By default, all labels refer to the RB/RE isoform unless otherwise indicated. (C) Sequencing of the RT-PCR products from (B) reveals that the shorter products can be attributed to exon skipping events. In particular, exons IV and VII are the most frequently skipped following Caper and Prp19 knockdown. This contrasts with eIF4AIII knockdown where we previously observed skipping of multiple consecutive exons . The proportion of normal “N,” truncated “T,” and frameshifted “F” protein products is also indicated for the sequenced transcripts. (D) Caper and Prp19 cause a shift from the RB/RE/RF forms towards the RD form, which is characterized by retention of the first intron. (E) Exon-exon junction spanning primers are used to detect specific exon skipping events (top panels). Skipping of exons II–III (second row) and exons II–IV (third row) is more abundant in eIF4AIII depleted cells. Exon IV (fourth row) and exon VII (fifth row) skipping is more prevalent following Caper and Prp19 knockdown. Exon IV and VII skipping could also be detected using assays in which both primers lie within an exon region (bottom panels).
Figure 9
Figure 9. Regulatory input at the level of MEK, PTP-ER, and MAPK expression adds another layer to the network of factors that control RAS/MAPK signaling.
Schematic model of proteins associated with RAS/MAPK signal transmission discussed in this work. Components used in secondary screens (GAP1, NF1) are also depicted. Sur-8, PP1-87B, and the five STRIPAK complex components were positioned between RAS and RAF in our epistasis assays. Their position would be consistent with a role in the RAF activation process. As it has been previously shown in mammalian models, SUR-8 and PP1 may be acting on RAF activation by dephosphorylating the N-terminal 14-3-3 binding site. Because PP2A is also known to dephosphorylate this site and because STRIPAK has been characterized as a PP2A-associated complex, STRIPAK may be involved in facilitating PP2A binding to RAF. GFZF was positioned at the level of MEK and was found to impact MEK expression, presumably by regulating mek transcription. CG4936 was found to impact expression of the MAPK phosphatase, PTP-ER, and also probably acts at the level of transcriptional regulation. CG1603, FIP1, and CDK12 were found to act on MAPK expression, most likely acting as transcriptional regulators (CG1603) or involved in transcript maturation/processing (FIP1 and CDK12). Finally, components of the spliceosome, splicing factors and the EJC were found to modulate MAPK expression by altering the splicing of the mapk transcript. The particular sensitivity of MAPK to disruption of these spliceosome components may be due to their involvement in recruiting specific mRNA processing factors such as the EJC. Alternatively, the reason why mapk displays an increased requirement for this set of spliceosome components may be due to a feature in mapk's gene structure. For example, intron length is correlated with sensitivity of transcripts to EJC depletion .

References

    1. McKay MM, Morrison DK (2007) Integrating signals from RTKs to ERK/MAPK. Oncogene 26: 3113–3121. - PubMed
    1. Turjanski AG, Vaque JP, Gutkind JS (2007) MAP kinases and the control of nuclear events. Oncogene 26: 3240–3253. - PubMed
    1. Gineitis D, Treisman R (2001) Differential usage of signal transduction pathways defines two types of serum response factor target gene. J Biol Chem 276: 24531–24539. - PubMed
    1. Pulverer BJ, Kyriakis JM, Avruch J, Nikolakaki E, Woodgett JR (1991) Phosphorylation of c-jun mediated by MAP kinases. Nature 353: 670–674. - PubMed
    1. Kolch W (2005) Coordinating ERK/MAPK signalling through scaffolds and inhibitors. Nat Rev Mol Cell Biol 6: 827–837. - PubMed

Publication types