. 2014 Mar 18:5:3434.
doi: 10.1038/ncomms4434.

Size and frequency of natural forest disturbances and the Amazon forest carbon balance

Affiliations
Free PMC article

Size and frequency of natural forest disturbances and the Amazon forest carbon balance

Fernando D B Espírito-Santo et al. Nat Commun. .
Free PMC article

Erratum in

  • Corrigendum: Size and frequency of natural forest disturbances and the Amazon forest carbon balance.
    Espírito-Santo FD, Gloor M, Keller M, Malhi Y, Saatchi S, Nelson B, Oliveira Junior RC, Pereira C, Lloyd J, Frolking S, Palace M, Shimabukuro YE, Duarte V, Mendoza AM, López-González G, Baker TR, Feldpausch TR, Brienen RJ, Asner GP, Boyd DS, Phillips OL. Espírito-Santo FD, et al. Nat Commun. 2015 Apr 2;6:6638. doi: 10.1038/ncomms7638. Nat Commun. 2015. PMID: 25833221 Free PMC article. No abstract available.

Abstract

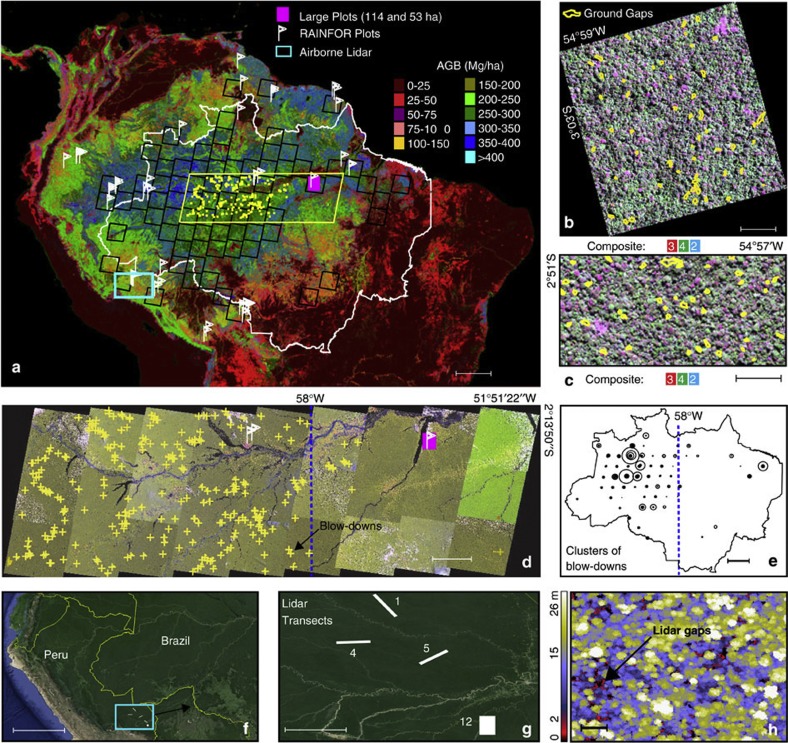
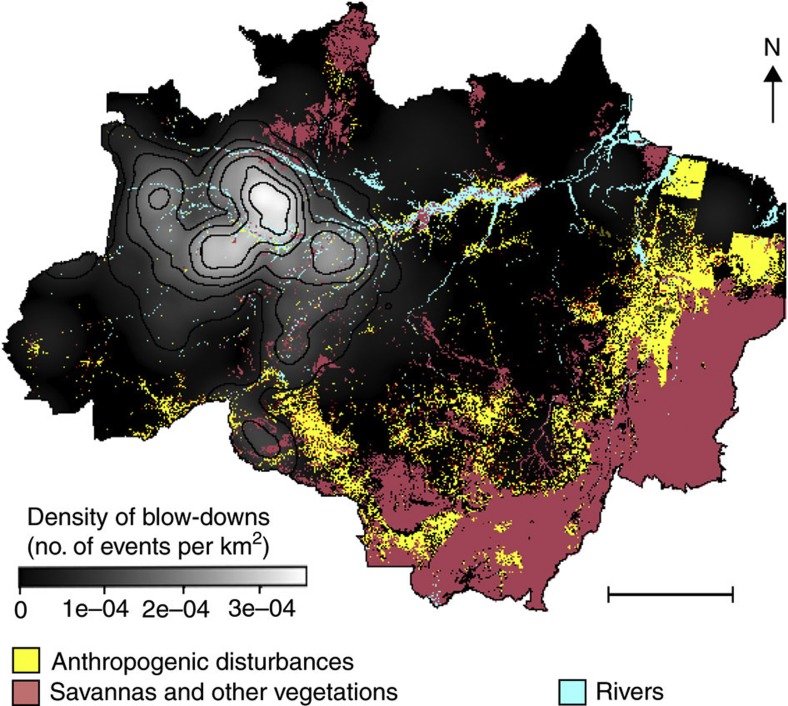
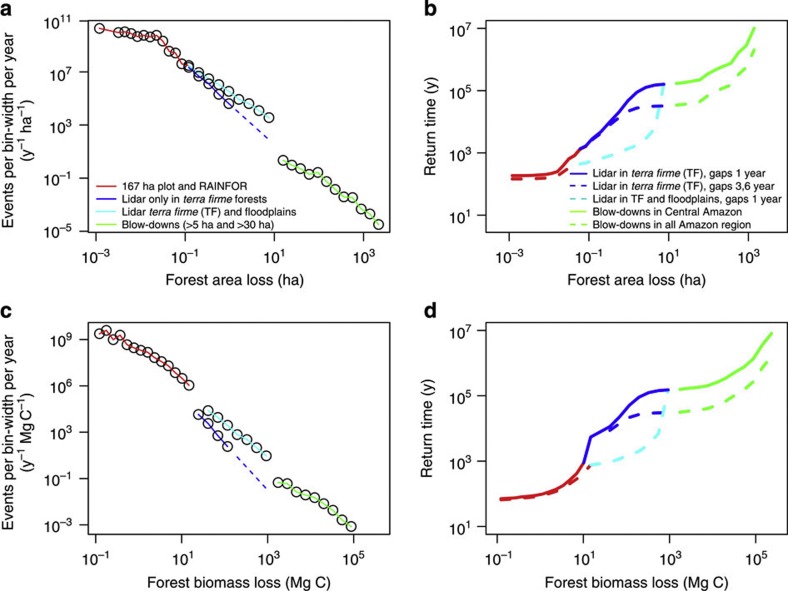
Forest inventory studies in the Amazon indicate a large terrestrial carbon sink. However, field plots may fail to represent forest mortality processes at landscape-scales of tropical forests. Here we characterize the frequency distribution of disturbance events in natural forests from 0.01 ha to 2,651 ha size throughout Amazonia using a novel combination of forest inventory, airborne lidar and satellite remote sensing data. We find that small-scale mortality events are responsible for aboveground biomass losses of ~1.7 Pg C y(-1) over the entire Amazon region. We also find that intermediate-scale disturbances account for losses of ~0.2 Pg C y(-1), and that the largest-scale disturbances as a result of blow-downs only account for losses of ~0.004 Pg C y(-1). Simulation of growth and mortality indicates that even when all carbon losses from intermediate and large-scale disturbances are considered, these are outweighed by the net biomass accumulation by tree growth, supporting the inference of an Amazon carbon sink.


Figures

Figure 1
Figure 1. Amazon Basin-wide data of natural forest disturbances.
(a) Spatial distribution of RAINFOR forest census plots (n=135), inspected Landsat images (n=137) with occurrences of large blow-down disturbances ≥30 ha (ref. 26) (black boxes, n=330 blow-downs) and ≥5 ha (ref. 25) (yellow dots, n=279 blow-downs) underlain by an ABG map of the Amazon. White, yellow and turquoise in (a) indicate the Brazilian border, the mosaic of Landsat images in the Central Amazon (as shown in (d)), and the lidar airborne campaigns in Peru, respectively. (b) Large forest inventory plot of 114 ha (ref. 23) with ground gaps (yellow polygons, n=55) overlain on a high-resolution IKONOS-2 image acquired in 2008 in the Eastern Amazon. (c) Large plot of 53 ha (ref. 23) with ground gaps (n=51) over a second high-resolution IKONOS-2 image acquired in 2009. (d) Digitally classified blow-downs in an East-West mosaic of Landsat images from the Central Amazon. (e) Representation of disturbance size areas found in all Landsat images—blow-downs disturbances ≥30 ha areas are proportional to the size of the circles. (f) Location of the lidar airborne campaigns in the Southern Peruvian Amazon (turquoise box). (g) Lidar data collections in four large transects of tropical forest (48,374 ha, n=30,130 gaps ≥20 m2 in erosional terra firme and depositional forests). (h) Details of the detection of gaps in lidar canopy height model (CHM)—a 2 m height threshold was used to detect tree-fall gaps in CHM (h). Composite in (b) and (c) means colour compositions of IKONOS-2 image at full-width wavelength for three bands: (2) green 0.51–0.60 μm, (3) red 0.63–0.70 μm and (4) NIR 0.76–0.85 μm. Dashed blue lines in Landsat images (d) and central Brazilian Amazon (e) divides the areas with high frequency of blow-downs (≥5 ha) between 58°00′W and 66°49′W (western Amazon) and where blow-downs are infrequent in the eastern basin (51°51′W to 58°00′W). Legends of scale-bar for all areas (ah) are 500km, 0.2km, 0.2km, 90km, 500km, 572km, 45km and 0.5 km, respectively.
Figure 2
Figure 2. Spatial distribution of large disturbances in the Brazilian Amazon.
Cluster map of blow-downs of Brazilian Amazon using a Gaussian smoothing kernel with bandwidth of 200 km modelled from 330 large disturbances ≥30 ha detected in 137 Landsat images over the Amazon region. Colour bar is the intensity of large disturbances in the Amazon (number of blow-downs per km2). Legend of scalebar for the map of blow-down density is 500 km.
Figure 3
Figure 3. Estimated frequency distributions of natural forest disturbances in the Amazon.
(a) Number of disturbances per year obtained by scaling observed events to the full Amazon region by multiplication with the inverse of observed area fraction. Number density of disturbances per year obtained from a histogram and dividing the resulting numbers by histogram bin-width. Bin-widths are chosen such as to include at least one event; the number density follows approximately Δlog (number of occurrences)/Δlog (disturbance size)≈−2.5. (b) Return intervals versus severity of events calculated using the inverse of the cumulative PDF (see Methods) for various combinations of the data from repeated plot measurements, lidar surveys and Landsat imagery. For (a) and (b) largest blow-downs (those detected by Landsat imagery) are scaled to the region by multiplication of Amazon area fraction with large blow-downs. Panels (c) and (d) are similar to (a) and (b) but with respect to disturbance biomass loss instead of disturbance area. In (b,d) solid lines correspond to the case where large blow-downs are included only in the Central Amazon while the dashed lines correspond to the case where largest blow-downs are assumed to occur everywhere in the region (as a sensitivity study) and similarly the dashed light blue line corresponds to the case where also floodplain lidar data with river-driven disturbances are included (note that the forest plot network is based overwhelmingly on non-floodplain plots).

References

    1. Schimel D. S. et al. Recent patterns and mechanisms of carbon exchange by terrestrial ecosystems. Nature 414, 169–172 (2001). - PubMed
    1. Sarmiento J. L. et al. Trends and regional distributions of land and ocean carbon sinks. Biogeosciences 7, 2351–2367 (2010).
    1. Grace J. et al. Carbon-dioxide uptake by an undisturbed tropical rain-forest in southwest Amazonia, 1992 to 1993. Science 270, 778–780 (1995).
    1. Malhi Y. et al. The regional variation of aboveground live biomass in old-growth Amazonian forests. Glob. Chang. Biol. 12, 1107–1138 (2006).
    1. Saatchi S. S., Houghton R. A., Alvala R. C. D. S., Soares J. V. & Yu Y. Distribution of aboveground live biomass in the Amazon basin. Glob. Chang. Biol. 13, 816–837 (2007).

Publication types