. 2014 Mar 18;12(3):e1001810.
doi: 10.1371/journal.pbio.1001810. eCollection 2014 Mar.

Dual PDF signaling pathways reset clocks via TIMELESS and acutely excite target neurons to control circadian behavior

Affiliations

Dual PDF signaling pathways reset clocks via TIMELESS and acutely excite target neurons to control circadian behavior

Adam Seluzicki et al. PLoS Biol. .

Abstract

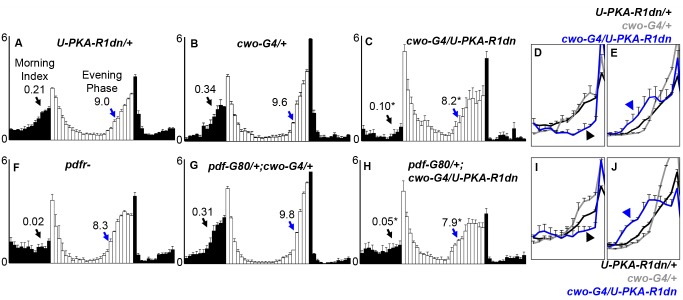
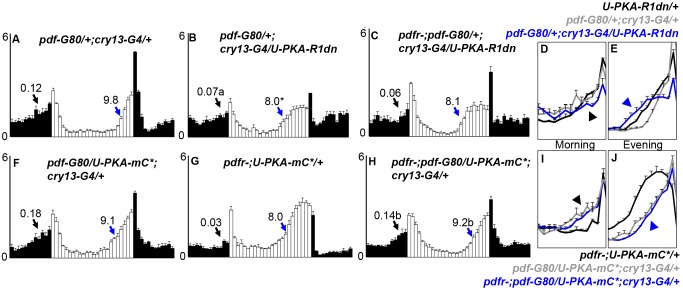
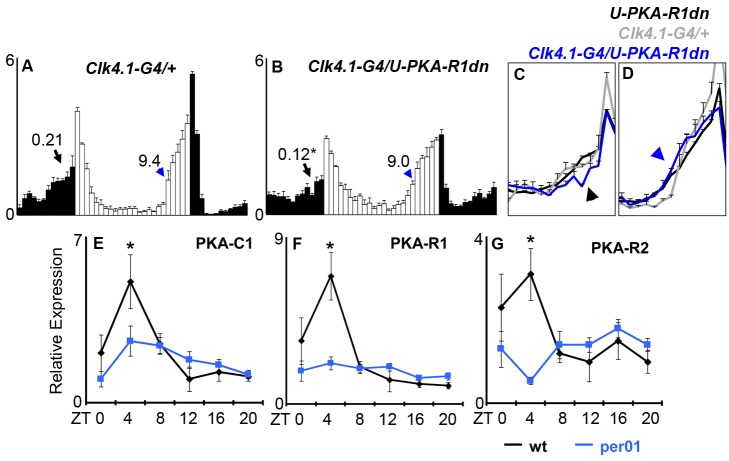
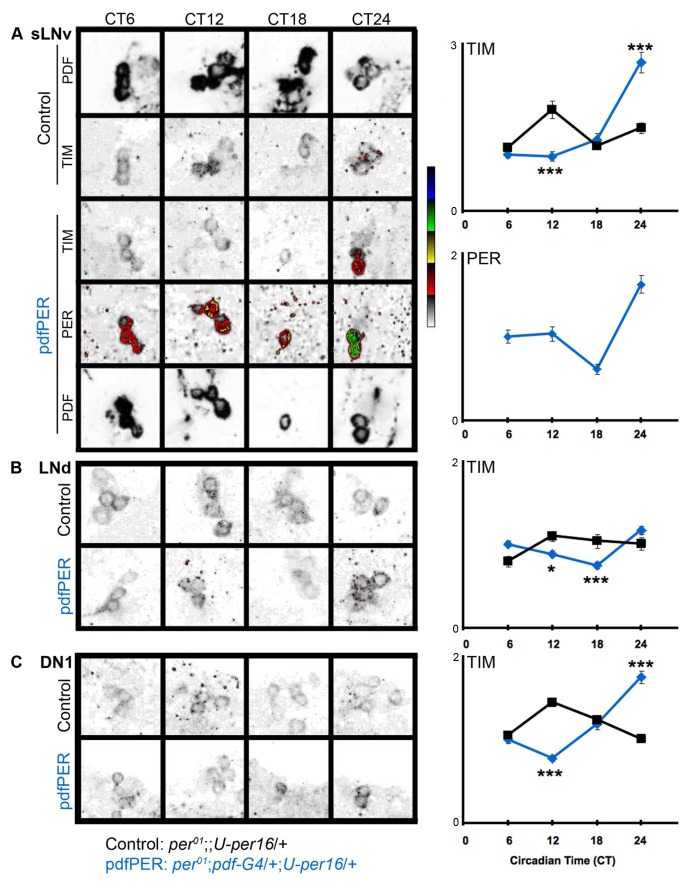
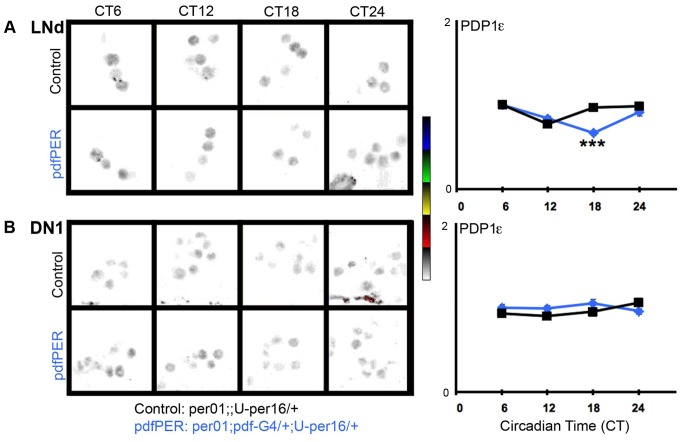
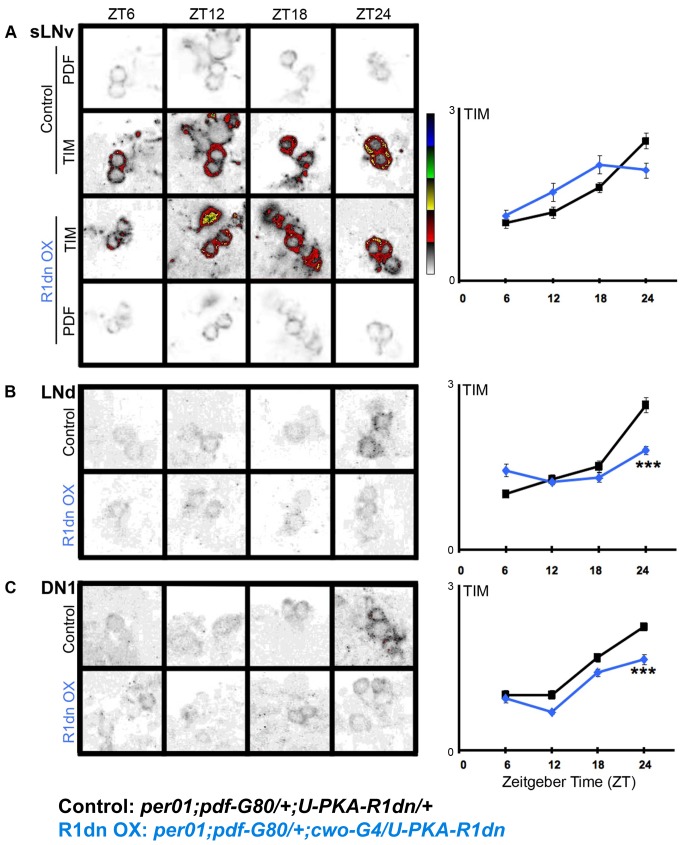
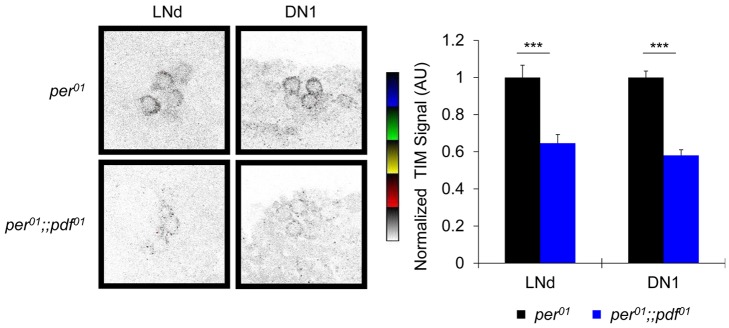
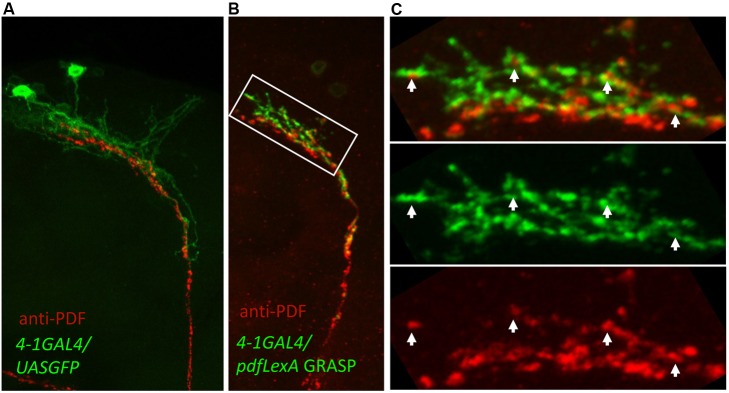
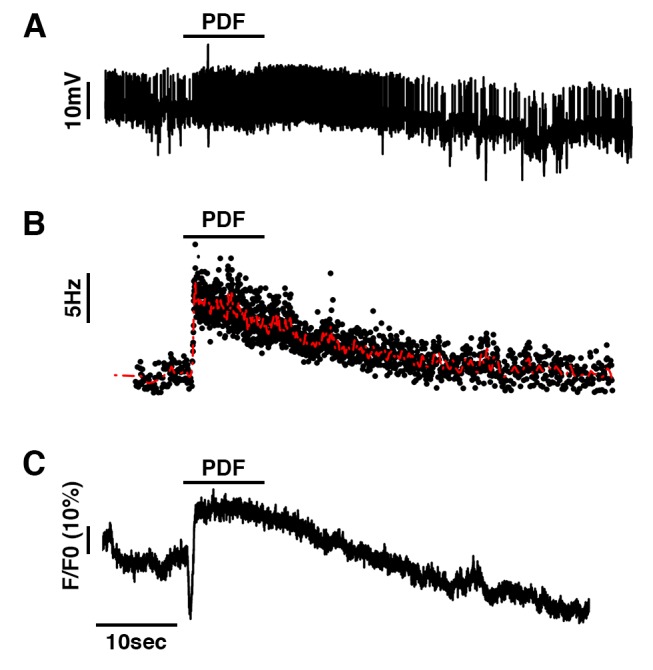
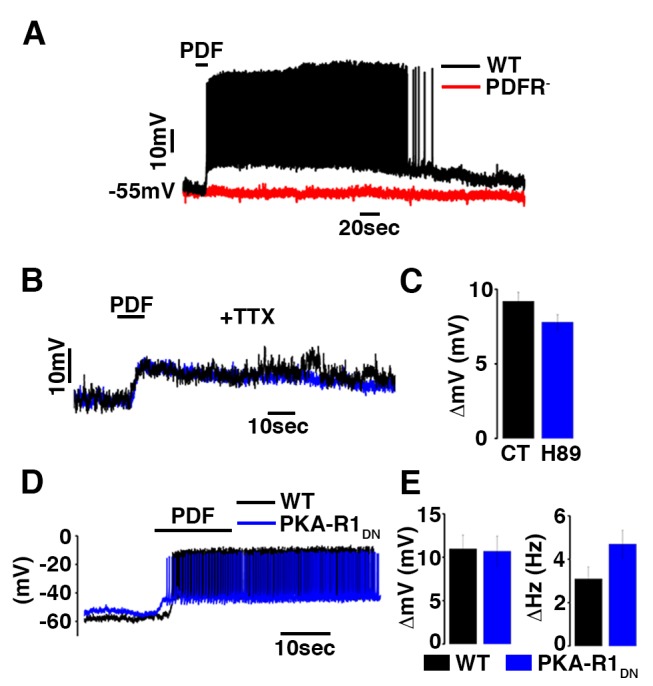
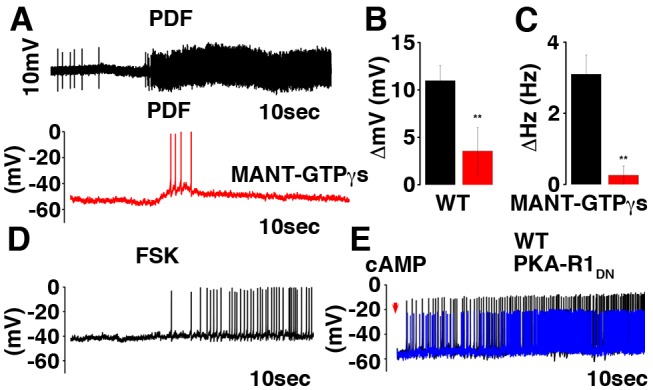
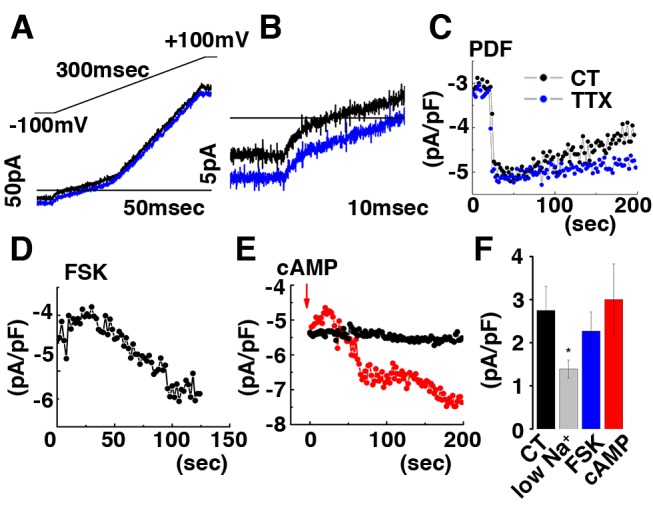
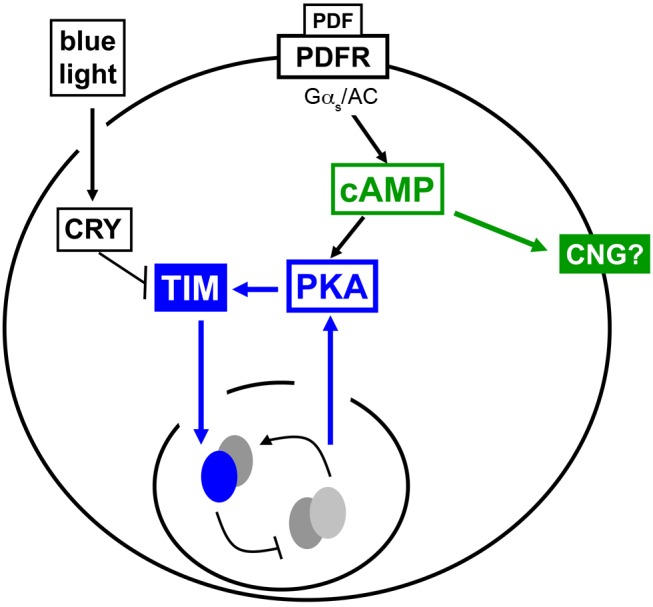
Molecular circadian clocks are interconnected via neural networks. In Drosophila, PIGMENT-DISPERSING FACTOR (PDF) acts as a master network regulator with dual functions in synchronizing molecular oscillations between disparate PDF(+) and PDF(-) circadian pacemaker neurons and controlling pacemaker neuron output. Yet the mechanisms by which PDF functions are not clear. We demonstrate that genetic inhibition of protein kinase A (PKA) in PDF(-) clock neurons can phenocopy PDF mutants while activated PKA can partially rescue PDF receptor mutants. PKA subunit transcripts are also under clock control in non-PDF DN1p neurons. To address the core clock target of PDF, we rescued per in PDF neurons of arrhythmic per⁰¹ mutants. PDF neuron rescue induced high amplitude rhythms in the clock component TIMELESS (TIM) in per-less DN1p neurons. Complete loss of PDF or PKA inhibition also results in reduced TIM levels in non-PDF neurons of per⁰¹ flies. To address how PDF impacts pacemaker neuron output, we focally applied PDF to DN1p neurons and found that it acutely depolarizes and increases firing rates of DN1p neurons. Surprisingly, these effects are reduced in the presence of an adenylate cyclase inhibitor, yet persist in the presence of PKA inhibition. We have provided evidence for a signaling mechanism (PKA) and a molecular target (TIM) by which PDF resets and synchronizes clocks and demonstrates an acute direct excitatory effect of PDF on target neurons to control neuronal output. The identification of TIM as a target of PDF signaling suggests it is a multimodal integrator of cell autonomous clock, environmental light, and neural network signaling. Moreover, these data reveal a bifurcation of PKA-dependent clock effects and PKA-independent output effects. Taken together, our results provide a molecular and cellular basis for the dual functions of PDF in clock resetting and pacemaker output.


Conflict of interest statement

The authors have declared that no competing interests exist.

Figures

Figure 1
Figure 1. Expression of a dominant-negative PKA regulatory subunit (PKA-R1dn) can phenocopy pdfr- behavior phenotypes.
Histograms are normalized activity profiles of flies in 12;12 h dark (LD). Black bars indicate activity occurring in the dark phase, white bars indicate activity occurring in the light phase. Error bars are SEM. Genotype (N). (A) U-PKA-R1dn/+ (74), (B) cwo-G4/+ (16), (C) cwo-G4/U-PKA-R1dn (16), (F) pdfr- (32), (G) pdfG80/+;cwo-G4/+ (45), (H) pdf-G80/+;cwo-G4/U-PKA-R1dn (32). Blue arrowheads and associated values (onset time in ZT ± SEM) indicate the onset of evening activity as described , with the onset time defined as the first point in the largest increase in activity calculated over a 2-h (four 30-min bins) sliding window. Black arrowheads and associated values (morning index ± SEM) indicate morning anticipation. Morning index was calculated using a variant of the method described in (See Materials and Methods for details on behavior quantification methods). (D,E,I,J) magnified overlays of morning (D, I) and evening (E, J) for the indicated color-coded genotypes. Graphs show the 6 h prior to the D>L (morning) or L>D (evening) transitions, as well as the first bin of the L or D phase, respectively. *p<0.05 versus both G4 and U parental controls.
Figure 2
Figure 2. Non-PDF (E-cell) pacemaker neuron specific modulation of PKA activity can phenocopy or rescue pdfr- behaviors.
E-cells were targeted using cry13-G4 and pdf-G80. U-PKA-mC* is a constitutively active PKA catalytic subunit that lacks the ability to bind to regulatory subunits. Graphs are as in Figure 1. Genotype (N). (A) pdf-G80/+;cry13-G4/+ (15), (B) pdf-G80/+;cry13-G4/U-PKA-R1dn (10), (C) pdfr-;pdf-G80/+;cry13-G4/U-PKA-R1dn (26), (F) pdf-G80/U-PKA-mC*;cry13-G4/+ (15). (G) pdfr-;U-PKA-mC*/+ (22), (H) pdfr-;pdf-G80/U-PKA-mC*;cry13-G4/+ (48). (D,E,I,J) magnified overlays of morning (D,I) and evening (E,J) for the indicated color-coded genotypes as in Figure 1. *p<0.05 versus both G4 and UAS parental controls. a, p<0.05 versus UAS parental control, p = 0.056 versus G4 parental control. b, p<0.05 versus pdfr-;U-PKA-mC*/+, not significant versus pdf-G80/U-PKA-mC*;cry13-G4/+. Complete quantification appears in Table 1.
Figure 3
Figure 3. PKA function in DN1p neurons.
(A) Reduction of PKA activity in DN1p has no effect on the phase of evening activity, but reduces morning anticipation. Graphs are as in Figure 1. Genotype (N). (A) Clk4.1-G4/+ (19), (B) Clk4.1-G4/U-PKA-R1dn (14). (C and D) are overlays of morning and evening activity as in Figure 1. PKA subunits are transcriptionally regulated by the circadian clock in DN1ps. DN1ps were marked with Clk4.1-G4>U-GFP in wt (black) or per01 (blue) background, dissociated, sorted, and analyzed by quantitative RT-PCR for PKA subunit transcripts (see Materials and Methods). (E) PKA-C1, (F) PKA-R1, (G) PKA-R2. Error bars are SEM.
Figure 4
Figure 4. PDF cell clocks specifically target TIM in LNds and DN1s in constant darkness.
Single confocal slices showing PDF, PER, and TIM staining. per01;;U-per/+ (control, black lines) and per01;pdf-G4/+;U-per/+ (pdfPER, blue lines). sLNvs are marked with anti-PDF. TIM and PER images are displayed in NIH ImageJ lookup table 5 Ramps (inverted) for visibility. PDF images used to identify sLNv are in gray scale. Cells (N): (A) sLNv (53–87), (B) LNd (74–122), (C) DN1 (57–208). Average cell intensities were normalized to PPP CT6 = 1 before combining measurements from three (TIM) experiments. In some cases error bars (SEM) are very small and obscured by the data point. In no case were error bars omitted. *p<0.05, **p<0.01, ***p<0.001.
Figure 5
Figure 5. The PDF-cell clock does not impact PDP1ε in non-PDF clock neurons.
Labels and nomenclature are the same as in Figure 4. PDP1ε images are displayed in NIH ImageJ lookup table 5 Ramps (inverted) for visibility. Cell group (N): (A) LNd (88–125), (B) DN1 (175–281). *p<0.05, **p<0.01, ***p<0.001.
Figure 6
Figure 6. cwo-G4>U-PKA-R1dn expression reduces TIM levels in the absence of PER in LD.
PKA-R1dn was expressed broadly in the circadian system using cwo-G4 and restricted from PDF cells using pdf-G80. Data are displayed as in Figure 4. Cell group (N): (A) sLNv (36–90), (B) LNd (49–130), (C) DN1 (42–195). *p<0.05, **p<0.01, ***p<0.001.
Figure 7
Figure 7. Loss of PDF reduces TIM levels in non-PDF circadian neurons.
TIM staining in the per01 mutant background was compared in the presence or absence of endogenous PDF. Brains were collected and fixed at CT24 of DD1. Images are displayed as in Figures 4–6. Bar graphs are normalized TIM staining intensity measurements combined from two independent experiments. Cell group (N): LNd (85–92), DN1 (112–135). ***p<0.001.
Figure 8
Figure 8. PDF(+) sLNv make direct synaptic connections with DN1p neurons.
(A) PDF-labeled sLNv terminals in the dorsal brain (red) are tightly intermingled with DN1p neurites marked by membrane-GFP expression using the Clk4.1-G4 driver. (B) GRASP labeling (green) demonstrates direct cell-cell contact between the DN1p and anti-PDF labeled sLNv (red). (B) Reconstituted GFP label (green) is observed only at putative points of contact between the two cell groups. (C) Higher magnification of the region outlined in (B) reveals close apposition of the two labels (white arrowheads) but little overlap, delineating the synaptic architecture.
Figure 9
Figure 9. PDF induces an increase in [Ca2+]i in the DN1p neurons.
Representative current clamp recordings obtained in cell-attached mode showing on the same cell (A) depolarization, (B) increase in instant firing frequency, and (C) increase in [Ca2+]i in U-GcaMP6f/+;Clk4.1-G4/+ male flies (n = 3).
Figure 10
Figure 10. PDF induces depolarization and increase in firing frequency in DN1p neurons.
(A) Representative current clamp recordings obtained from UAS-CD8 GFP;Clk4.1M-Gal4 male flies showing the depolarization and increase in firing frequency in control or in PDFR mutant (WT in black, PDFR in red, n = 3). (B) Representative recordings showing the membrane potential in the presence of TTX in control (black, Δ = 9.2±0.6 mV, n = 3) or with a PKA inhibitor (H89- blue, Δ = 7.8±0.5 mV, n = 3). Mean ± SEM are shown in the histogram (C). (D) Representative recordings showing the PDF induced depolarization control (black, [Δ = 11±1.6 mV, and Δ = 3.4±0.46 Hz n = 5]) or in PKA-R1dn (blue, [Δ = 10.7±1.73 mV, and Δ = 4.7±0.64 Hz n = 4]). Mean ± SEM are shown in the histogram (E).
Figure 11
Figure 11. PDF-induced depolarization and increase in firing frequency are dependent on adenylate cyclase.
(A) Representative current clamp recordings obtained from the same cell in cell attached configuration first (black trace, before AC inhibitor) and then in whole cell configuration (red trace, after 10 minute dialysis of MANT-GTPγS into the cell). Mean ± SEM are shown in the histogram for changes in the membrane potential (B) and firing frequency (C) (respectively Δ = 11±1.6 mV, and Δ = 3.4±0.46 Hz n = 5 in control and Δ = 3.56±2.46 mV, and Δ = 0.26±0.26 Hz n = 5 after AC inhibition). Representative current clamp recordings showing the effects of AC activation by application of forskolin 20 µM for 10 s (Δ = 4±0.91 mV, and Δ = 2.28±0.61 Hz n = 5) (D) or the effects of cAMP dialysis into the cell in control (black trace, n = 3, Δ = 9.6±2.02 mV, and Δ = 5±1.19 Hz) or in PKA-R1dn neurons (blue trace, n = 2, Δ = 8.4±2.21 mV, and Δ = 4.6±1.22 Hz) (E). Changes in membrane potential and firing frequency were measured by comparing the first and last 10 s from the 1 minute recording.
Figure 12
Figure 12. PDF activates a TTX resistant cationic inward current in Drosophila DN1p neurons.
(A) Representative voltage clamp recording at ZT6. Changes in ionic currents were measured from a ramp protocol form −100 mV to +100 mV in 300 ms. Black and blue traces represent currents recorded respectively before and after focal application of PDF 50 µM. (B) Crop from (A) showing inward currents from −100 mV to −60 mV. (C) Time course of PDF induced inward rectifying current measured at −100 mV without (black trace) or with TTX 10 µM (blue trace). Time course of FSK (D) or cAMP (E) induced inward rectifying current measured at −100 mV (for (E) black trace is without cAMP dialysis in the pipette, and red trace is when cAMP was added into the intracellular solution). (F) Histograms showing reduced inward current when Na+ was replaced from the extracellular solution with NMDG and comparable inward currents in control (CT), forskolin (FSK), or cAMP induced inward currents (respectively, 2.75±0.56 pA. pF−1, n = 5 in control, 1.39±0.21 pA.pF−1, n = 3 in low sodium, 2.27±0.44 pA.pF−1, n = 3 with FSK and 3±0.83 pA.pF−1, n = 2 in control).
Figure 13
Figure 13. Model for a bifurcation in the PDFR signaling pathway controlling the molecular clock and neuronal excitability.
PDFR acts through Gs and adenylate cyclase (AC) to increase levels of cAMP which may directly activate a cyclic-nucleotide-gated (CNG) channel (green pathway) to acutely depolarize the cell and increase the action potential firing rate. cAMP also activates PKA, promoting TIM stability and progression of the molecular clock (blue pathway). Light activates CRY, which promotes TIM degradation. The molecular clock also controls PKA transcripts, thereby controlling signal transduction to the clock through a feedback mechanism.

Similar articles

Cited by

References

    1. Hardin PE (2011) Molecular genetic analysis of circadian timekeeping in Drosophila. Adv Genet 74: 141–173. - PMC - PubMed
    1. Zheng X, Koh K, Sowcik M, Smith CJ, Chen D, et al. (2009) An isoform-specific mutant reveals a role of PDP1epsilon in the circadian oscillator. J Neurosci 29: 10920–10927. - PMC - PubMed
    1. Cyran SA, Buchsbaum AM, Reddy KL, Lin MC, Glossop NR, et al. (2003) vrille, Pdp1, and dClock form a second feedback loop in the Drosophila circadian clock. Cell 112: 329–341. - PubMed
    1. Kadener S, Stoleru D, McDonald M, Nawathean P, Rosbash M (2007) Clockwork Orange is a transcriptional repressor and a new Drosophila circadian pacemaker component. Genes Dev 21: 1675–1686. - PMC - PubMed
    1. Lim C, Chung BY, Pitman JL, McGill JJ, Pradhan S, et al. (2007) Clockwork orange encodes a transcriptional repressor important for circadian-clock amplitude in Drosophila. Curr Biol 17: 1082–1089. - PMC - PubMed

Publication types

MeSH terms

LinkOut - more resources