. 2014 May 2;289(18):12375-89.
doi: 10.1074/jbc.M114.548321. Epub 2014 Mar 18.

Engagement of the small GTPase Rab31 protein and its effector, early endosome antigen 1, is important for trafficking of the ligand-bound epidermal growth factor receptor from the early to the late endosome

Affiliations

Engagement of the small GTPase Rab31 protein and its effector, early endosome antigen 1, is important for trafficking of the ligand-bound epidermal growth factor receptor from the early to the late endosome

Christelle En Lin Chua et al. J Biol Chem. .

Abstract

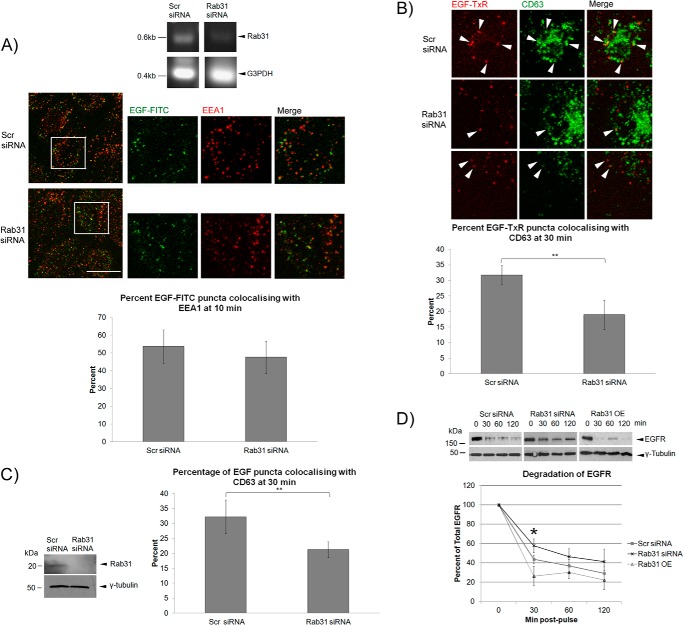
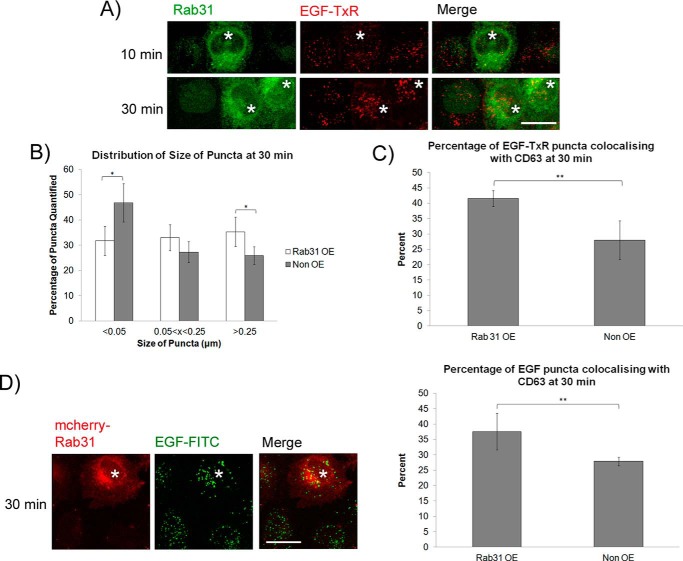
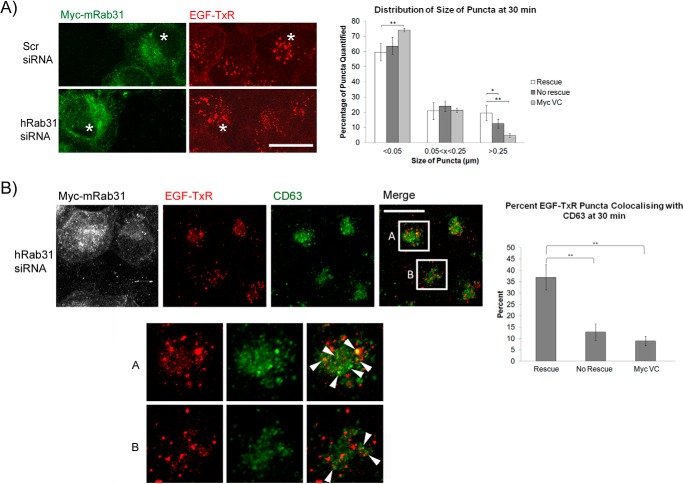
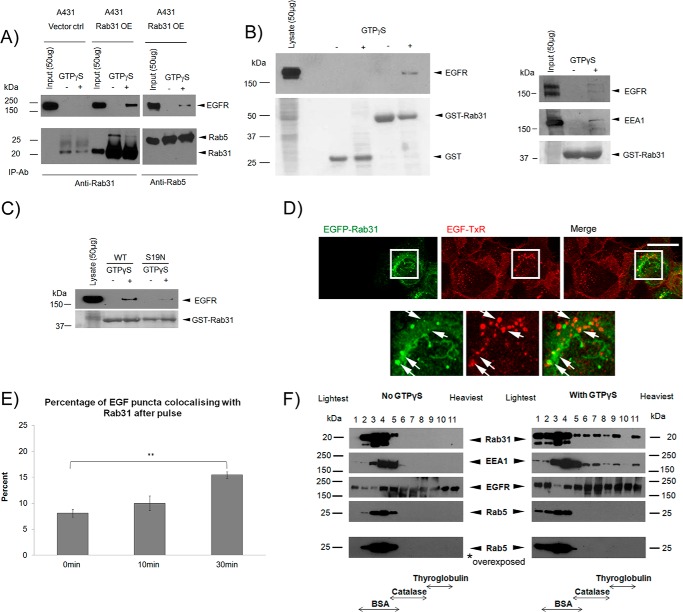
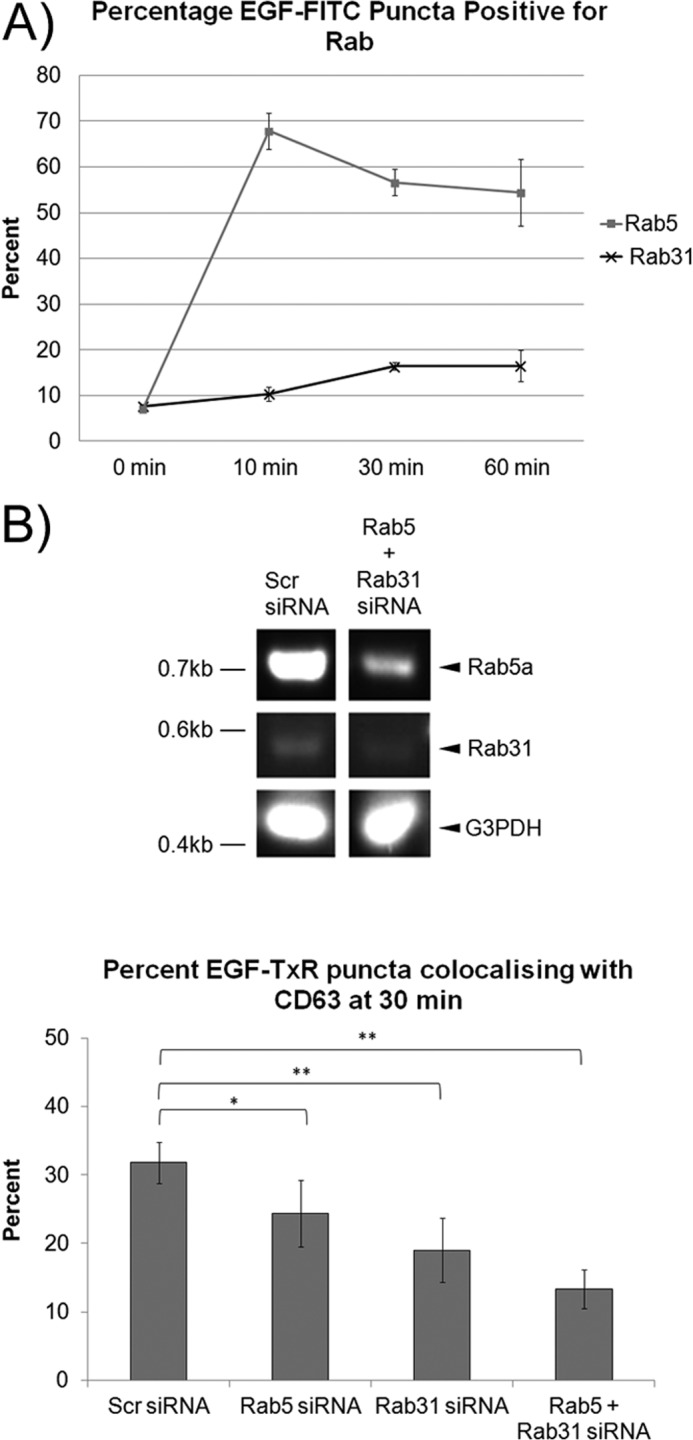
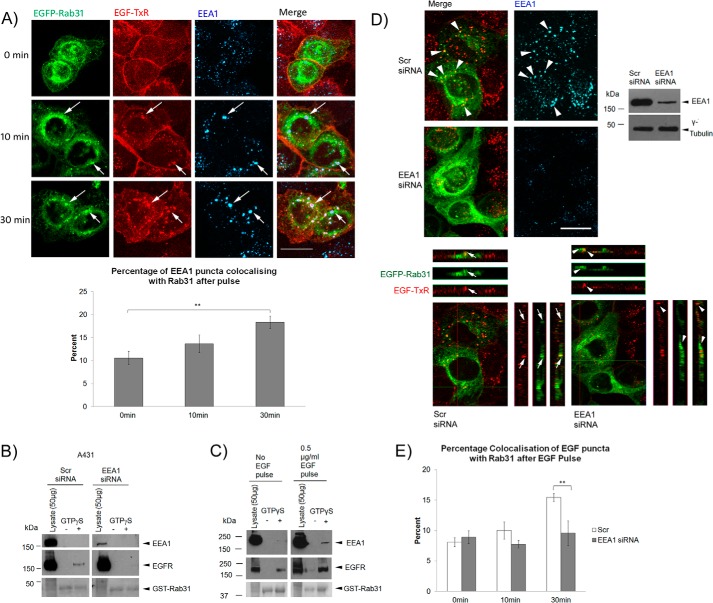
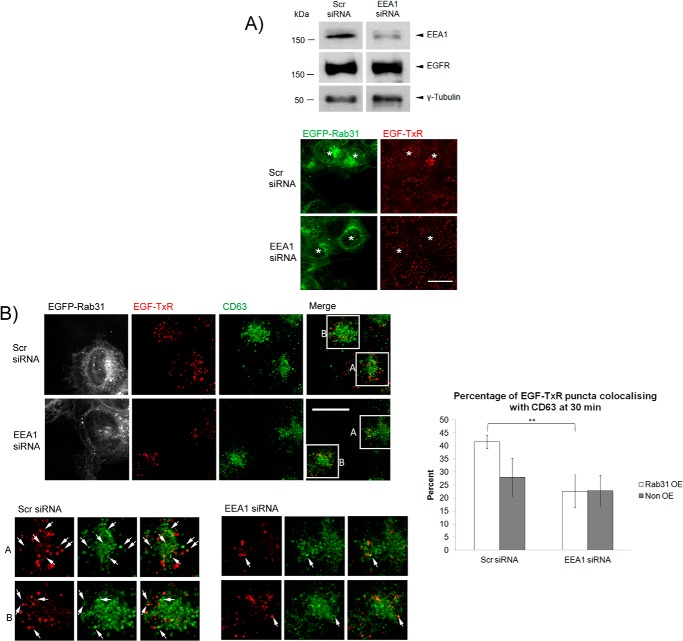
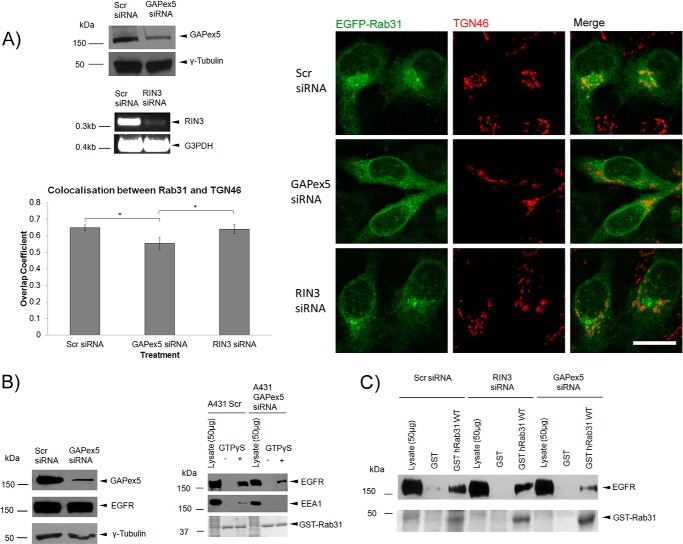
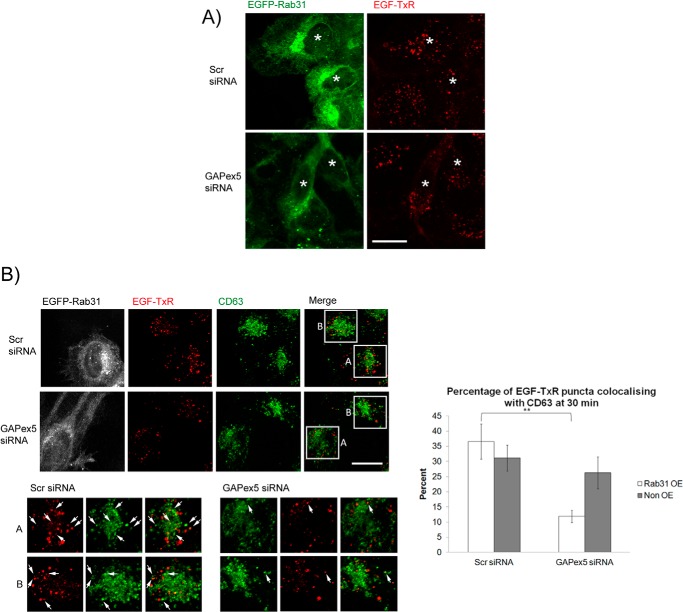
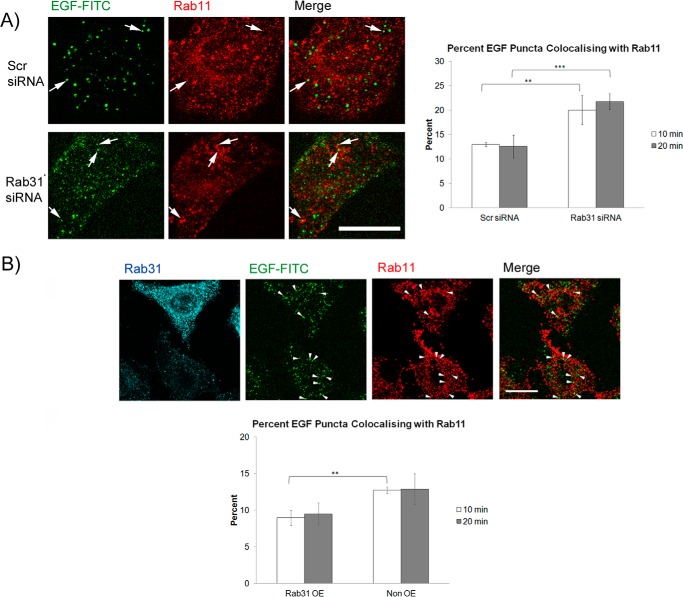
Rab31 is a member of the Rab5 subfamily of Rab GTPases. Although localized largely to the trans-Golgi network, it shares common guanine nucleotide exchange factors and effectors with other Rab5 subfamily members that have been implicated in endocytic membrane traffic. We investigated whether Rab31 also has a role in the trafficking of the ligand-bound EGF receptor (EGFR) internalized through receptor-mediated endocytosis. We found that loss of Rab31 inhibits, but overexpression enhances, EGFR trafficking to the late endosomes and that the effect of Rab31 silencing could be specifically rescued by overexpression of a silencing-resistant form of Rab31. Rab31 was found to interact with the EGFR by coimmunoprecipitation and affinity pulldown analyses, and the primarily trans-Golgi network-localized Rab31 has increased colocalization with the EGFR in A431 cells 30 min after pulsing with EGF. A glycerol gradient sedimentation assay suggested that Rab31 is sequestered into a high molecular weight complex after stimulation with EGF, as was early endosome antigen 1 (EEA1), a factor responsible for endosomal tethering and fusion events. We found that loss of EEA1 reduced the interaction between Rab31 and the EGFR and abrogated the effect of Rab31 overexpression on the trafficking of the EGFR. Likewise, loss of GAPex5, a Rab31 guanine nucleotide exchange factor that has a role in ubiquitination and degradation of the EGFR, reduced the interaction of Rab31 with the EGFR and its effect on EGFR trafficking. Taken together, our results suggest that Rab31 is an important regulator of endocytic trafficking of the EGFR and functions in an EGFR trafficking complex that includes EEA1 and GAPex5.

Keywords: Endocytosis; Endosomes; Epidermal Growth Factor Receptor (EGFR); Rab; Trafficking.


Figures

FIGURE 1.
FIGURE 1.
Loss of Rab31 hinders endocytic trafficking of the ligand-bound EGFR. A and B, A431 cells were transfected with scrambled (Scr) or Rab31 siRNA and analyzed for EGF trafficking after 48 h. A, top panel, the extent of Rab31 knockdown was assessed by RT-PCR. The endogenous levels of Rab31 protein were low, and Western blot analysis was not useful. Center panel, cells were pulsed with 0.5 μg/ml EGF-FITC (green), followed by a 10-min chase before fixation and immunofluorescence analysis with the colabeling of early the endosome marker EEA1 (red). The individual and merged fluorescence signals of the areas enclosed in white squares are shown enlarged ×2 on the right. Scale bar = 20 μm. Bottom panel, the number of EGF-FITC puncta positive for EEA1 was quantified and presented graphically as a percentage of total EGF-FITC puncta counted. 27 cells in three independent experiments were analyzed, and data are shown as mean ± S.E. B, cells were pulsed with 0.5 μg/ml EGF-TxR (red) followed by a 30-min chase before fixation and immunofluorescence analysis with the colabeling of the late endosome marker CD63 (green). Top panel, arrowheads show EGF-TxR puncta colocalizing with CD63. Scale bar = 20 μm. Bottom panel, the number of EGF-TxR puncta also positive for CD63 was quantified and presented graphically as a percentage of total EGF-TxR puncta counted. 27 cells in three independent experiments were analyzed, and data are shown as mean ± S.E. **, p < 0.01; Student's t test. C, HeLa cells were transfected with scrambled or Rab31 siRNA, and analysis was performed after 48 h. Left panel, knockdown of Rab31 in HeLa cells was quantified by Western blot analysis. Right panel, cells were pulsed with 0.5 μg/ml EGF-FITC followed by a 30-min chase before fixation and immunofluorescence analysis with the colabeling of the late endosome marker CD63. The number of EGF-FITC puncta also positive for CD63 was quantified and presented graphically as a percentage of total EGF-FITC puncta counted. 35 cells in three independent experiments were analyzed, and data are shown as mean ± S.E. **, p < 0.01; Student's t test. D, HeLa cells overexpressing Rab31 (Rab31 OE) and those that were transfected with scrambled or Rab31 siRNA were pulsed with 0.5 μg/ml EGF. At the various time points indicated, lysates were harvested and probed by Western blot analysis for total EGFR and γ-tubulin. Shown is a representative set of data from six independent experiments. Levels of EGFR were normalized against γ-tubulin and plotted graphically as a percentage of EGFR at 0 min after pulse. *, p < 0.05 between scrambled and Rab31 siRNA or scrambled and Rab31 OE at 30 min.
FIGURE 2.
FIGURE 2.
Overexpression of Rab31 enhances endocytic trafficking of the ligand-bound EGFR to the CD63-containing late endosome. A–C, A431 cells were stably transfected with Rab31. Cells were pulsed with 0.5 μg/ml EGF-TxR followed by a chase at various time points before fixation and immunofluorescence analysis. A, the effect of overexpressing Rab31 (asterisks) on the endocytosis of EGF-TxR (red) was observed by labeling for Rab31 (green) after 10- and 30-min chases. Scale bar = 20 μm. B, sizes of EGF-TxR puncta in Rab31-OE and non-OE cells from the same population were quantified using ImageJ, and the size distribution is represented graphically as a bar chart. 15 cells in three independent experiments were analyzed, and data are shown as mean ± S.E. *, p < 0.05; Student's t test. C, the number of EGF-TxR puncta also positive for CD63 in Rab31 OE and non-OE cells from the same population was quantified and presented graphically as a percentage of total EGF-TxR puncta counted. 32 cells in three independent experiments were analyzed, and data are shown as mean ± S.E. **, p < 0.01; Student's t test. D, HeLa cells were stably transfected with mcherry-Rab31. Cells were pulsed with 0.5 μg/ml EGF-FITC followed by a chase at various time points before fixation and immunofluorescence analysis. Left panel, the effect of overexpressing Rab31 (red, asterisks) on the endocytosis of EGF-FITC (green) was observed after a 30-min chase. Scale bar = 20 μm. Right panel, the number of EGF-FITC puncta also positive for CD63 was quantified and presented graphically as a percentage of total EGF-TxR puncta counted. 35 cells in three independent experiments were analyzed, and data are shown as mean ± S.E. **, p < 0.01; Student's t test.
FIGURE 3.
FIGURE 3.
Rescue of Rab31 silencing restores the endocytic trafficking defect of the ligand-bound EGFR. A431 cells were transfected with scrambled (Scr) or Rab31 siRNA for 48 h before subsequent transfection with siRNA silencing-resistant Myc-tagged mouse Rab31 (Myc-mRab31) or empty Myc vector (Myc VC). Cells were pulsed 24 h later with 0.5 μg/ml EGF-TxR followed by chase and fixation at various time points. A, left panel, immunofluorescence analysis for EGF-TxR (red) and Myc-mRab31 (green). The asterisks indicate Myc-mRab31-overexpressing cells with larger EGF-TxR puncta compared with non-overexpressing cells. Scale bar = 20 μm. Right panel, sizes of EGF-TxR puncta in cells with (Rescue), and without Myc-mRab31 expression (No rescue), and cells transfected with empty Myc vector after Rab31 siRNA treatment were quantified using ImageJ, and the size distribution is represented graphically as a bar chart. 15 cells in three independent experiments were analyzed, and data are shown as mean ± S.E. *, p < 0.05; **, p < 0.01; Student's t test. B, left panel, top, the effect of silencing Rab31 and subsequent rescue of the ligand-bound EGFR trafficking phenotype was also determined by assessing the amount of EGF-TxR (red) that has entered the CD63-containing (green) late endosome. Box A encloses the central region of a representative cell with Myc-mRab31 expression (pseudocolored white), whereas box B encloses a representative cell without Myc-mRab31 expression. Left panel, bottom, individual and merged fluorescence signals of the boxed areas, magnified ×2. Arrowheads indicate some EGF-TxR puncta (red) that are also positive for CD63 (green). Scale bar = 20 μm. Right panel, the percentage of EGF-TxR puncta that are positive for CD63 in cells with or without Myc-mRab31 expression and cells transfected with empty Myc vector after Rab31 siRNA treatment were quantified and presented graphically as a percentage of total EGF-TxR puncta counted. 29 cells in three independent experiments were analyzed, and data are shown as mean ± S.E. **, p < 0.01; Student's t test.
FIGURE 4.
FIGURE 4.
Rab31 associates with EGFR in a high molecular weight complex that includes its effector EEA1 but not Rab5. A, EGFR was coimmunoprecipitated (IP) with Rab31 or Rab5 antibody (ab), respectively, using 1 mg of lysates from cells transfected with vector alone (Vector ctrl) and Rab31 (Rab31 OE), respectively, with or without GTPγS loading. B, 1 mg of A431 cell lysate (left panel) or HeLa cell lysate (right panel) with and without GTPγS was incubated with 20 μg of GST or GST-Rab31 and glutathione beads, and the ability of the GST fusion proteins to pull down EGFR was analyzed by Western blot analysis. The GST fusion proteins were visualized with Ponceau S stain. C, 1 mg of A431 cell lysate with and without GTPγS was incubated with 20 μg of GST-Rab31 or GST-Rab31S19N (S19N) and glutathione beads, and the ability of the GST fusion proteins to pull down EGFR was analyzed by Western blot analysis. The GST proteins were visualized with Ponceau S stain. D, A431 cells stably transfected with EGFP-tagged Rab31 (EGFP-Rab31) were pulsed with 0.5 μg/ml EGF-TxR, fixed after 30 min, and analyzed for colocalization between EGFP-Rab31 (green) and EGF-TxR (red). Bottom panel, the boxed areas in the upper panel, enlarged ×2. Arrows indicate structures positive for both EGFP-Rab31 and EGF-TxR. Scale bar = 20 μm. E, the percentage of EGF-TxR-positive puncta that are also positive for EGFP-Rab31 was quantified from cells fixed after a 0-, 10-, and 30-min chase and graphically represented as a percentage of total EGF-TxR puncta counted. 34 cells in three independent experiments were analyzed, and data are shown as mean ± S.E. **, p < 0.01; Student's t test. F, 2 mg of A431 Rab31 OE lysates with and without GTPγS loading was resolved by glycerol gradient sedimentation. Fractions were collected, and TCA was precipitated and analyzed by Western blot analysis for Rab31, EGFR, Rab5, and EEA1 (an effector for both Rab5 and Rab31). The membrane blot for Rab5 was also overexposed. The position in the gradient that contains the molecular size markers BSA (67 kDa), catalase (240 kDa), and thyroglobulin (660 kDa) is indicated.
FIGURE 5.
FIGURE 5.
Rab5 appears to act upstream of Rab31 in EGFR trafficking. A, A431 cells were transfected with either mCherry-Rab5 or mCherry-Rab31. Cells were pulsed with 0.5 μg/ml EGF-FITC and fixed at the various time points indicated for immunofluorescence analysis. The percentage of EGF-FITC positive puncta that were positive for either Rab5 or Rab31 was quantified from cells fixed after a 0-, 10-, 30-, and 60-min chase and presented graphically as a percentage of total EGF-FITC puncta counted. 29 cells in three independent experiments were analyzed, and data are shown as mean ± S.E. B, A431 cells were transfected with scrambled (Scr), Rab5, or Rab31 siRNA as indicated, and subsequent analyses were performed after 48 h. Top panel, the extent of knockdown was assessed by RT-PCR. Bottom panel, cells were pulsed with 0.5 μg/ml EGF-TxR and fixed at 30 min. Cells were immunostained for CD63, and the percentages of EGF-TxR puncta that were also positive for CD63 were quantified and presented graphically as a percentage of total EGF-TxR puncta counted. 27 cells in three independent experiments were analyzed, and data are shown as mean ± S.E.*, p < 0.05; **, p < 0.01; Student's t test.
FIGURE 6.
FIGURE 6.
EEA1 mediates the Rab31-EGFR interaction in the trafficking complex. A, top panel, A431 EGFP-Rab31 OE cells (green) were pulsed with 0.5 μg/ml EGF-TxR (red), fixed at various time points, and colabeled using EEA1 antibodies (blue). Arrows indicate some structures positive for EGFP-Rab31, EGF-TxR, and EEA1. Scale bar = 20 μm. Bottom panel, the percentage of EEA1 puncta that are positive for Rab31 was quantified from cells fixed after a 0-, 10-, and 30-min chase and presented graphically as a percentage of total EGF-TxR puncta counted. 33 cells in three independent experiments were analyzed, and data are shown as mean ± S.E. **, p < 0.01; Student's t test. B, A431 cells were transfected with scrambled (Scr) or EEA1 siRNA. 1 mg of lysates with and without GTPγS was incubated with 20 μg of GST-Rab31 and glutathione beads. The ability of GST-Rab31 to pull down EGFR was analyzed by Western blot analysis. Ponceau S staining of the GST proteins used is shown. C, cells were pulsed with 0.5 μg/ml EGF before harvesting after a 30-min chase. 1 mg of lysates with and without GTPγS was incubated with 20 μg of GST-Rab31 and glutathione beads. The ability of GST-Rab31 to pull down EGFR and EEA1 was analyzed by Western blot analysis. Ponceau S staining of the GST proteins used is shown. D, A431 EGFP-Rab31 OE cells (green) were transfected with scrambled or EEA1 siRNA. Cells were pulsed 48 h later with 0.5 μg/ml EGF-TxR (red), fixed after 30 min, and colabeled for EEA1 (blue). Top panels, Knockdown of EEA1 was assessed by immunofluorescence (left) and Western blot analysis (right). Arrowheads also indicate points of colocalization between EGFP-Rab31, EGF-TxR, and EEA1 puncta. Scale bar = 20 μm. Bottom panels, orthogonal projection of the three-dimensional stacked confocal images shown in the top left panel. In cells transfected with scrambled siRNA, there is colocalization between EGFP-Rab31 (green) and EGF-TxR (red) (arrows). In cells with EEA1 knockdown, EGFP-Rab31 and EGF-TxR appeared delocalized (arrowheads). E, the percentage of EGF-TxR-positive puncta that are also positive for EGFP-Rab31 was quantified from scrambled and EEA1 siRNA-transfected cells fixed after a 0-, 10-, and 30-min chase and graphically represented as a percentage of total EGF-TxR puncta counted. 29 cells in three independent experiments were analyzed, and data are shown as mean ± S.E. **, p < 0.01; Student's t test.
FIGURE 7.
FIGURE 7.
EEA1 is important for the Rab31-mediated enhancement of ligand-bound EGFR endocytic trafficking. A, A431 EGFP-Rab31 OE cells were transfected with scrambled (Scr) or EEA1 siRNA and analyzed after 48 h. Top panel, the levels of EEA1 and EGFR were analyzed by Western blot analysis. Bottom panel, cells were pulsed with 0.5 μg/ml EGF-TxR (red) and fixed at 30 min for comparison of the puncta sizes between cells overexpressing EGFP-Rab31 (green, asterisks) and non-overexpressing cells in the same populations. Scale bar = 20 μm. B, left panels, scrambled and EEA1 siRNA-treated cells were immunostained for CD63 (pseudocolored green) along with EGF-TxR (red) and EGFP-Rab31 (pseudocolored white). Left lower panels, individual and merged fluorescence signals of the boxed areas, magnified ×2. Box A represents cells with Rab31 overexpression, whereas box B represents cells with no overexpression. Arrows indicate some structures positive for both EGF-TxR and CD63. Scale bar = 20 μm. Right panel, the percentage of EGF-TxR puncta that are positive for CD63 were quantified and graphically represented as a percentage of total EGF-TxR puncta counted. 36 cells in three independent experiments were analyzed, and data are shown as mean ± S.E. **, p < 0.01; Student's t test.
FIGURE 8.
FIGURE 8.
The guanine nucleotide exchange factor GAPex5 is important for Rab31-EGFR interaction. A, A431 Rab31 OE cells were transfected with scrambled (Scr), GAPex5, or RIN3 siRNA and assayed after 48 h. Cell lysates were analyzed by Western blot analysis for GAPex5 knockdown and RT-PCR for RIN3 knockdown. Cells were fixed and immunostained for localization of EGFP-Rab31 (green) and TGN46 (red), a marker for the trans-Golgi network. Scale bar = 20 μm. Colocalization between EGFP-Rab31 and TGN46 was quantified using Zen 2010 software for calculation of the overlap coefficient. 27 cells in three independent experiments were analyzed, and data are shown as mean ± S.E. *, p < 0.05; Student's t test. B, A431 cells were transfected with GAPex5 siRNA and harvested 48 h later. Left panel, the extent of GAPex5 knockdown and the levels of the EGFR were assessed by Western blot analysis. Right panel, a GST-Rab31 affinity pulldown assay was performed with the harvested lysates. Cells were pulsed with 0.5 μg/ml EGF before harvesting after a 30-min chase. 1 mg of lysates with and without GTPγS was incubated with 20 μg of GST-Rab31 and glutathione beads. The ability of GST-Rab31 to pull down EGFR and EEA1 was analyzed by Western blot analysis. Ponceau S staining of the GST proteins used is shown. C, 1 mg of A431 cell lysate harvested 48 h after transfection with relevant siRNA was incubated with 20 μg of GST or GST-Rab31 and glutathione beads in the presence of GTPγS, and the ability of the fusion proteins to pull down the EGFR was analyzed by Western blot analysis. GST proteins were visualized with Ponceau S stain.
FIGURE 9.
FIGURE 9.
The guanine nucleotide exchange factor GAPex5 is important for the Rab31-mediated enhancement of ligand-bound EGFR endocytic trafficking. A, A431 EGFP-Rab31 OE cells were transfected with scrambled (Scr) or GAPex5 siRNA. Cells were pulsed with 0.5 μg/ml EGF-TxR and fixed at 30 min for analysis of the size of EGF-TxR puncta (red) in cells that do (green, asterisks) or do not overexpress EGFP-Rab31. Scale bar = 20 μm. B, left panels, scrambled and GAPex5 siRNA-treated cells were immunostained for CD63 (pseudocolored green) along with EGF-TxR (red) and EGFP-Rab31 (pseudocolored white). The left bottom panels show individual and merged fluorescence signals of the boxed areas, magnified ×2. Box A encloses the central area of cells with Rab31 overexpression, whereas box B encloses central areas of cells with no Rab31 overexpression. Arrows indicate some structures positive for both EGF-TxR and CD63. Scale bar = 20 μm. Right panel, the percentage of EGF-TxR puncta that are also positive for CD63 were quantified and are graphically presented as a percentage of total EGF-TxR puncta counted. 41 cells in three independent experiments were analyzed, and data are shown as mean ± S.E. **, p < 0.01; Student's t test.
FIGURE 10.
FIGURE 10.
Rab31 indirectly impacts the recycling itinerary of the ligand-bound EGFR. A, HeLa cells were transfected with either scrambled (Scr) or Rab31 siRNA and subsequent assays were performed after 48 h. Left panel, cells were pulsed with 0.25 μg/ml EGF-FITC (green), fixed at 20 min, and analyzed by colabeling for Rab11 (red). Arrows indicate some structures positive for both EGF-FITC and Rab11. Scale bar = 20 μm. Right panel, the percentage of EGF-FITC puncta that are also positive for Rab11 was quantified from cells fixed after a 10- and 20-min chase and presented graphically as a percentage of total EGF-FITC puncta counted. 27 cells in three independent experiments were analyzed, and data are shown as mean ± S.E. **, p < 0.01; ***, p < 0.001; Student's t test. B, top panel, HeLa cells were transfected with Rab31 (blue), pulsed with 0.25 μg/ml EGF-FITC (green), and fixed at 20 min for analysis by coimmunostaining for Rab11 (red). Arrows indicate some structures positive for both EGF-FITC and Rab11. Scale bar = 20 μm. Bottom panel, the percentage of EGF-FITC puncta that are positive for Rab11 was quantified from cells fixed after a 10- and 20-min chase and presented graphically as a percentage of total EGF-FITC puncta counted. 27 cells in three independent experiments were analyzed, and data are shown as mean ± S.E. **, p < 0.01; Student's t test.

Similar articles

Cited by

References

    1. Colicelli J. (2004) Human RAS superfamily proteins and related GTPases. Sci. STKE 2004, RE13. - PMC - PubMed
    1. Markgraf D. F., Peplowska K., Ungermann C. (2007) Rab cascades and tethering factors in the endomembrane system. FEBS Lett. 581, 2125–2130 - PubMed
    1. Seabra M. C., Coudrier E. (2004) Rab GTPases and myosin motors in organelle motility. Traffic 5, 393–399 - PubMed
    1. Li L. (2001) Direct interaction of Rab4 with syntaxin 4. J. Biol. Chem. 276, 5265–5273 - PubMed
    1. Simonsen A. (1999) The Rab5 effector EEA1 interacts directly with syntaxin-6. J. Biol. Chem. 274, 28857–28860 - PubMed

Publication types

MeSH terms