

Outcome prediction in patients with glioblastoma by using imaging, clinical, and genomic biomarkers: focus on the nonenhancing component of the tumor
- PMID: 24646147
- PMCID: PMC4263660
- DOI: 10.1148/radiol.14131691
Outcome prediction in patients with glioblastoma by using imaging, clinical, and genomic biomarkers: focus on the nonenhancing component of the tumor
Abstract
Purpose: To correlate patient survival with morphologic imaging features and hemodynamic parameters obtained from the nonenhancing region (NER) of glioblastoma (GBM), along with clinical and genomic markers.
Materials and methods: An institutional review board waiver was obtained for this HIPAA-compliant retrospective study. Forty-five patients with GBM underwent baseline imaging with contrast material-enhanced magnetic resonance (MR) imaging and dynamic susceptibility contrast-enhanced T2*-weighted perfusion MR imaging. Molecular and clinical predictors of survival were obtained. Single and multivariable models of overall survival (OS) and progression-free survival (PFS) were explored with Kaplan-Meier estimates, Cox regression, and random survival forests.
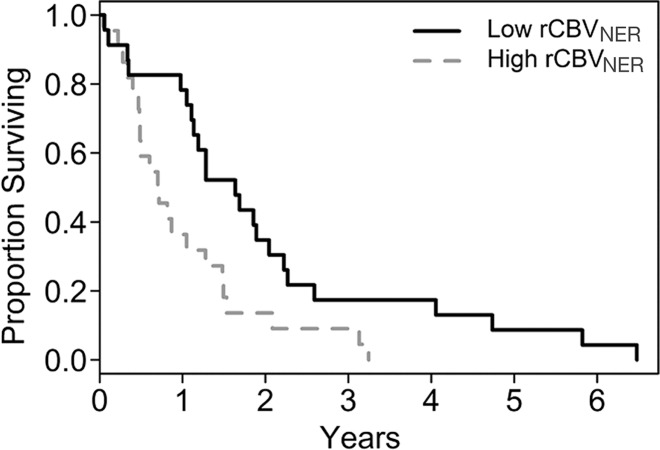
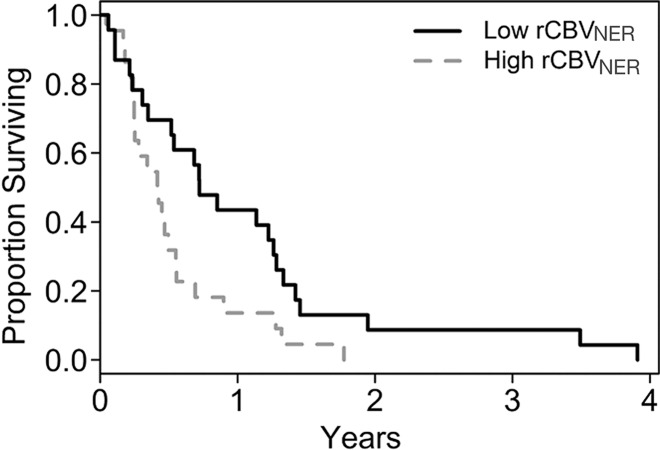
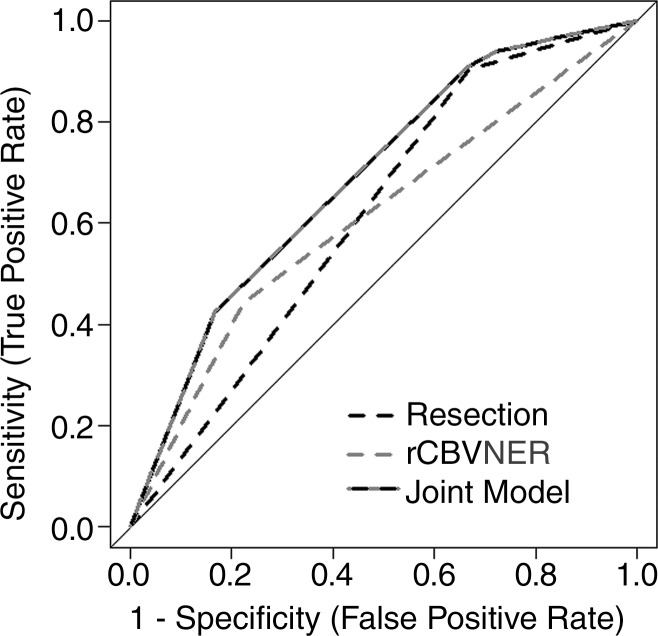
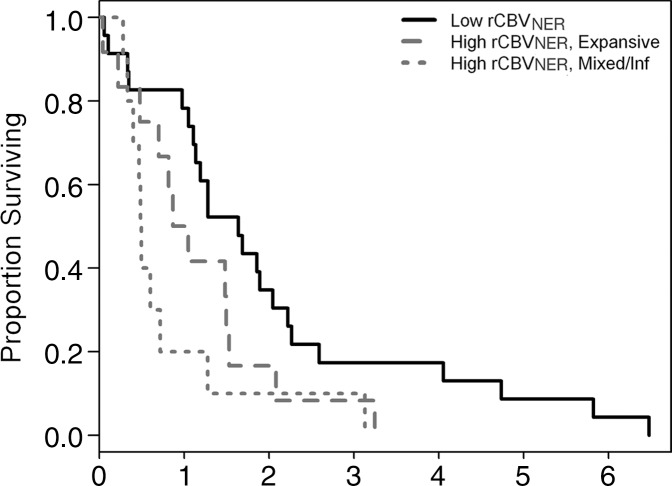
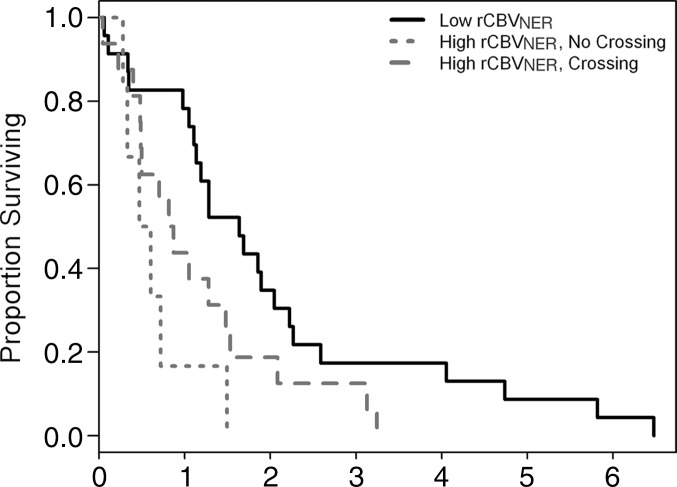
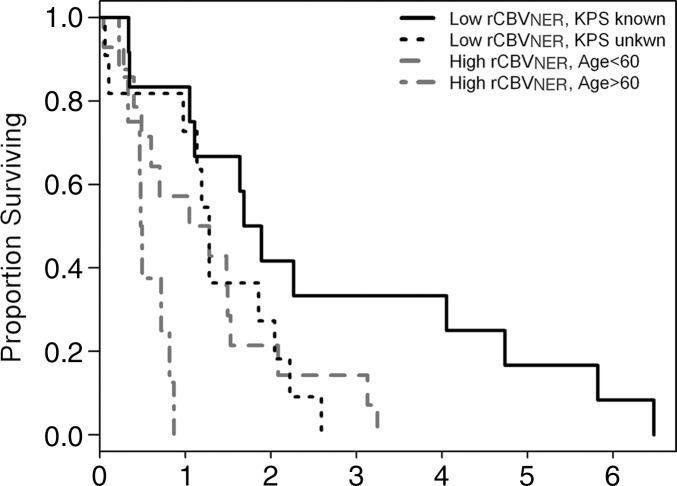
Results: Worsening OS (log-rank test, P = .0103) and PFS (log-rank test, P = .0223) were associated with increasing relative cerebral blood volume of NER (rCBVNER), which was higher with deep white matter involvement (t test, P = .0482) and poor NER margin definition (t test, P = .0147). NER crossing the midline was the only morphologic feature of NER associated with poor survival (log-rank test, P = .0125). Preoperative Karnofsky performance score (KPS) and resection extent (n = 30) were clinically significant OS predictors (log-rank test, P = .0176 and P = .0038, respectively). No genomic alterations were associated with survival, except patients with high rCBVNER and wild-type epidermal growth factor receptor (EGFR) mutation had significantly poor survival (log-rank test, P = .0306; area under the receiver operating characteristic curve = 0.62). Combining resection extent with rCBVNER marginally improved prognostic ability (permutation, P = .084). Random forest models of presurgical predictors indicated rCBVNER as the top predictor; also important were KPS, age at diagnosis, and NER crossing the midline. A multivariable model containing rCBVNER, age at diagnosis, and KPS can be used to group patients with more than 1 year of difference in observed median survival (0.49-1.79 years).
Conclusion: Patients with high rCBVNER and NER crossing the midline and those with high rCBVNER and wild-type EGFR mutation showed poor survival. In multivariable survival models, however, rCBVNER provided unique prognostic information that went above and beyond the assessment of all NER imaging features, as well as clinical and genomic features.
Figures
References
-
- Scherer HJ. The forms of growth in gliomas and their practical significance. Brain 1940;63(1):1–35.
-
- Burger PC, Heinz ER, Shibata T, Kleihues P. Topographic anatomy and CT correlations in the untreated glioblastoma multiforme. J Neurosurg 1988;68(5):698–704. - PubMed
-
- Parsa AT, Wachhorst S, Lamborn KR, et al. Prognostic significance of intracranial dissemination of glioblastoma multiforme in adults. J Neurosurg 2005;102(4):622–628. - PubMed
-
- Wen PY, Macdonald DR, Reardon DA, et al. Updated response assessment criteria for high-grade gliomas: response assessment in neuro-oncology working group. J Clin Oncol 2010;28(11):1963–1972. - PubMed
-
- Chamberlain MC. Radiographic patterns of relapse in glioblastoma. J Neurooncol 2011;101(2):319–323. - PubMed
MeSH terms
Substances
Grants and funding
LinkOut - more resources
Full Text Sources
Other Literature Sources
Medical
Research Materials
Miscellaneous
