. 2014 Mar 19:14:208.
doi: 10.1186/1471-2407-14-208.

Increased diacylglycerol kinase ζ expression in human metastatic colon cancer cells augments Rho GTPase activity and contributes to enhanced invasion

Affiliations

Increased diacylglycerol kinase ζ expression in human metastatic colon cancer cells augments Rho GTPase activity and contributes to enhanced invasion

Kun Cai et al. BMC Cancer. .

Abstract

Background: Unraveling the signaling pathways responsible for the establishment of a metastatic phenotype in carcinoma cells is critically important for understanding the pathology of cancer. The acquisition of cell motility is a key property of metastatic tumor cells and is a prerequisite for invasion. Rho GTPases regulate actin cytoskeleton reorganization and the cellular responses required for cell motility and invasion. Diacylglycerol kinase ζ (DGKζ), an enzyme that phosphorylates diacylglycerol to yield phosphatidic acid, regulates the activity of the Rho GTPases Rac1 and RhoA. DGKζ mRNA is highly expressed in several different colon cancer cell lines, as well as in colon cancer tissue relative to normal colonic epithelium, and thus may contribute to the metastatic process.

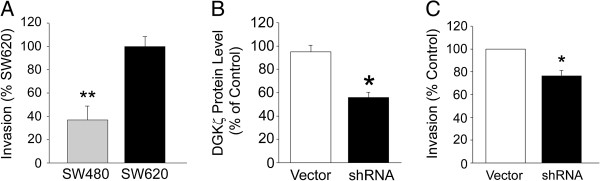
Methods: To investigate potential roles of DGKζ in cancer metastasis, a cellular, isogenic model of human colorectal cancer metastatic transition was used. DGKζ protein levels, Rac1 and RhoA activity, and PAK phosphorylation were measured in the non-metastatic SW480 adenocarcinoma cell line and its highly metastatic variant, the SW620 line. The effect of DGKζ silencing on Rho GTPase activity and invasion through Matrigel-coated Transwell inserts was studied in SW620 cells. Invasiveness was also measured in PC-3 prostate cancer and MDA-MB-231 breast cancer cells depleted of DGKζ.

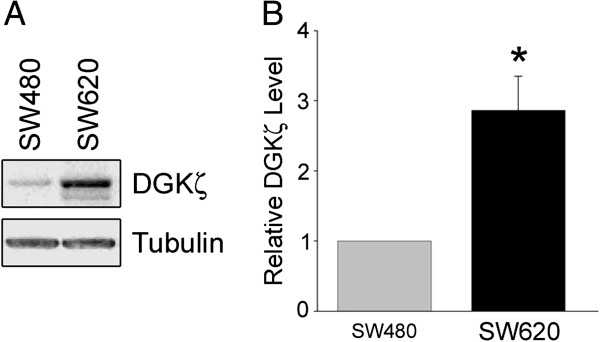
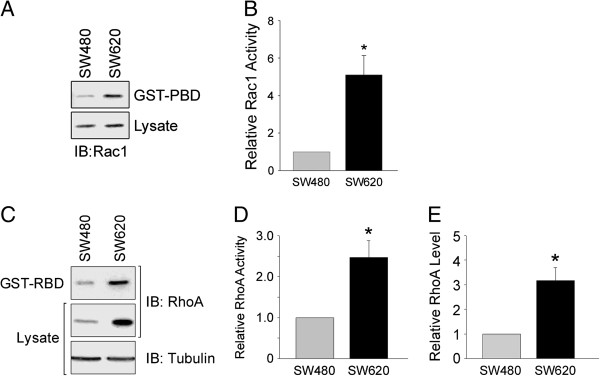
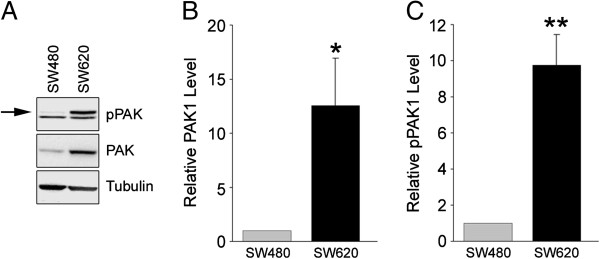
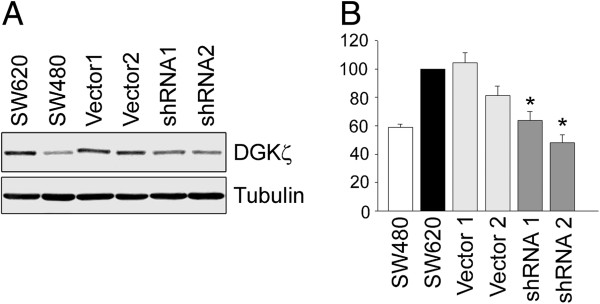
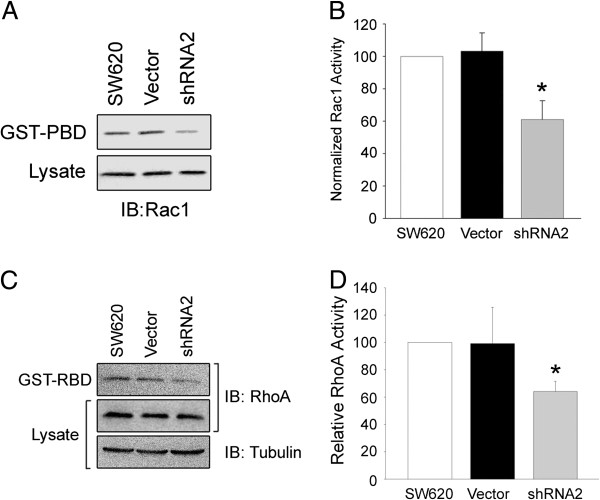
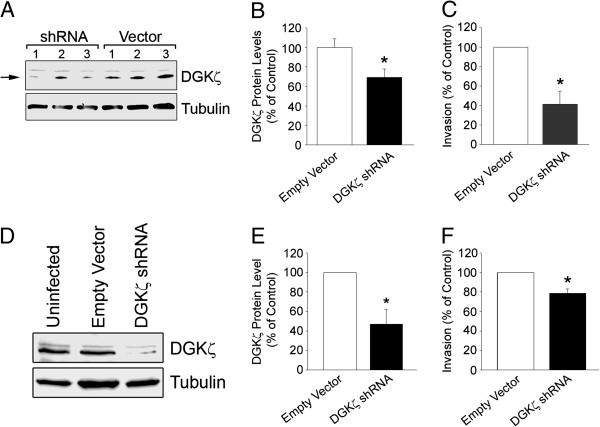
Results: DGKζ protein levels were elevated approximately 3-fold in SW620 cells compared to SW480 cells. There was a concomitant increase in active Rac1 in SW620 cells, as well as substantial increases in the expression and phosphorylation of the Rac1 effector PAK1. Similarly, RhoA activity and expression were increased in SW620 cells. Knockdown of DGKζ expression in SW620 cells by shRNA-mediated silencing significantly reduced Rac1 and RhoA activity and attenuated the invasiveness of SW620 cells in vitro. DGKζ silencing in highly metastatic MDA-MB-231 breast cancer cells and PC-3 prostate cancer cells also significantly attenuated their invasiveness.

Conclusion: Elevated DGKζ expression contributes to increased Rho GTPase activation and the enhanced motility of metastatic cancer cells. These findings warrant further investigation of the clinical relevance of DGKζ upregulation in colon and other cancers. Interfering with DGKζ function could provide a means of inhibiting invasion and metastasis.


Figures

Figure 1
Figure 1
DGKζ is increased in metastatic SW620 cells relative to non-metastatic SW480 cells. (A) Detergent extracts prepared from lysates of SW480 and SW620 cells were analyzed by immunoblotting with an affinity-purified anti-DGKζ antibody (top) and an anti-α-tubulin monoclonal antibody (bottom). (B) Graph showing the quantification of DGKζ levels by densitometric analysis of immunoblots. The data were normalized to the level of α-tubulin and expressed as a fold increase relative to the amount in SW480 cells. Values are the average ± S.E.M. of four independent experiments. The asterisk indicates a highly significant difference (P < 0.01) from SW480 cells by Student’s t-test.
Figure 2
Figure 2
Increased Rac1 and RhoA activity in SW620 cells relative to SW480 cells. Detergent extracts from SW480 and SW620 cells were incubated with immobilized GST-PBD (A) or GST-RBD (C) and the bound proteins were analyzed by immunoblotting (IB) for Rac1 or RhoA, respectively (top panels). Total Rac1 and RhoA levels in the cell lysates are shown below. Tubulin is shown for comparison with RhoA. (B and D) Quantification of active Rac1 and RhoA levels, respectively, by densitometric analysis of immunoblots. The data were normalized to the amount of total Rac1 or tubulin (for RhoA) and are expressed as a fold increase relative to SW480 cells. (E) Graph showing the relative levels of RhoA in SW480 and SW620 cells. In each case, values are the average from at least three independent experiments ± S.E.M. The asterisks indicate a significant difference from SW480 cells (P < 0.05) by Student’s t-test.
Figure 3
Figure 3
Increased PAK1 expression and phosphorylation in SW620 cells. (A) Detergent extracts prepared from SW480 and SW620 cells were analyzed by immunoblotting for phosphorylated (p)PAK1, total PAK1 and tubulin. (B) Graph showing the quantification of total PAK1 levels by densitometric analysis of immunoblots. (C) Quantification of pPAK1 levels. The intensity of the upper pPAK1 band (arrow in A) was measured and normalized to the level of tubulin. Values are the average ± S.E.M. of four independent experiments. One asterisk denotes a significant difference (P < 0.05) and two asterisks, a highly significant difference (P < 0.01) from SW480 cells by Student’s t-test.
Figure 4
Figure 4
Stable shRNA expression reduces DGKζ levels in SW620 cells. (A) Equivalent amounts of protein from detergent extracts of SW620 cells, SW620 cells stably expressing an empty lentiviral vector (Vector1 and 2), or SW620 cells expressing an shRNA against DGKζ (shRNA1 and 2) were immunoblotted with anti-DGKζ (top) and anti-tubulin (bottom) antibodies. (B) Graph showing DGKζ protein levels in each cell line as measured by densitometric analysis of western blots. The data were normalized to the level of tubulin and are expressed as a percentage of DGKζ in SW620 cells. Values are the average of at least three independent experiments ± S.E.M. Statistical analysis was performed by a one-way ANOVA followed by a Tukey post-hoc multiple comparison test. The asterisks denote a highly significant difference (P < 0.001) from SW620 cells.
Figure 5
Figure 5
Decreased Rac1 and RhoA activity in DGKζ knockdown cells. Assay of global Rac1 and RhoA activity. Detergent extracts from the indicated cell lines were incubated with immobilized GST-PBD or GST-RBD and the bound proteins were analyzed by immunoblotting (IB) for Rac1 (A) or RhoA and tubulin (C). Total Rac1 and RhoA levels in the cell lysates are shown. (B and D) Quantification of active Rac1 and RhoA levels, respectively, by densitometric analysis of immunoblots. The data were normalized to the amount of total Rac1 or RhoA protein and are expressed as a percentage of the activity in SW620 cells. Values are the average of at least three independent experiments ± S.E.M. The asterisks indicate a highly significant difference from SW620 cells (P < 0.005) by Student’s t-test.
Figure 6
Figure 6
Silencing DGKζ Expression Decreases Invasiveness of SW620 Cells. SW480, SW620, SW620/Vector, and SW620/shRNA cells were placed in the upper chamber of a Transwell invasion plate and allowed to migrate across a Matrigel-coated, porous membrane for approximately 72 hrs. (A) Graph comparing the invasion of SW480 and SW620 cells. (B) Graph showing the average DGKζ level in SW620/Vector and SW620/shRNA cell lines normalized to the DGKζ level in SW620 cells. (C) Graph showing the average invasion of SW620/Vector and SW620/shRNA cell lines. Values are the mean ± S.E.M. from seven independent experiments. One asterisk indicates a significant difference (P < 0.05) and two asterisks, a highly significant difference (P < 0.005) from SW620 cells by Student’s t-test.
Figure 7
Figure 7
DGKζ Silencing Attenuates Invasion of PC-3 Prostate and MDA-MB-231 Breast Cancer Cells. (A) Western blot of DGKζ (arrow) in three PC-3/Vector and three PC-3/shRNA cell lines. Tubulin is shown for comparison. (B and C) Graphs showing the average DGKζ level (B) and invasion through Matrigel-coated Transwell inserts (C) of PC-3/Vector and PC-3/shRNA cell lines. The data were normalized to Empty Vector control cells. Values in B and C are the mean ± S.E.M. from five independent experiments. (D) Western blot of DGKζ in MDA-MB-231/Vector and MDA-MB-231/shRNA cells. Tubulin is shown for comparison. (E and F) Graphs showing the average DGKζ level (E) and invasiveness (F) of MDA-MB-231/Vector and MDA-MB-231/shRNA cells, normalized to the level in Empty Vector control cells. Values in E and F are the mean ± S.E.M. from four independent experiments. An asterisk indicates a significant difference (P < 0.05) from Vector cells by Student’s t-test.

References

    1. Siegel R, Naishadham D, Jemal A. Cancer statistics, 2012. CA Cancer J Clin. 2012;62:10–29. doi: 10.3322/caac.20138. - DOI - PubMed
    1. Fearon ER, Vogelstein B. A genetic model for colorectal tumorigenesis. Cell. 1990;61:759–767. doi: 10.1016/0092-8674(90)90186-I. - DOI - PubMed
    1. Kinzler KW, Vogelstein B. Lessons from hereditary colorectal cancer. Cell. 1996;87:159–170. doi: 10.1016/S0092-8674(00)81333-1. - DOI - PubMed
    1. Vogelstein B, Fearon ER, Hamilton SR, Kern SE, Preisinger AC, Leppert M, Nakamura Y, White R, Smits AM, Bos JL. Genetic alterations during colorectal-tumor development. N Engl J Med. 1988;319:525–532. doi: 10.1056/NEJM198809013190901. - DOI - PubMed
    1. Provenzani A, Fronza R, Loreni F, Pascale A, Amadio M, Quattrone A. Global alterations in mRNA polysomal recruitment in a cell model of colorectal cancer progression to metastasis. Carcinogenesis. 2006;27:1323–1333. doi: 10.1093/carcin/bgi377. - DOI - PubMed

Publication types

MeSH terms