Comparative Study
. 2014 Jul 15;98(1):94-9.
doi: 10.1097/01.TP.0000443223.89831.85.

Variation in access to the liver transplant waiting list in the United States

Affiliations
Comparative Study

Variation in access to the liver transplant waiting list in the United States

Amit K Mathur et al. Transplantation. .

Abstract

Background: We sought to compare liver transplant waiting list access by demographics and geography relative to the pool of potential liver transplant candidates across the United States using a novel metric of access to care, termed a liver wait-listing ratio (LWR).

Methods: We calculated LWRs from national liver transplant registration data and liver mortality data from the Scientific Registry of Transplant Recipients and the National Center for Healthcare Statistics from 1999 to 2006 to identify variation by diagnosis, demographics, geography, and era.

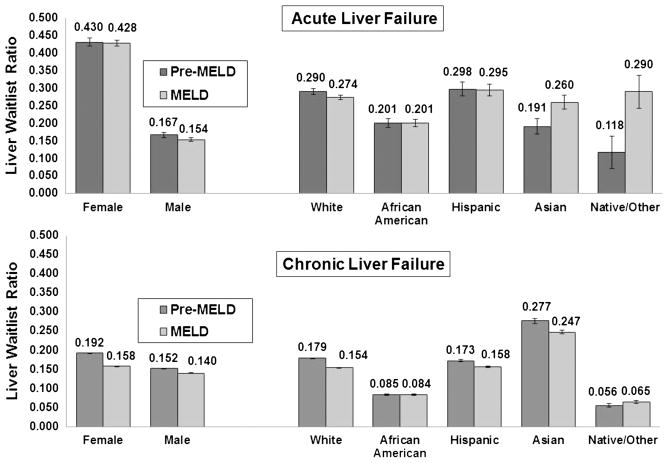
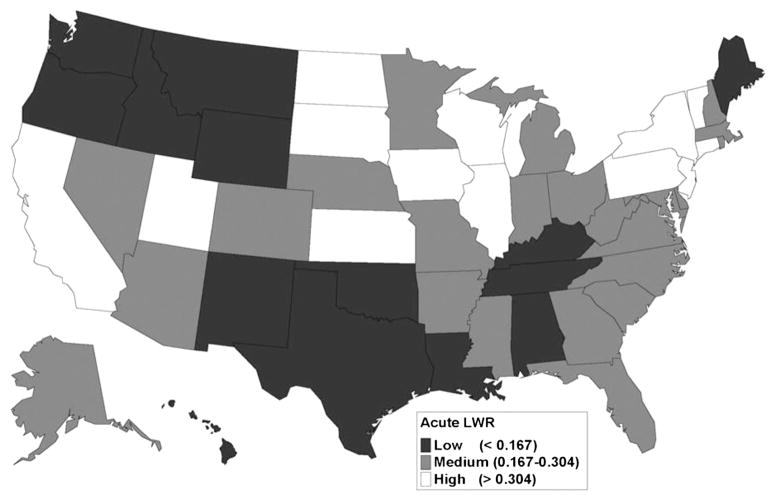
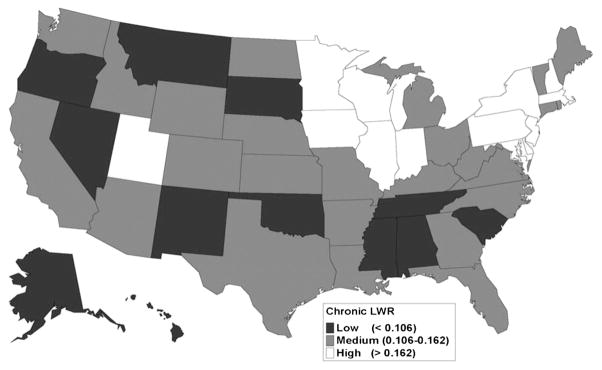
Results: Among patients with ALF and CLF, African Americans had significantly lower access to the waiting list compared with whites (acute: 0.201 versus 0.280; pre-MELD 0.201 versus 0.290; MELD era: 0.201 versus 0.274; all, P<0.0001) (chronic: 0.084 versus 0.163; pre-MELD 0.085 versus 0.179; MELD 0.084 versus 0.154; all, P<0.0001). Hispanics and whites had similar LWR in both eras (both P>0.05). In the MELD era, female subjects had greater access to the waiting list compared with male subjects (acute: 0.428 versus 0.154; chronic: 0.158 versus 0.140; all, P<0.0001). LWRs varied by three-fold by state (pre-MELD acute: 0.122-0.418, chronic: 0.092-0.247; MELD acute: 0.121-0.428, chronic: 0.092-0.243).

Conclusions: The marked inequity in early access to liver transplantation underscores the need for local and national policy initiatives to affect this disparity.


Conflict of interest statement

The authors declare no conflict of interest.

Figures

FIGURE 1
FIGURE 1
Racial/ethnic and sex-based variation in liver wait-listing ratios for acute and chronic liver failure, 1999–2006. For acute liver failure, there were vast differences between female and male subjects in LWRs but not much change by era. Female subjects had nearly three-fold higher LWRs compared with male subjects. By race/ethnicity, we observed a significant disparity for African Americans that did not improve by era and was 25% to 30% lower than for whites. Hispanics had similar LWRs to whites in both eras. Asians had significantly higher wait-listing rates in the latter part of the cohort, as did Native American/Other race patients. For chronic liver failure, a sex-based disparity was noted but with much smaller magnitude than observed with acute liver failure. The LWRs for both sexes declined significantly in the MELD era. With regards to race/ethnicity, African Americans had two-fold lower LWRs compared with whites, which did not improve in the latter part of the cohort. Asians had significantly higher LWRs for chronic liver disease than whites in both eras, and the LWRs for Native/Others were the lowest of the cohort. Hispanic patients retained similar LWRs as whites in both eras, but both observed some decline as time went on.
FIGURE 2
FIGURE 2
Age-based variation in liver wait-listing ratios by era, 1999–2006. Age-based variation in wait-listing rates in the pre-MELD and MELD eras was evident. For acute liver failure, young patients had two- to three-fold higher wait-listing rates than middle-aged adults, and patients older than 60 had the lowest LWRs, independent of diagnosis. For chronic liver disease, the degree of age-based variation was more compressed, but younger adults again had the highest wait-listing rates.
FIGURE 3
FIGURE 3
Geographic variation in liver wait-listing ratios for acute liver failure, 1999–2006. For patients with acute liver failure, access to the liver transplant waiting list was geographically variable across the United States. Low access states were concentrated in the Pacific Northwest, and in the South. High access states included California, several areas of the Midwest, and the middle Atlantic states.
FIGURE 4
FIGURE 4
Geographic variation in wait-listing ratios for chronic liver disease, 1999–2006. For chronic liver disease patients, the middle two LWR quartiles (medium) were widely dispersed. High access areas were in the Midwest and the middle Atlantic. Low access states were also fairly dispersed geographically.

Similar articles

Cited by

References

    1. Thuluvath PJ, Guidinger MK, Fung JJ, et al. Liver transplantation in the United States, 1999–2008. Am J Transplant. 2010;10(4 Pt 2):1003. - PubMed
    1. Mathur AK, Sonnenday CJ, Merion RM. Race and ethnicity in access to and outcomes of liver transplantation: a critical literature review. Am J Transplant. 2009;9:2662. - PMC - PubMed
    1. Nguyen GC, Thuluvath PJ. Racial disparity in liver disease: biological, cultural, or socioeconomic factors. Hepatology. 2008;47:1058. - PubMed
    1. Kemmer N, Neff GW. Liver transplantation in the ethnic minority population: challenges and prospects. Dig Dis Sci. 2010;55:883. - PubMed
    1. Eckhoff DE, McGuire BM, Young CJ, et al. Race: a critical factor in organ donation, patient referral and selection, and orthotopic liver transplantation? Liver Transpl Surg. 1998;4:499. - PubMed

Publication types

MeSH terms