

The chemokine receptor CXCR6 contributes to recruitment of bone marrow-derived fibroblast precursors in renal fibrosis
- PMID: 24646857
- PMCID: PMC4117803
- DOI: 10.1038/ki.2014.64
The chemokine receptor CXCR6 contributes to recruitment of bone marrow-derived fibroblast precursors in renal fibrosis
Abstract
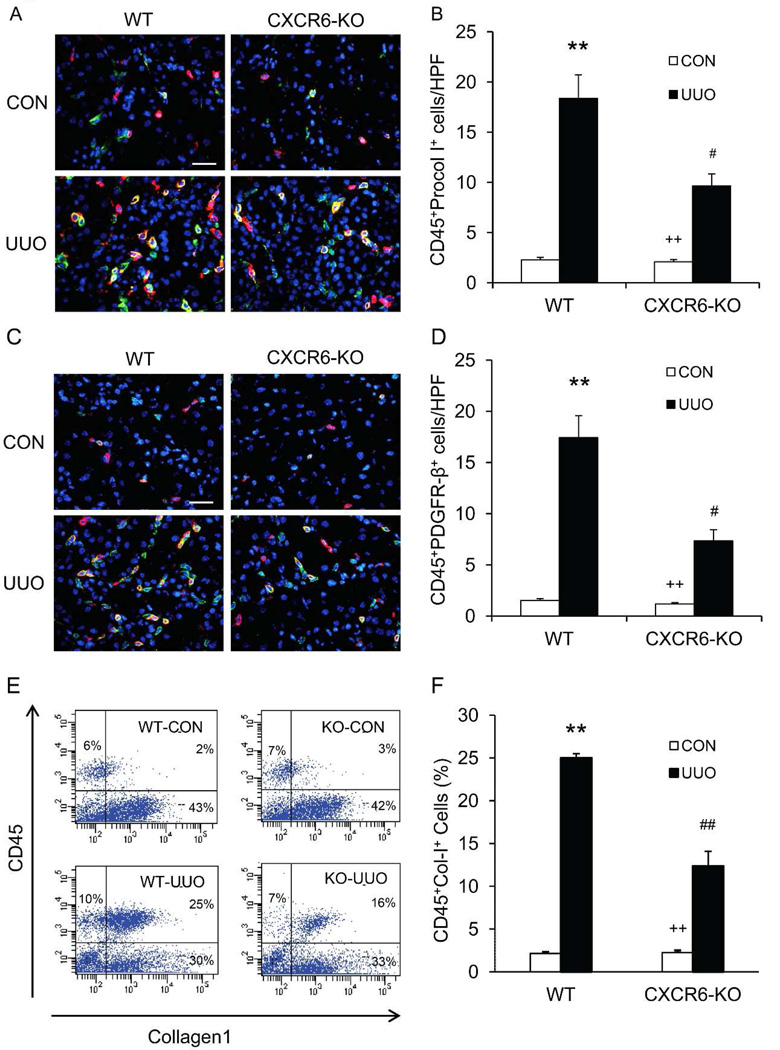
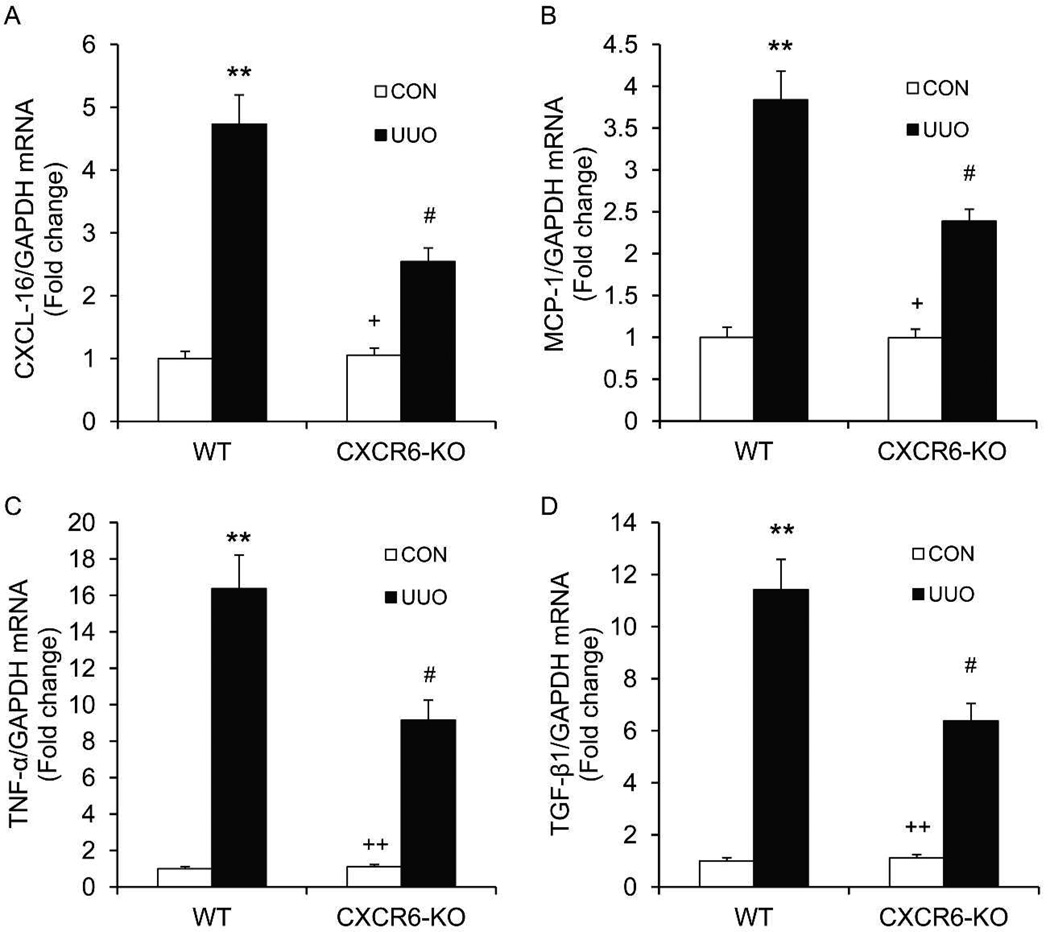
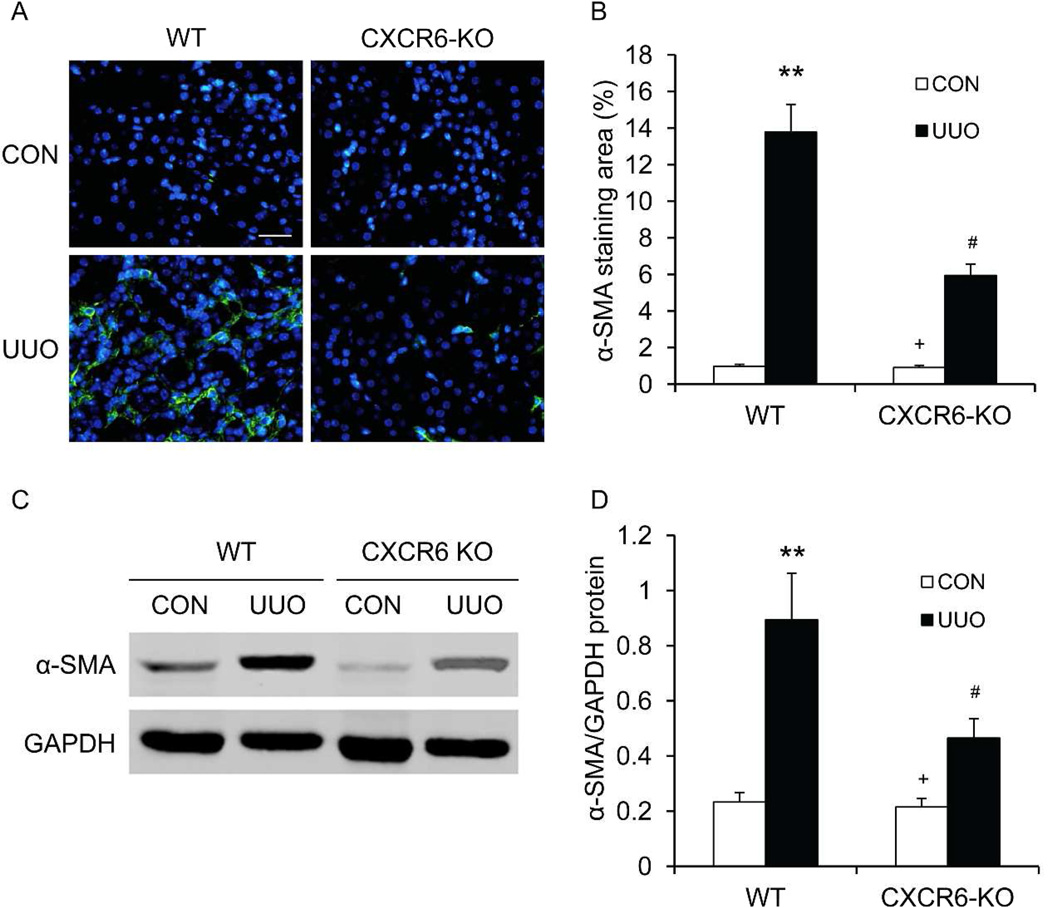
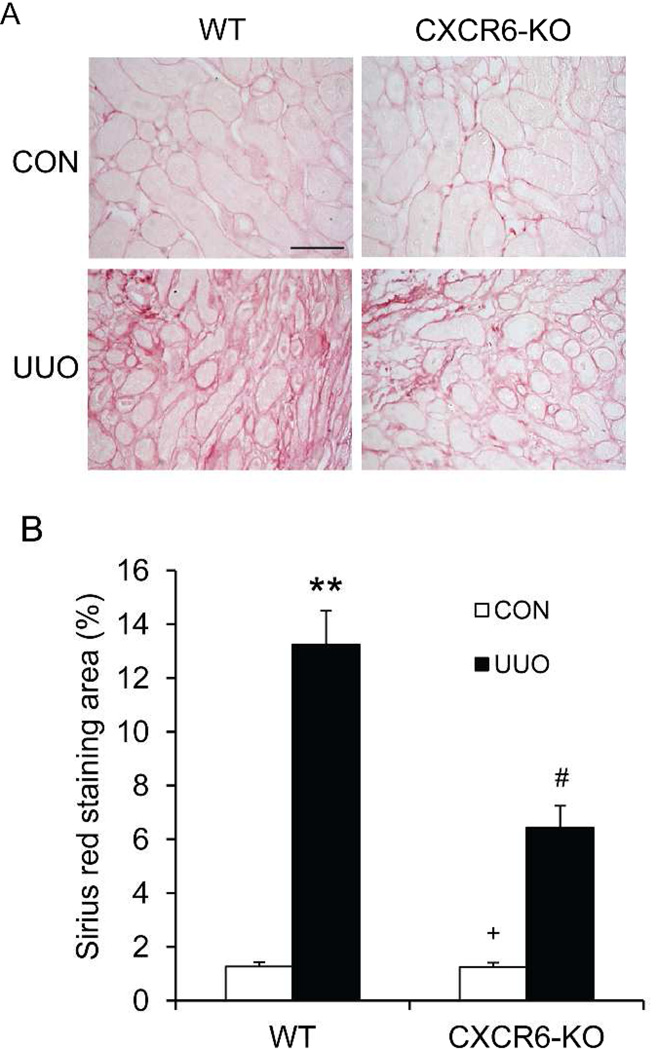
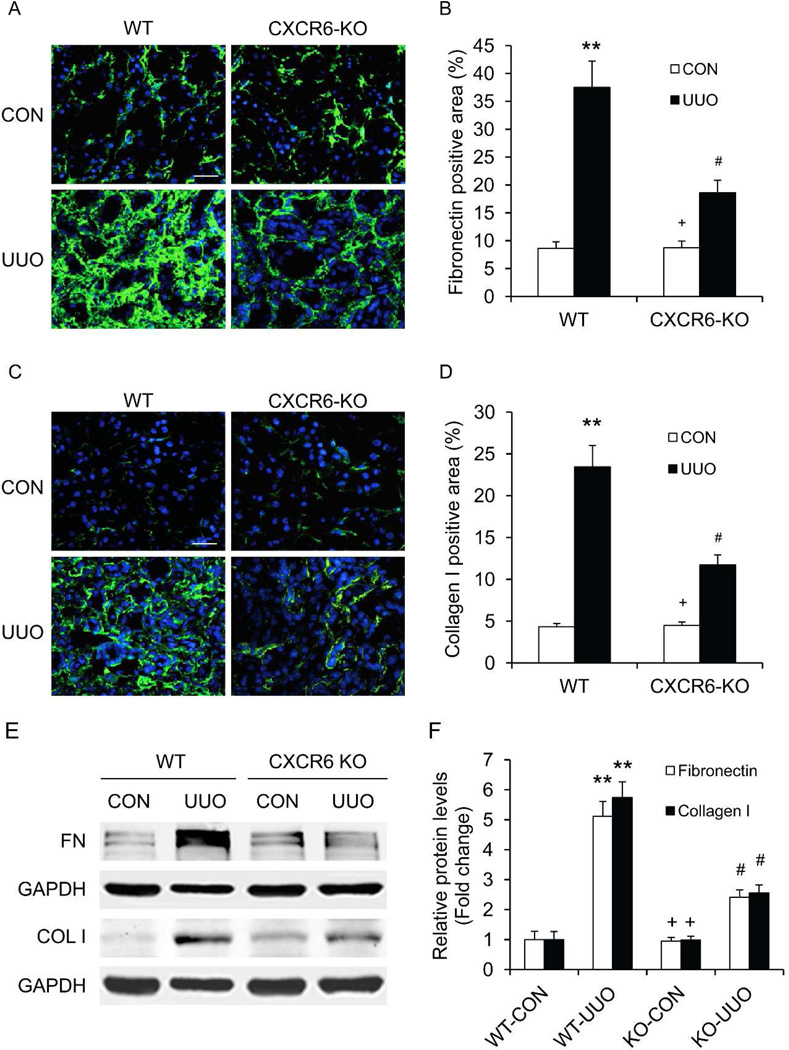
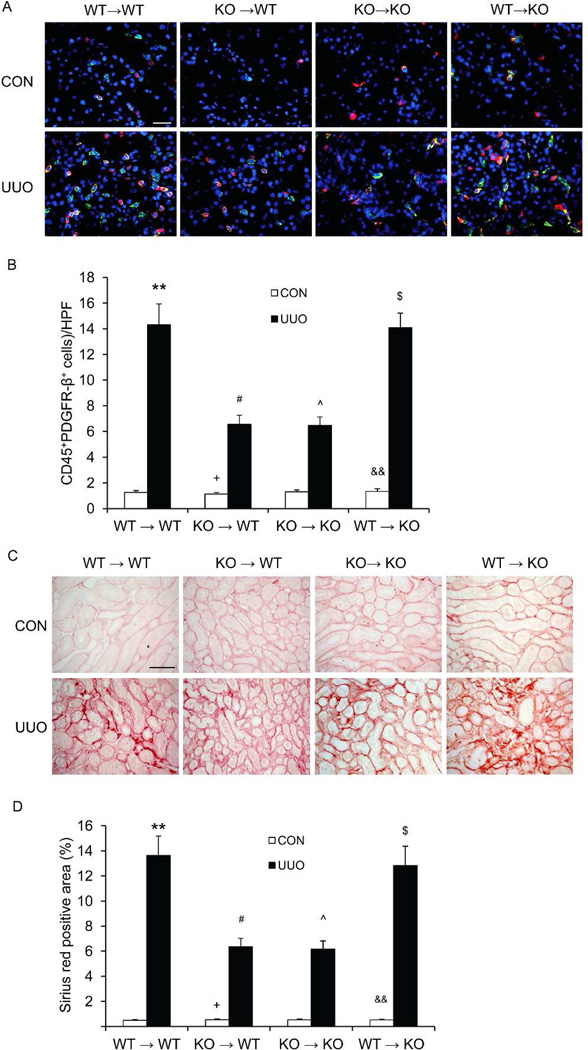
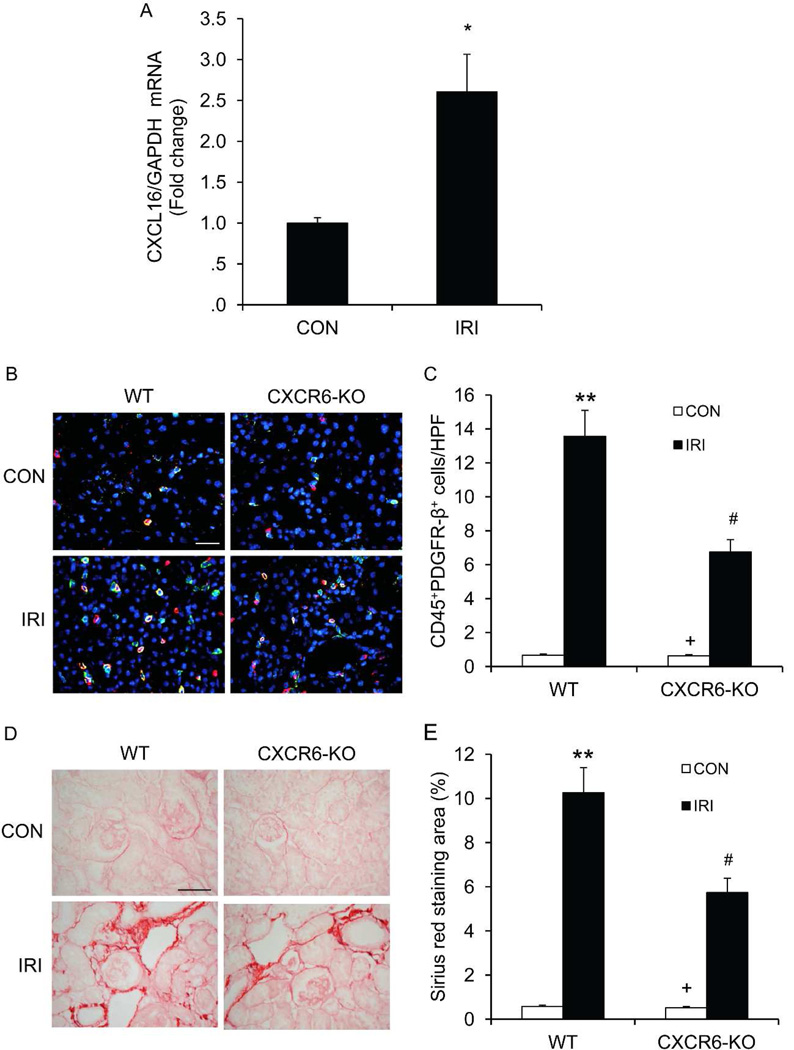
Bone marrow-derived fibroblasts in circulation are of hematopoietic origin, and they proliferate, differentiate into myofibroblasts, and express the chemokine receptor CXCR6. As chemokines mediate the trafficking of circulating cells to sites of injury, we studied the role of CXCR6 in mouse models of renal injury. Significantly, the kidney of CXCR6 knockout mice accumulated fewer bone marrow-derived fibroblasts in response to injury, expressed less profibrotic chemokines and cytokines, displayed fewer myofibroblasts, and expressed less α-smooth muscle actin in the obstructed kidneys compared with wild-type (WT) mice. CXCR6 deficiency inhibited total collagen deposition and suppressed the expression of collagen I and fibronectin in the obstructed kidneys. Furthermore, WT mice engrafted with CXCR6(-/-) bone marrow cells displayed fewer bone marrow-derived fibroblasts in the kidneys with obstructive injury and showed less severe renal fibrosis compared with WT mice engrafted with CXCR6(+/+) bone marrow cells. Transplant of WT bone marrow into CXCR6(-/-) recipients restored recruitment of myeloid fibroblasts and susceptibility to fibrosis. Hematopoietic fibroblasts migrate into injured kidney and proliferate and differentiate into myofibroblasts. Thus, CXCR6, together with other chemokines and their receptors, may have important roles in the recruitment of bone marrow-derived fibroblast precursors into the kidney and contribute to the pathogenesis of renal fibrosis.
Figures

Similar articles
-
CXCL16 recruits bone marrow-derived fibroblast precursors in renal fibrosis.J Am Soc Nephrol. 2011 Oct;22(10):1876-86. doi: 10.1681/ASN.2010080881. Epub 2011 Aug 4. J Am Soc Nephrol. 2011. PMID: 21816936 Free PMC article.
-
CCR2 regulates the uptake of bone marrow-derived fibroblasts in renal fibrosis.PLoS One. 2013 Oct 10;8(10):e77493. doi: 10.1371/journal.pone.0077493. eCollection 2013. PLoS One. 2013. PMID: 24130892 Free PMC article.
-
CXCR6 plays a critical role in angiotensin II-induced renal injury and fibrosis.Arterioscler Thromb Vasc Biol. 2014 Jul;34(7):1422-8. doi: 10.1161/ATVBAHA.113.303172. Epub 2014 May 22. Arterioscler Thromb Vasc Biol. 2014. PMID: 24855055 Free PMC article.
-
Targeting Bone Marrow-Derived Fibroblasts for Renal Fibrosis.Adv Exp Med Biol. 2019;1165:305-322. doi: 10.1007/978-981-13-8871-2_14. Adv Exp Med Biol. 2019. PMID: 31399971 Review.
-
Origin of myofibroblasts and cellular events triggering fibrosis.Kidney Int. 2015 Feb;87(2):297-307. doi: 10.1038/ki.2014.287. Epub 2014 Aug 27. Kidney Int. 2015. PMID: 25162398 Review.
Cited by
-
Cancer-associated fibroblast-secreted CXCL16 attracts monocytes to promote stroma activation in triple-negative breast cancers.Nat Commun. 2016 Oct 11;7:13050. doi: 10.1038/ncomms13050. Nat Commun. 2016. PMID: 27725631 Free PMC article.
-
CXCR6 deficiency attenuates pressure overload-induced monocytes migration and cardiac fibrosis through downregulating TNF-α-dependent MMP9 pathway.Int J Clin Exp Pathol. 2014 Sep 15;7(10):6514-23. eCollection 2014. Int J Clin Exp Pathol. 2014. PMID: 25400729 Free PMC article.
-
CXCR6 recruits Th2 cells and promotes liver fibrosis in schistosomiasis japonica.Hepatol Commun. 2025 Aug 26;9(9):e0784. doi: 10.1097/HC9.0000000000000784. eCollection 2025 Sep 1. Hepatol Commun. 2025. PMID: 40857398 Free PMC article.
-
Neural transcription factor Pou4f1 promotes renal fibrosis via macrophage-myofibroblast transition.Proc Natl Acad Sci U S A. 2020 Aug 25;117(34):20741-20752. doi: 10.1073/pnas.1917663117. Epub 2020 Aug 11. Proc Natl Acad Sci U S A. 2020. PMID: 32788346 Free PMC article.
-
TGF-β: the master regulator of fibrosis.Nat Rev Nephrol. 2016 Jun;12(6):325-38. doi: 10.1038/nrneph.2016.48. Epub 2016 Apr 25. Nat Rev Nephrol. 2016. PMID: 27108839 Review.
References
-
- Levey AS, Atkins R, Coresh J, et al. Chronic kidney disease as a global public health problem: approaches and initiatives - a position statement from Kidney Disease Improving Global Outcomes. Kidney Int. 2007;72:247–259. - PubMed
-
- Schainuck LI, Striker GE, Cutler RE, et al. Structural-functional correlations in renal disease. II. The correlations. Hum Pathol. 1970;1:631–641. - PubMed
-
- Nath KA. The tubulointerstitium in progressive renal disease. Kidney Int. 1998;54:992–994. - PubMed
-
- Neilson EG. Mechanisms of disease: Fibroblasts--a new look at an old problem. Nat Clin Pract Nephrol. 2006;2:101–108. - PubMed
-
- Strutz F, Muller GA. Renal fibrosis and the origin of the renal fibroblast. Nephrol Dial Transplant. 2006;21:3368–3370. - PubMed
Publication types
MeSH terms
Substances
Grants and funding
- K08 HL092958/HL/NHLBI NIH HHS/United States
- T32 DK062706/DK/NIDDK NIH HHS/United States
- P30 CA125123/CA/NCI NIH HHS/United States
- P30 AI036211/AI/NIAID NIH HHS/United States
- K08HL092958/HL/NHLBI NIH HHS/United States
- S10 RR024574/RR/NCRR NIH HHS/United States
- R01HL089792/HL/NHLBI NIH HHS/United States
- R01DK095835/DK/NIDDK NIH HHS/United States
- R01 DK095835/DK/NIDDK NIH HHS/United States
- RR024574/RR/NCRR NIH HHS/United States
- R01 HL089792/HL/NHLBI NIH HHS/United States
- CA125123/CA/NCI NIH HHS/United States
- T32DK062706/DK/NIDDK NIH HHS/United States
- AI036211/AI/NIAID NIH HHS/United States
LinkOut - more resources
Full Text Sources
Other Literature Sources
Research Materials
