. 2014 Mar 20;507(7492):376-380.
doi: 10.1038/nature13146. Epub 2014 Mar 12.

Endothelial Notch activity promotes angiogenesis and osteogenesis in bone

Affiliations

Endothelial Notch activity promotes angiogenesis and osteogenesis in bone

Saravana K Ramasamy et al. Nature. .

Abstract

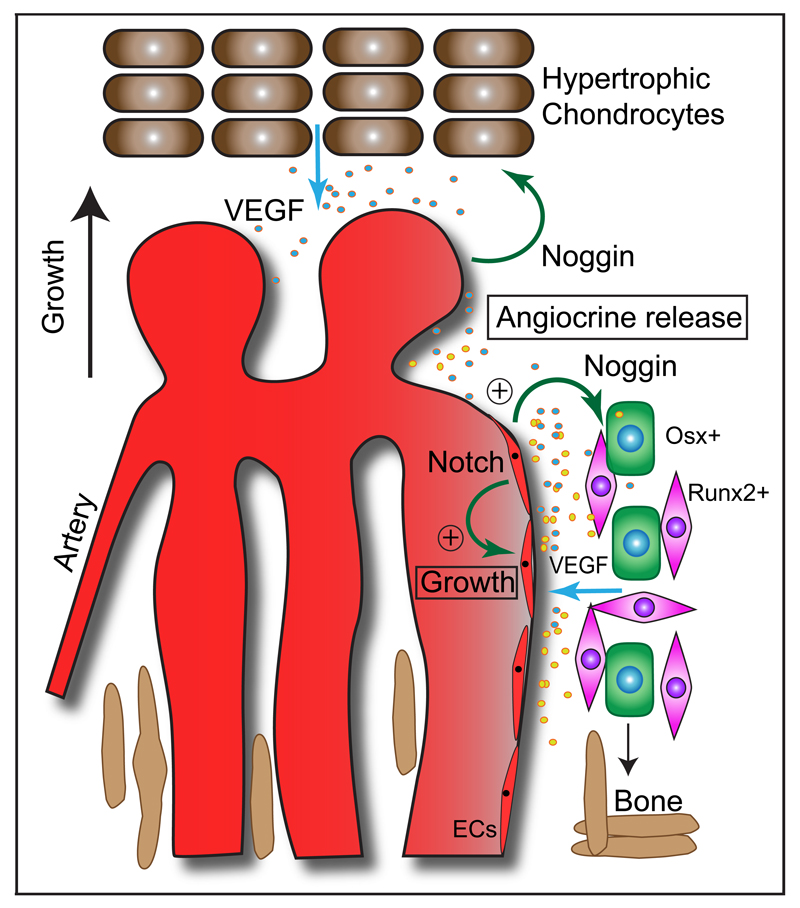
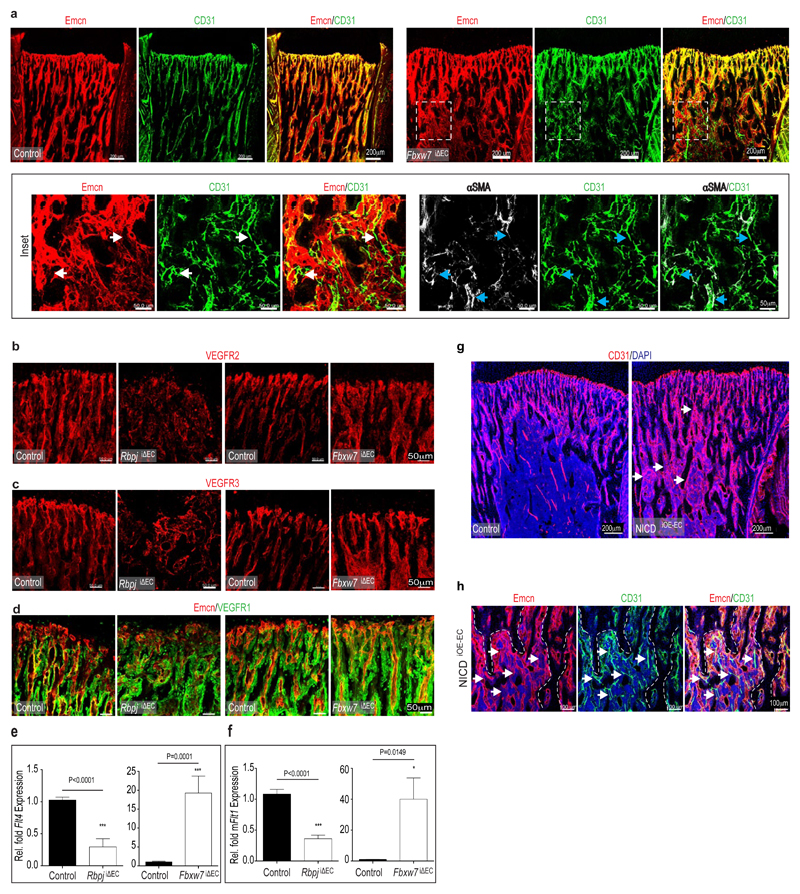
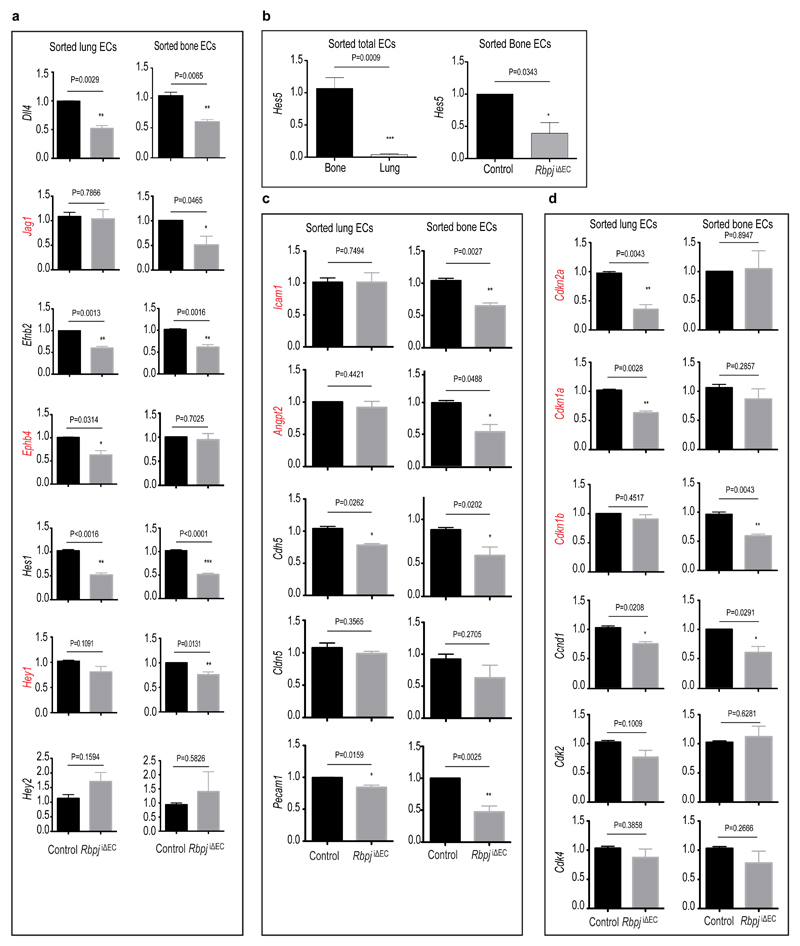
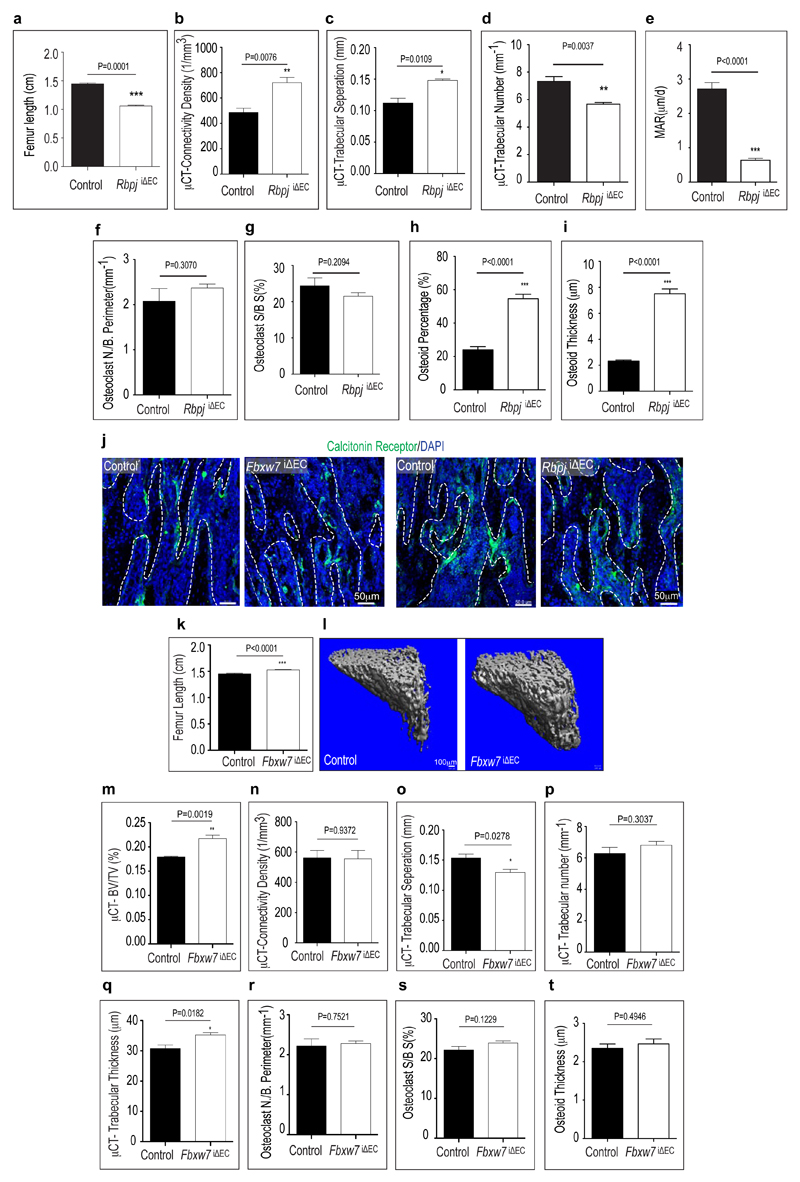
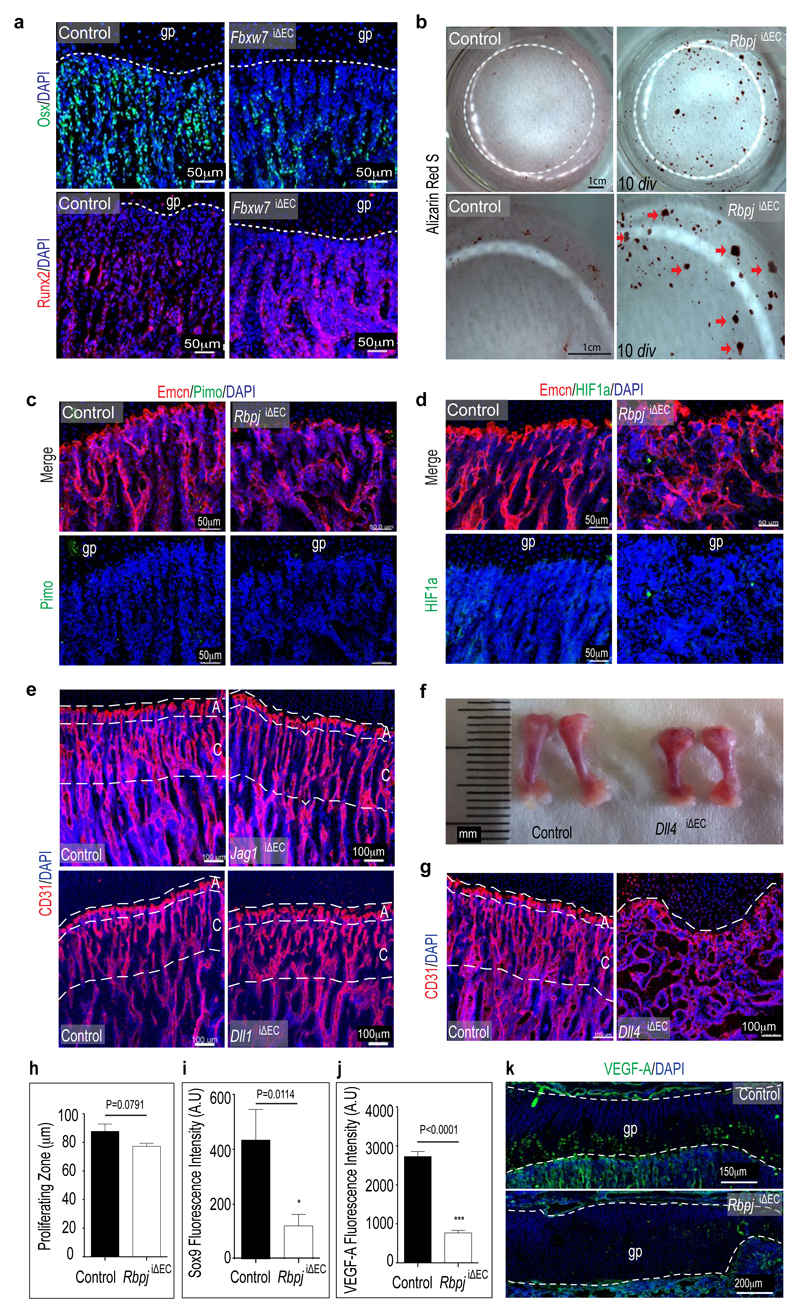
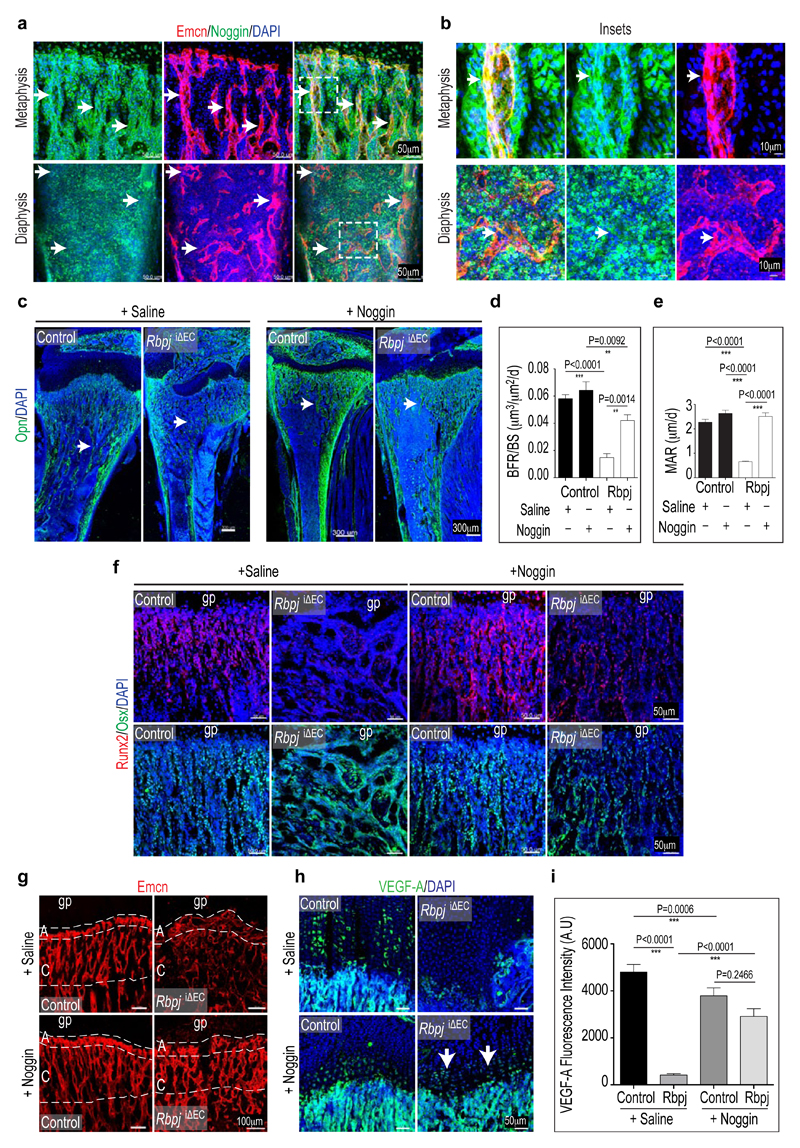
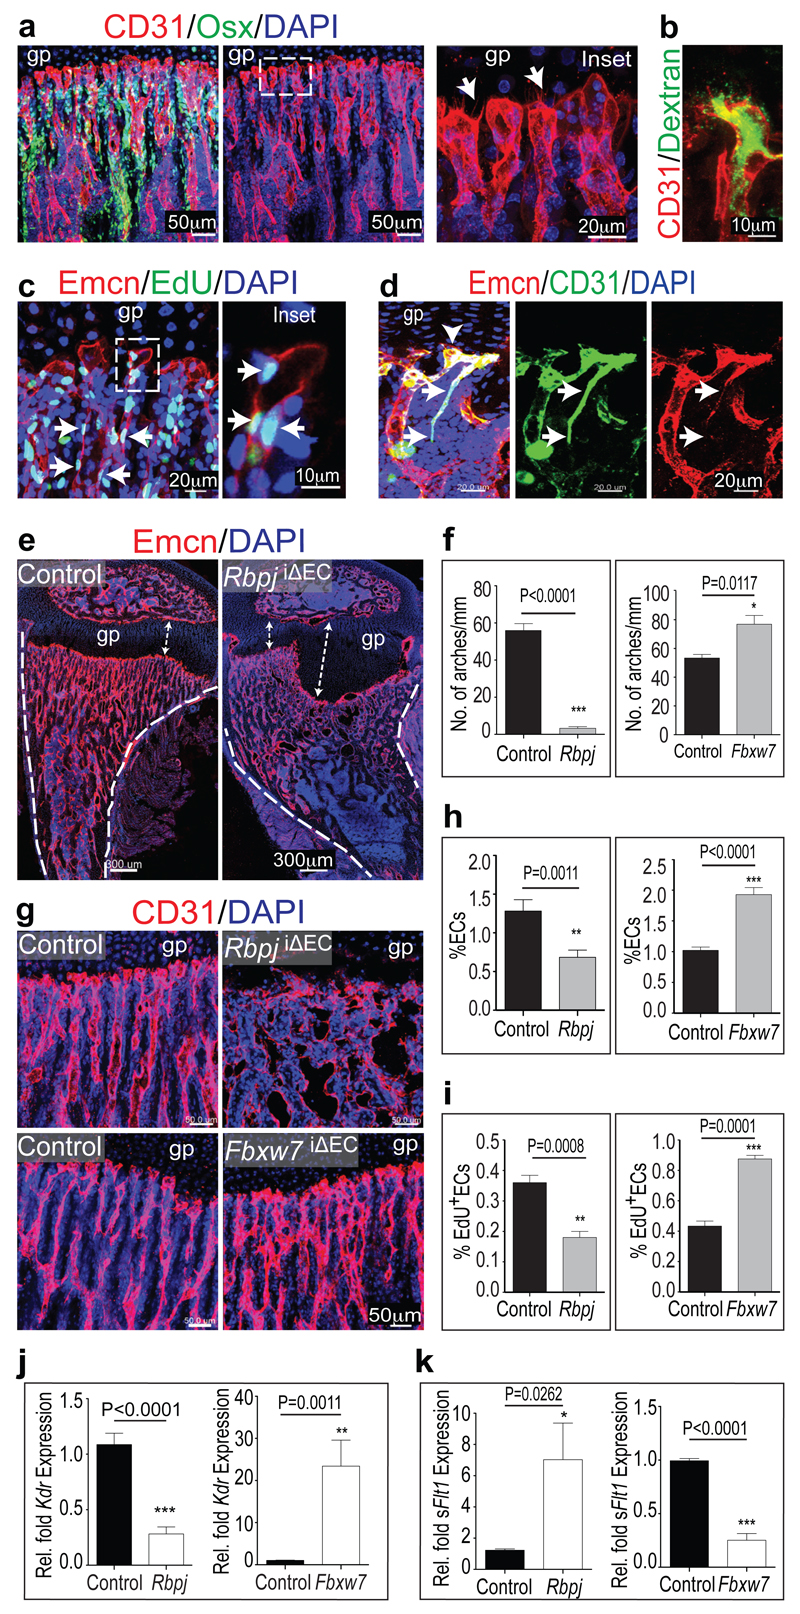
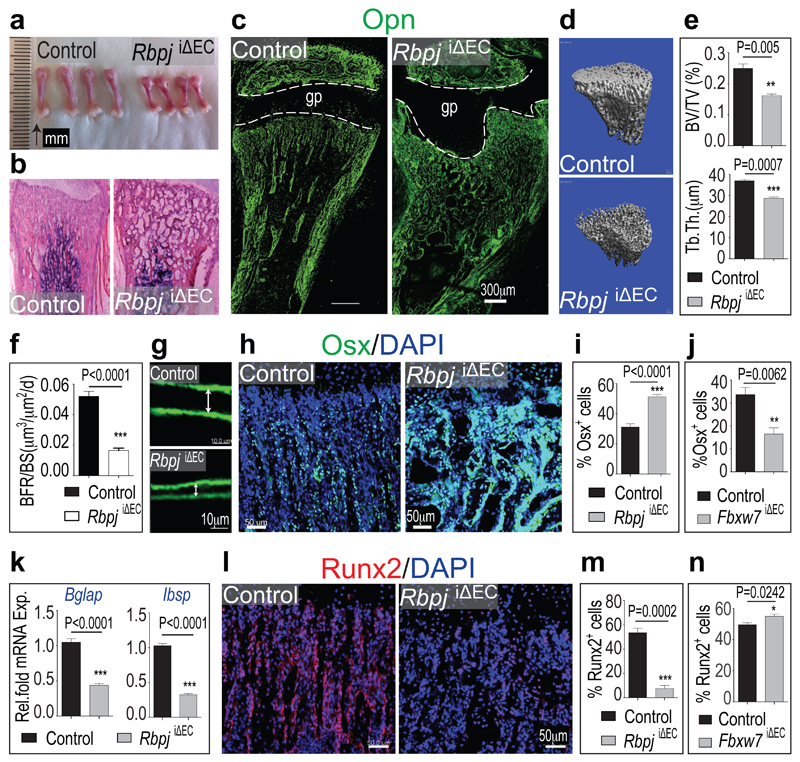
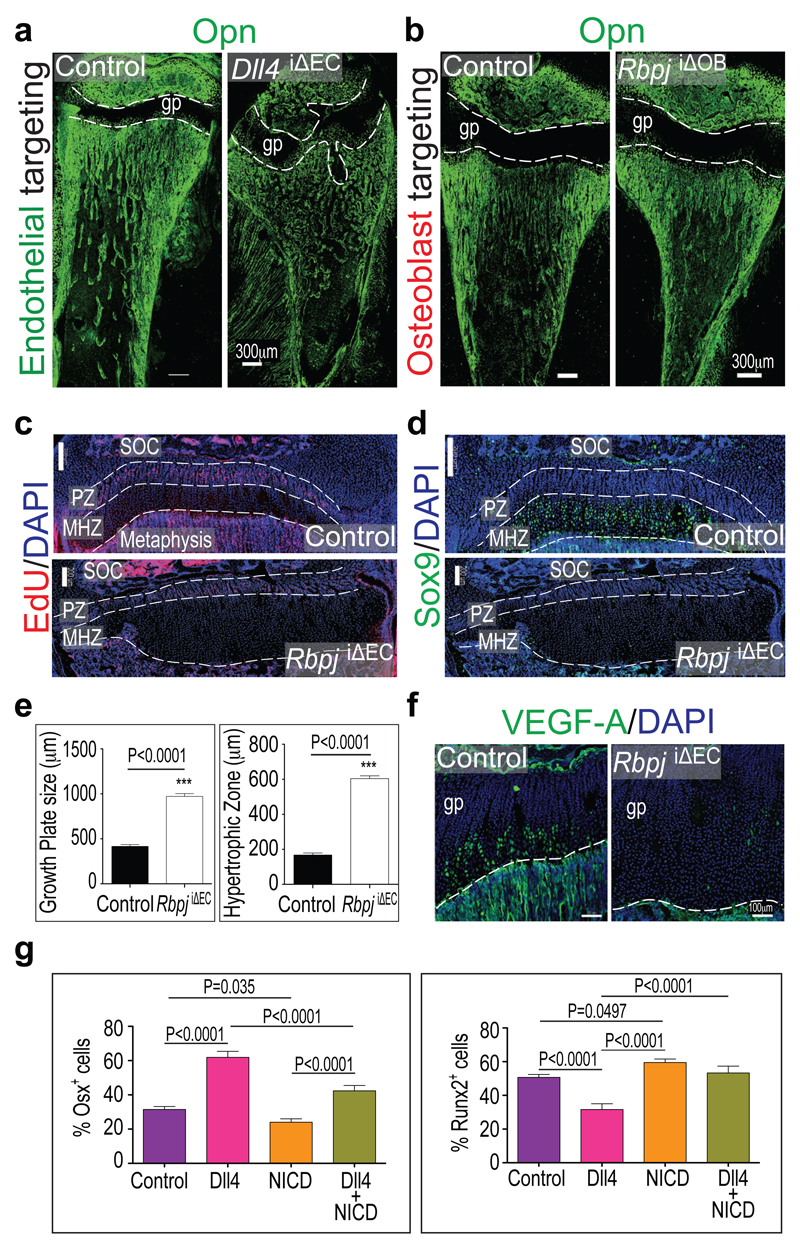
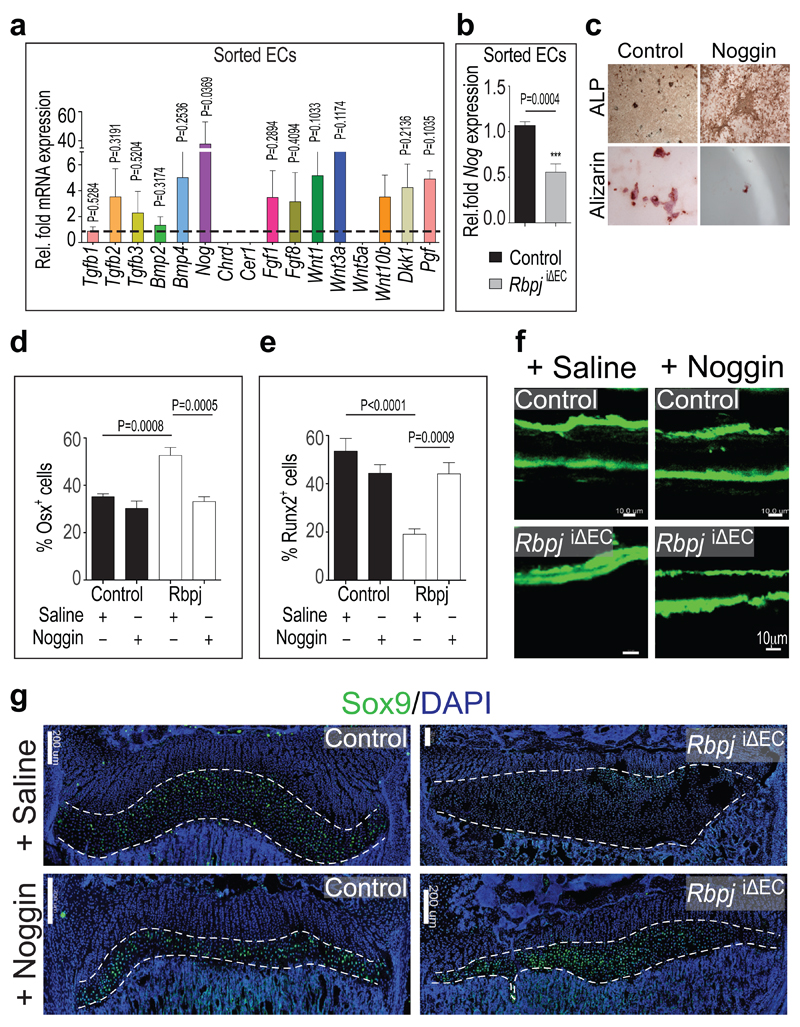
Blood vessel growth in the skeletal system and osteogenesis seem to be coupled, suggesting the existence of molecular crosstalk between endothelial and osteoblastic cells. Understanding the nature of the mechanisms linking angiogenesis and bone formation should be of great relevance for improved fracture healing or prevention of bone mass loss. Here we show that vascular growth in bone involves a specialized, tissue-specific form of angiogenesis. Notch signalling promotes endothelial cell proliferation and vessel growth in postnatal long bone, which is the opposite of the well-established function of Notch and its ligand Dll4 in the endothelium of other organs and tumours. Endothelial-cell-specific and inducible genetic disruption of Notch signalling in mice not only impaired bone vessel morphology and growth, but also led to reduced osteogenesis, shortening of long bones, chondrocyte defects, loss of trabeculae and decreased bone mass. On the basis of a series of genetic experiments, we conclude that skeletal defects in these mutants involved defective angiocrine release of Noggin from endothelial cells, which is positively regulated by Notch. Administration of recombinant Noggin, a secreted antagonist of bone morphogenetic proteins, restored bone growth and mineralization, chondrocyte maturation, the formation of trabeculae and osteoprogenitor numbers in endothelial-cell-specific Notch pathway mutants. These findings establish a molecular framework coupling angiogenesis, angiocrine signals and osteogenesis, which may prove significant for the development of future therapeutic applications.


Conflict of interest statement

The authors do not declare competing financial interests.

Figures

Extended Data Figure 1
Extended Data Figure 1. Schematic representation of key findings.
Organisation and role of growing vessels in the regulation of osteogenesis in postnatal long bone. Endothelial columns, which are embedded between segments of forming trabecular bone in the metaphysis, are interconnected by arches at their distal end. Blind-ended, lumen-containing protrusions extend from arches towards growth plate chondrocytes, a key source of VEGF-A. Endothelial Notch signalling promotes EC proliferation and vessel growth in bone, which is the opposite of its role in other tissues. Notch activity in ECs is also required for endothelial Noggin expression, controls the differentiation of perivascular osteoprogenitor cells and thereby osteogenesis. Endothelial Notch signalling and Noggin also promote chondrocyte maturation and hypertrophy, which affects angiogenesis through VEGF-A expression. These signalling interactions between different cell types couple angiogenesis and osteogenesis.
Extended Data Figure 2
Extended Data Figure 2. Vessel growth in the postnatal metaphysis.
a, b, Organisation of distal vessels in the metaphysis of 4 week-old tibia. Endothelial cells were visualized by anti-Endomucin (Emcn, red) immunostaining (a) or GFP expression (green) in Cdh5(PAC)-CreERT2 Rosa26-mT/mG double transgenic mice (b) at 4 weeks of age. Note blunt appearance of most distal vessels (top) in proximity of growth plate chondrocytes. Nuclei, blue (DAPI). c, Maximum intensity projection showing the organisation of distal, CD31-immunostained (type H) vessels in the tibial metaphysis at the indicated ages. Note emergence of blunt and blind-ended bulb-like protrusions (arrows) from arch vessels (arrowheads) at the distal end of endothelial columns. d, Confocal image showing expression of intercellular adhesion molecule 2 (ICAM2, red), a marker of lumenised vessels, in distal vessels of the tibial metaphysis. Nuclei, blue (DAPI). e, Podocalyxin (Podx, green), a sialoglycoprotein marking the apical surface of ECs and thereby the vascular lumen (arrows), is present on the most distal, CD31-positive (red) vessel structures in the metaphysis. Nuclei, blue (DAPI). f, Transmission electron microscopy confirming the lumenised nature of distal vessels close to growth plate chondrocytes (ch). Yellow arrowheads indicate thin ECs lining vessels. g, Quantitation of EdU labelled (proliferating) ECs in the metaphysis of long bone. EdU+ ECs were predominantly present in columnar vessels and were comparably rare (≤5%) in vascular arches (n=5 mice from 3 independent experiments). Error bars, ± s.e.m. P values, two-tailed unpaired t-test.
Extended Data Figure 3
Extended Data Figure 3. Marker expression in arch and bulb ECs.
a, Quantitative real time PCR analysis of transcripts encoding vessels guidance molecules in type H and type L ECs isolated by FACS from 4 week-old femur. Note high levels of transcripts for Netrin-1 (Ntn1), Netrin-3 (Ntn3), Neuropilin 1 (Nrp1), Plexin D1 (Plxnd1), Unc5b, and Robo4 in type H relative to type L endothelium (n=5 mice from 4 independent experiments). Error bars, ± s.e.m. P values, two-tailed unpaired t-test. b-f, Confocal images showing immunostaining of vessel guidance molecules such as Neuropilin 1 (b, Nrp1), Neuropilin 2 (c, Nrp2), Plexin D1 (d), Unc5b (e), Robo4 (f) in metaphyseal (type H) vessels and surrounding mesenchymal cells. High levels of Nrp1 were detected in type H ECs (arrows), but comparably lower expression was also observed in vessel-associated osteoprogenitors and growth plate chondrocytes (ch). Nrp2 is highly expressed in perivascular osteoprogenitors (arrowheads). High expression of PlexinD1 and Unc5b, and lower levels of Robo4 were detected in type H vessel bulbs and columns (arrows). g, Maximum intensity projection showing high expression of VEGFR3 in endothelial bulbs and arches (white arrows) compared to columns. VEGFR3 was absent in the arteries. h, Image showing Dll4 expression in type H ECs forming bulbs and arches in 4 week-old tibial metaphysis. With the exception of arteries (arrows), Dll4 expression was low in vessels of the diaphysis. i, Jag1 expression was detected in ECs (white arrows) and surrounding mesenchymal cells.
Extended Data Figure 4
Extended Data Figure 4. EC numbers, proliferation and Type H vessels in Notch mutants.
a,b, Representative flowcytometric graph plots showing the quantification of total and EdU-labelled ECs from RbpjiΔEC (a) or Fbxw7iΔEC (b) mutant bones or corresponding littermate controls, as indicated. CD31+ CD45- Ter119- ECs were substantially reduced in RbpjiΔEC mutants (a). Conversely, endothelial cell number and proliferation were increased after inactivation of Fbxw7 (b). c, Maximum intensity projections of EdU-labelled (green fluorescence) tibial metaphysis showing proliferating cells in 4week-old Notch gain-of-function (Fbxw7iΔEC) and loss-of-function (RbpjiΔEC) mutants and corresponding littermate controls. ECs were visualised by Emcn immunostaining (red) and nuclei by DAPI (blue). d, Confocal images of Emcn (red) immunostained endothelial distal columns and arches next to growth plate chondrocytes (ch) highlighting the distribution of filopodia (arrowheads). Note that filopodia were directed towards chondrocytes in controls whereas directionality was compromised in RbpjiΔEC mutants. e, Quantitation of filopodia indicating higher variability in RbpjiΔEC samples (n=6 mice from 4 independent litters). Error bars, ± s.e.m. P values, two-tailed unpaired t-test. f, Quantitative analysis of type H vessels in 4 week-old Fbxw7iΔEC mutants and littermate controls (n=6 mice from 4 independent litters). Error bars, ± s.e.m. P values, two-tailed unpaired t-test. g,h, Maximum intensity projections of CD31 (green) and Endomucin (red) immunostained vessels in the metaphysis of 4 week-old RbpjiΔEC (g) and Fbxw7iΔEC mutants (h). Note loss of type H vessels and decreased CD31 (green) staining in the RbpjiΔEC metaphysis, while CD31+ vessels were extended after EC-specific inactivation of Fbxw7. Arrows indicate arteries.
Extended Data Figure 5
Extended Data Figure 5. Arterial specification and VEGF receptor expression in Notch mutants.
a, Maximum intensity projections of Emcn (red,) and CD31 (green) immunostained sections of 4 week-old tibia showing increase in CD31+ (type H) vessels in Fbxw7iΔEC mice. Mutants also displayed numerous small CD31+ Endomucin-arterioles (white arrows), which were associated with αSMA+ cells (blue arrows in bottom panels). b-d, Confocal images showing 4 week-old RbpjiΔEC or Fbxw7iΔEC mutant, or corresponding littermate control metaphysis after immunostaining for different VEGF receptors. VEGFR2 was highest on control arches, bulbs and arteries, and staining was strongly reduced in the RbpjiΔEC metaphysis (b). VEGFR3 immunostaining decorated arches and bulb protrusion but was absent in the arteries. Staining was reduced in RbpjiΔEC mutants but enhanced in Fbxw7iΔEC vessels (c). Expression of VEGFR1 was predominantly found on perivascular mesenchymal and osteoprogenitor cells. Expression in these populations was not appreciably altered (d). e, f, qPCR analysis of sorted ECs from Notch loss-of-function (RbpjiΔEC, e) and gain-of-function (Fbxw7iΔEC, f) mice. In ECs, Notch positively regulated transcripts for the receptors VEGFR2 (Kdr), VEGFR3 (Flt4), and membrane-anchored VEGFR1 (mFlt1). In contrast, expression of soluble Flt1 (sFlt1), a known antagonist of VEGF signalling, was increased in RbpjiΔEC ECs and significantly reduced in Fbxw7iΔEC cells (n=4 mice from 4 independent litters). Error bars, ± s.e.m. P values, two-tailed unpaired t-test. g, Increased formation of CD31+ (red) vessels in the metaphysis of 4 week-old Notch gain-of-function mice after EC-specific overexpression of active Notch (NICDiOE-EC). Nuclei, blue (DAPI). h, Confocal images showing extensive formation of CD31+ (green) Emcn- (red) arterioles (arrows) in the NICDiOE-EC metaphysis. Nuclei, DAPI (blue).
Extended Data Figure 6
Extended Data Figure 6. Gene expression in Rbpj mutant bone and lung ECs.
a, qPCR analysis of freshly isolated ECs from control and RbpjiΔEC mutant lung or bone. Relative fold mRNA expression of Notch target genes such as Dll4, Jag1, Efnb2, EphB4, Hes1, Hey1, Hey2 is shown. Differently expressed genes are marked in red (n=4 mice from 4 independent litters). Error bars, ± s.e.m. P values, two-tailed unpaired t-test. b, Quantitative PCR analysis of expression the Notch target gene Hes5 in sorted ECs from 4 week-old wild-type bone and lung (a), and from RbpjiΔEC mutant and littermate control bone samples (b). Note very low expression of Hes5 in lung compared to bone ECs and its reduction in the RbpjiΔEC mutant bone endothelium. Data represent relative fold mRNA expression (n=4 mice from 4 independent litters). Error bars, ± s.e.m. P values, two-tailed unpaired t-test. c, qPCR results for transcripts encoding Intercellular Adhesion Molecule 1 (Icam1), angiopoietin 2 (Angpt2), VE-cadherin (Cdh5), and CD31 (Pecam1). Data represent relative fold mRNA expression. Differently expressed genes are marked in red (n=4 mice from 4 independent litters). Error bars, ± s.e.m. P values, two-tailed unpaired t-test. d, Relative fold mRNA expression of cyclin-dependent kinase inhibitor 2A (Cdkn2a), cyclin-dependent kinase inhibitor 1A (Cdkn1a), cyclin-dependent kinase inhibitor 1B (Cdkn1b), cyclin D1 (Ccnd1), cyclin-dependent kinase 2 (Cdk2), and cyclin-dependent kinase 4 (Cdk4) in control or RbpjiΔEC mutant lung and bone ECs (n=4 mice from 4 independent litters). Error bars, ± s.e.m. P values, two-tailed unpaired t-test.
Extended Data Figure 7
Extended Data Figure 7. Endothelial Notch controls osteogenesis.
a-i, Analysis of bone parameters in 4 week-old RbpjiΔEC mutants and control littermates. Data on femur length is shown in (a). Connectivity density (number of connections per unit volume, b), trabecular bone separation (size of space separating trabeculae, c), trabecular number (number of trabeculae per mm length, d) were obtained by µ-CT. Mineral Apposition Rates (MAR, e) were calculated using calcein double labelling. Data on osteoclast number per bone perimeter (f), osteoclast surface per bone surface (g), osteoid percentage (h), and osteiod thickness (i) are based on histomorphometrical characterization of control and mutant samples (n=6 mice from 4 independent litters). Error bars, ± s.e.m. P values, two-tailed unpaired t-test. j, Osteoclasts were identified by immunostaining for Calcitonin Receptor (green). Maximum intensity projection of Calcitonin receptor stained metaphysis region of tibial sections of Notch gain-of-function (Fbxw7iΔEC) and loss-of-function (RbpjiΔEC) mutants along with their respective littermate controls. Nuclei, DAPI (blue). k-t, Analysis of bone parameters in 4 week-old Fbxw7iΔEC mutants and control littermates. Femur length is shown in (k). µ-CT data (l) were used for the analysis of bone density (bone volume/total volume; BV/TV, m), connectivity density (number of connections per unit volume, n), trabecular bone separation (size of space separating trabeculae, o), trabecular number (number of trabeculae per mm length, p), and trabecular thickness (q). Data on osteoclast number per bone perimeter (r), osteoid percentage (s), and osteiod thickness (t) are based on histomorphometrical characterization of control and mutant samples (n=6 mice from 4 independent litters). Error bars, ± s.e.m. P values, two-tailed unpaired t-test.
Extended Data Figure 8
Extended Data Figure 8. Endothelial Notch controls mesenchymal cell differentiation.
a, Confocal images showing immunostaining for mesenchymal lineage markers Osx (green) and Runx2 (red) in Fbxw7iΔEC and littermate control tibiae, as indicated. Nuclei, DAPI (blue). Note reduction of Osx+ cells and increased Runx2+ population after targeting of Fbxw7 in ECs. b, Analysis of differentiation capacity of primary mesenchymal cells isolated from RbpjiΔEC or control bone. Alizarin Red S staining after 10 days in vitro (10 div) showed that mesenchymal cells isolated from EC-specific RbpjiΔEC mutants generated mineral nodules (red arrows) prematurely in comparison to controls. c,d, Maximum intensity projection of stained RbpjiΔEC and control tibiae. Labelling of hypoxic cells with pimonidazole (Pimo, green) showed no overt differences between control and RbpjiΔEC samples (c). Likewise, anti-HIF1α immunostaining (green) was comparable in the control and RbpjiΔEC metaphysis (d). Endothelial cells (Emcn antibody staining, red); nuclei, DAPI (blue). e, Representative confocal images showing that EC-specific gene targeting of Jaggedl (Jag1) or Delta-like 1 (D11 1) did not lead to appreciable alterations Jag1iΔEC or Dll1iΔEC mutant metaphyseal vasculature at 4 weeks. Dashed lines indicate vessel columns (C) and distal arches (A). Endothelial cells, CD31 (red); nuclei, DAPI (blue). f, Smaller size of freshly isolated femurs from 4 week-old Dll4iΔEC mutants relative to littermate controls. g, Disrupted organisation of vessel arches (A) and columns (C) in the Dll4iΔEC metaphyseal vasculature. Endothelial cells, CD31 (red); nuclei, DAPI (blue). h, Quantitative analysis of size of chondrocyte proliferating zone in littermate control and RbpjiΔEC mutants (n=6 mice from 4 independent litters). Error bars, ± s.e.m. P values, two-tailed unpaired t-test. i,j, Quantification of Sox9 (i) and VEGF-A (j) fluorescence intensity in immunostained sections of RbpjiΔEC mutants showing decreased signals in mutant growth plates (n=4 mice from 3 independent litters). Error bars, ± s.e.m. P values, two-tailed unpaired t-test. k, Maximum intensity projection of stained RbpjiΔEC and littermate control tibiae showing decreased VEGF-A immunosignals.
Extended Data Figure 9
Extended Data Figure 9. EC-dependent regulation of growth plate and bone.
a-c, Quantitative analysis of growth plate of Fbxw7iΔEC mutants and their littermates-growth plates (a), proliferating zones (b) and maturation/hypertrophy zones (c) relative to their respective control littermates (n=4 mice from 3 independent litters). Error bars, ± s.e.m. P values, two-tailed unpaired t-test. d, e, Quantitative PCR analysis of Vegfa transcripts level in the bones (without marrow cells) of Notch mutants (RbpjiΔEC and Fbxw7iΔEC) and respective littermate controls (n=4 mice from 3 independent litters). Error bars, ± s.e.m. P values, two-tailed unpaired t-test. f, g, Maximum intensity projection of stained Fbxw7iΔEC and littermate control tibiae. Note slight reduction of mutant growth plate and maturation/hypertrophy zone (MHZ) EdU (red) labelling (f) marks mitotic chondrocytes in the proliferating zone (PZ). Sox9 (green) immunosignals (g) label maturing and hypertrophic chondrocytes. Dashed lines mark borders of PZ and MHZ. Nuclei, DAPI (blue). h, Maximum intensity projections of tile scanned tibial sections of Col1a1-CreERT2 ROSA26-mT/mG double transgenic mice. GFP expression (green) indicates Cremediated recombination. i, Maximum intensity projections showing overlapping GFP (green) and Col1α immunostaining (red). j, Maximum intensity projections showing osteoblasts expressing GFP (green). GFP signals were not seen in Emcn immunostained ECs (red). k, Normal arrangement of CD31-stained endothelial columns (C) and arches (A) after Col1a1-CreERT2-mediated inactivation of Rbpj in cells of the osteoblast lineage (RbpjiΔOB). Nuclei, DAPI (blue). l, m, Maximum intensity projections tile-scanned tibia sections after anti-Emcn (red) immunostaining. Nuclei, DAPI (blue). Note profound disorganisation of the Dll4iΔEC metaphyseal vasculature (l) and restoration by simultaneous EC-specific overexpression of active Notch in Dll4iΔEC/NICDiOE-EC double mutant mice (m). n, Tile scan confocal images of osteopontin (Opn, green) stained control and Dll4iΔEC/NICDiOE-EC tibiae showing that endothelial NICD expression can rescue trabecular bone defects in the Dll4iΔEC background (see Fig. 2c for comparison). o, Organisation of the Emcn-stained metaphyseal vasculature and arrangement of osteoblasts (Osx) in tibia section from 4 week-old control, Dll4iΔEC, NICDiOE-EC, and Dll4iΔEC/NICDiOE-EC mice, as indicated. Nuclei, DAPI (blue). p, Sox9 immunostaining (green) in the epiphyseal region of 4-week old tibia showing normalised maturing and hypertrophic chondrocytes zone (MHZ) in the growth plate of Dll4iΔEC/NICDiOE-EC mice. Dashed lines mark borders of MHZ. Nuclei, DAPI (blue).
Extended Data Figure 10
Extended Data Figure 10. Notch and angiocrine Noggin production.
a, Noggin (green) in the wild-type tibial metaphysis was detected in Emcn+ (red) ECs as well as surrounding mesenchymal cells. In contrast, the diaphysis contained Noggin+ hematopoietic cells, whereas only weak staining was seen in sinusoidal blood vessels. b, Panels show higher magnifications of insets in (a). Nuclei, DAPI (blue). c, Confocal tile scans of osteopontin-immunostained tibia sections showing partial restoration of trabecular bone formation in 4week-old RbpjEC mice after administration of recombinant Noggin. Left panels show Saline-treated RbpjiΔEC mutants and littermate controls. Nuclei, DAPI (blue). d,e, Noggin treatment restored the bone formation rate (BFR, d) and mineral apposition rate (MAR, e) in RbpjiΔEC long bone to control level (n=6 mice from 4 independent litters). Data represent mean±s.e.m. One-way ANOVA was performed along with Bonferroni’s multiple comparison post-hoc test. f, Systemic administration of recombinant Noggin protein reduced the number of Osx+ cells (green) and increased Runx2+ early osteoprogenitors in the RbpjiΔEC metaphysis in comparison to vehicle-treated (Saline) mutants. g, Maximum intensity projection of Emcn-immunostained of control and RbpjiΔEC tibia sections after treatment with Saline or recombinant Noggin, as indicated. Emcn staining intensity was increased in Noggin-treated RbpjiΔEC samples, and the organisation of endothelial column and arch structures was partially restored. Dashed lines indicate position of boundaries between endothelial arches (A) and columns (C) as seen in littermate control samples. h, i, Confocal images of VEGF-A (green) immunostained tibia sections showing growth plate chondrocytes in RbpjiΔEC mice after Noggin treatment. Note partial restoration of VEGF-A expression in Noggin- but not vehicle control-treated (Saline) RbpjiΔEC mutants (h). Nuclei, DAPI (blue). Quantification data showing fluorescence intensity (in arbitrary units) of VEGF-A expression recovered in the tibial sections of these animals (i) (n=6 mice from 4 independent litters). Data represent mean ± s.e.m. One-way ANOVA was performed along with Bonferroni’s multiple comparison post-hoc test.
Figure 1
Figure 1. Bone angiogenesis and regulation by Notch.
a, Confocal images showing the metaphyseal vasculature in 4 week-old tibia. Osterix+ (Osx, green) osteoblastic cells are closely associated with CD31+ (red) ECs. Nuclei, 4',6-diamidino-2-phenylindole (DAPI, blue). Note parallel arrangement of vessels pointing towards growth plate (gp). Right panel shows higher magnification of inset with bulb-shaped endothelial protrusions and filopodia (arrows). b, Dextran perfusion of lumen in distal vessel within metaphysis of 4 week-old tibia. c, Maximum intensity projection showing proliferating (EdU+, green) cells in metaphysis. ECs, Emcn (red); nuclei, DAPI (blue). Note abundant EdU+ ECs in columns. Inset shows single plane of EdU+ arch ECs. d, 10 week-old tibia showing connection between CD31+/Emcn- arteriole (arrows)and CD31+/Emcn+ vascular arch (arrowhead). e, Defective metaphyseal vasculature and enlarged growth plate (gp, arrows) in RbpjiΔEC tibia. Dashed lines, cortical bone; nuclei, DAPI (blue). f, Distal arches (per mm length of metaphysis) were reduced in RbpjiΔEC tibiae and increased in Fbxw7iΔEC samples. (n=6 mice bones from 4 independent litters), Error bars, ± s.e.m. P values, two-tailed unpaired t-tests. g, Confocal images showing defective CD31+ vessels (red) in RbpjiΔEC tibia and increased Fbxw7iΔEC vessel density. Nuclei, DAPI (blue). h, i, Flow cytometric quantitation of percentage of total (CD45- Ter119- CD31+) ECs (h) (n=6 mice from 4 independent litters) and EdU+ ECs (i) (n=5 mice from 4 independent litters) in RbpjiΔEC or Fbxw7iΔEC bone samples relative to controls. Error bars, ± s.e.m. P values, two-tailed unpaired t-tests. j, k, qPCR analysis of VEGFR2 (Kdr) and soluble VEGFR1 (sFlt1) in sorted RbpjiΔEC and Fbxw7iΔEC bone ECs (n=4 mice from 4 independent litters). Error bars, ± s.e.m. P values, two-tailed unpaired t-test.
Figure 2
Figure 2. Endothelial Notch signalling regulates osteogenesis.
a, Decreased length of freshly dissected RbpjiΔEC femurs compared to control littermates. b, Hematoxylin/eosin-stained longitudinal RbpjiΔEC and control tibia sections. c, Osteopontin (Opn) immunostaining showing defective formation of trabeculae in P28 RbpjiΔEC tibia. d, 3D µ-CT reconstruction of 4 week-old control and RbpjiΔEC metaphysis. e, Reduced trabecular bone volume density measured as bone volume/total volume (BV/TV) and trabecular bone thickness (Tb.Th) in RbpjiΔEC mice. f, g, Bone Formation Rate per Bone Surface (BFR/BS, f) calculated by calcein double labelling (7 day time interval) confirmed decreased bone formation in P28 Rbpj mutants. Arrows in (g) mark distance between calcein-labelled layers (n=10 mice from 6 independent litters). Error bars, ± s.e.m. P value, two-tailed unpaired t-tests. h, Osterix (Osx) immunostaining shows strongly increased osteoprogenitor numbers in RbpjiΔEC metaphysis. i, j, Quantitation of metaphyseal Osx+ cells in RbpjiΔEC (i) and Fbxw7iΔEC mutants (j) relative to controls (n=6 mice from 4 independent litters). Error bars, ± s.e.m. P values, two-tailed unpaired t-tests. k, qPCR analysis showing reduced expression of mature osteoblast markers (Bglap, Ibsp) in RbpjiΔEC bones (n=6 mice from 4 independent litters). 1, Immunostaining showing decrease of Runx2+ early osteoprogenitors in 4 week-old RbpjiΔEC tibiae. m, n, Quantitation of metaphyseal Runx2+ cells in RbpjiΔEC (m) and Fbxw7iΔEC mutants (n) relative to littermate controls (n=6 mice from 4 independent litters). Error bars, ± s.e.m. P values, two-tailed unpaired t-tests.
Figure 3
Figure 3. Osteogenesis requires EC-autonomous Notch signalling.
a, b, Osteopontin (Opn) immunostaining showing malformed bone and growth plate (gp, dashed lines) in 4 week-old Dll4iΔEC (a) but not in osteoblast-specific Rbpj mutant (RbpjiOB) tibiae (b). c, d, Confocal images of control and RbpjiΔEC EdU-labelled proliferating zones (PZ, c) and Sox9 immunostained maturation/hypertrophy zones (MHZ, d). Note diminished Sox9 in RbpjiΔEC mutant. Dashed lines mark PZ and MHZ borders. SOC, secondary ossification centre; nuclei, DAPI (blue). e, Quantitative analysis of the sizes of RbpjiΔEC and Fbxw7iΔEC mutant growth plates and maturation/hypertrophy zones (n=6 mice from 4 independent litters). Error bars, ± s.e.m. P values, two-tailed unpaired t-test. f, Strongly reduced VEGF-A immunostaining (green) in P28 RbpjiΔEC mutant growth plate (gp) chondrocytes. g, h, Quantitative analysis of Osx+ (i) and Runx2+ (j) cells in control, Dll4, NICD, or Dll4+NICD tibiae, as indicated. Controls are littermate animals without Cre expression (n=4 mice from 4 independent litters). Error bars, ± s.e.m. P values, oneway ANOVA with Bonferroni’s multiple comparison post-hoc test.
Figure 4
Figure 4. DRole of Notch-dependent, angiocrine Noggin expression.
a, Tgfb1, Tgfb2, Tgfb3, Bmp2, Bmp4, Nog, Chrd, Cer1, Fgf1, Fgf8, Wnt1, Wnt3a, Wnt5a, Wnt10b, Dkk1, and Pgf mRNA expression in isolated bone ECs from Fbxw7iΔEC mice normalized to littermate controls (dashed line) (n=4 mice from 4 independent litters). Error bars, ± s.e.m. P values, two-tailed unpaired t-test. b, qPCR analysis showing reduced Nog expression in ECs sorted from RbpjiΔEC long bone mice (n=4 mice from 4 independent litters). Error bars, ± s.e.m. P value, two-tailed unpaired t-test. c, Noggin-mediated inhibition of osteoblastic differentiation of cultured murine mesenchymal progenitors. Mineral nodule formation (Alizarin staining) was supressed, and alkaline phosphatase (ALP) retained by Noggin after 28 days of in vitro differentiation. d, e, Quantitation of Osx+ (d) and Runx2+ cells (e) in Noggin-treated vs. Saline control and RbpjiΔEC long bones (n=6 mice from 4 independent litters). Error bars, ± s.e.m. P values, one-way ANOVA with Bonferroni’s multiple comparison post-hoc test. f, Calcein double labelling in RbpjiΔEC mutant or control tibiae treated with Saline or Noggin, as indicated. Noggin strongly improved RbpjiΔEC mineral apposition rates. g, Noggin restored RbpjiΔEC growth plate size and Sox9 expression (green) in the maturation/hypertrophy zone (marked by dashed lines). Nuclei, DAPI (blue).

Comment in

References

    1. Eshkar-Oren I, et al. The forming limb skeleton serves as a signaling center for limb vasculature patterning via regulation of Vegf. Development. 2009;136:1263–1272. - PubMed
    1. Maes C, et al. Osteoblast precursors, but not mature osteoblasts, move into developing and fractured bones along with invading blood vessels. Dev Cell. 2010;19:329–344. - PMC - PubMed
    1. Benedito R, et al. The notch ligands Dll4 and Jagged1 have opposing effects on angiogenesis. Cell. 2009;137:1124–1135. - PubMed
    1. Noguera-Troise I, et al. Blockade of Dll4 inhibits tumour growth by promoting non-productive angiogenesis. Nature. 2006;444:1032–1037. - PubMed
    1. Skawina A, Litwin JA, Gorczyca J, Miodonski AJ. The vascular system of human fetal long bones: a scanning electron microscope study of corrosion casts. J Anat. 1994;185:369–376. - PMC - PubMed

Publication types

MeSH terms