. 2014 Mar 19;9(3):e92444.
doi: 10.1371/journal.pone.0092444. eCollection 2014.

ColonyArea: an ImageJ plugin to automatically quantify colony formation in clonogenic assays

Affiliations

ColonyArea: an ImageJ plugin to automatically quantify colony formation in clonogenic assays

Camilo Guzmán et al. PLoS One. .

Abstract

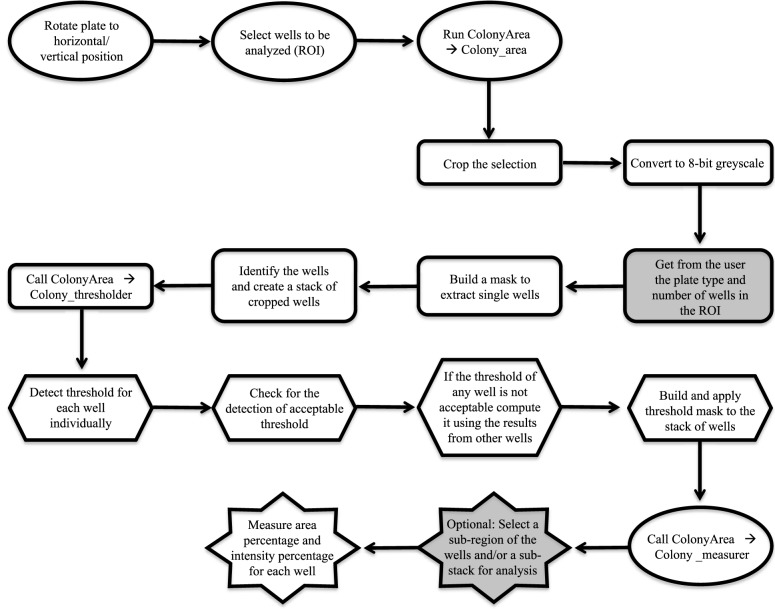
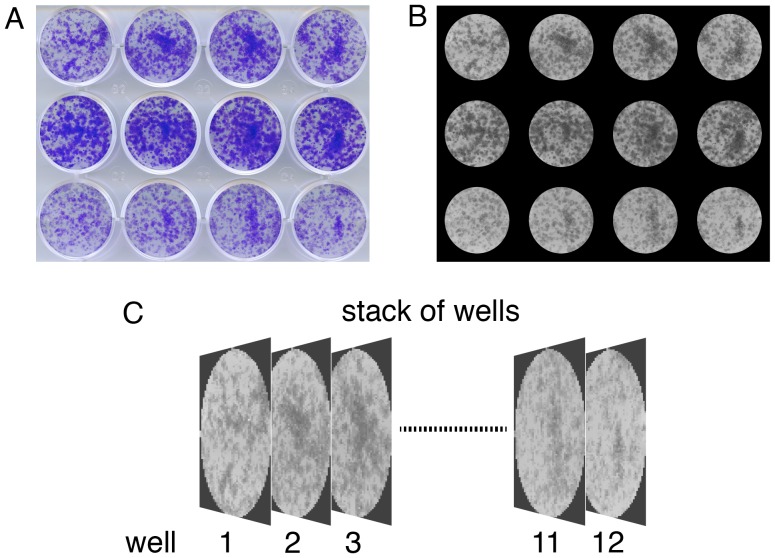
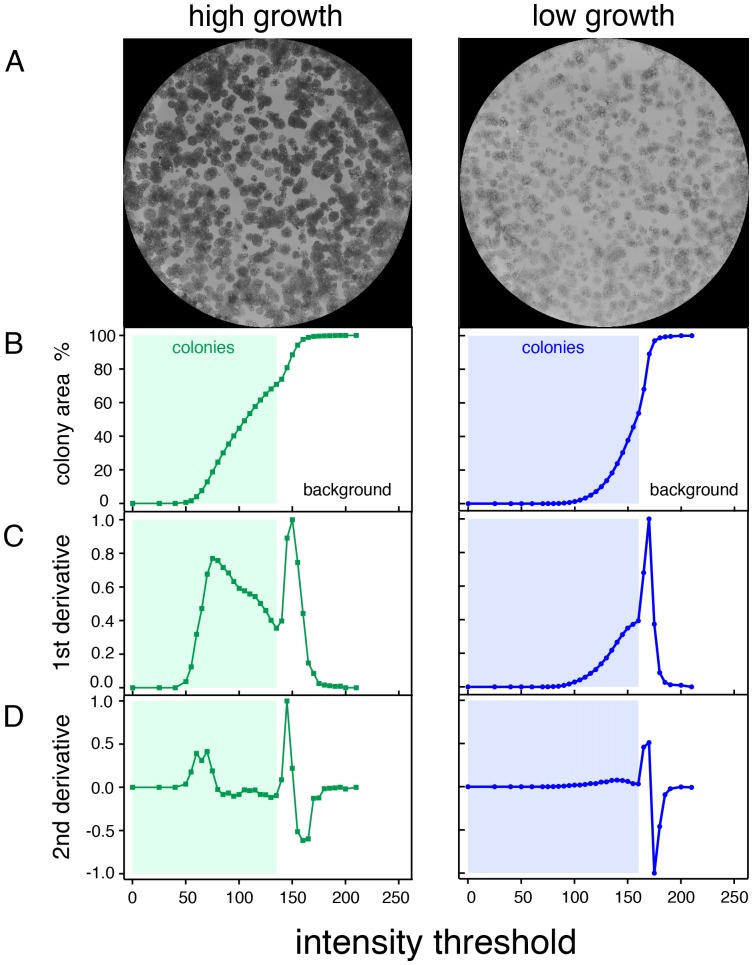
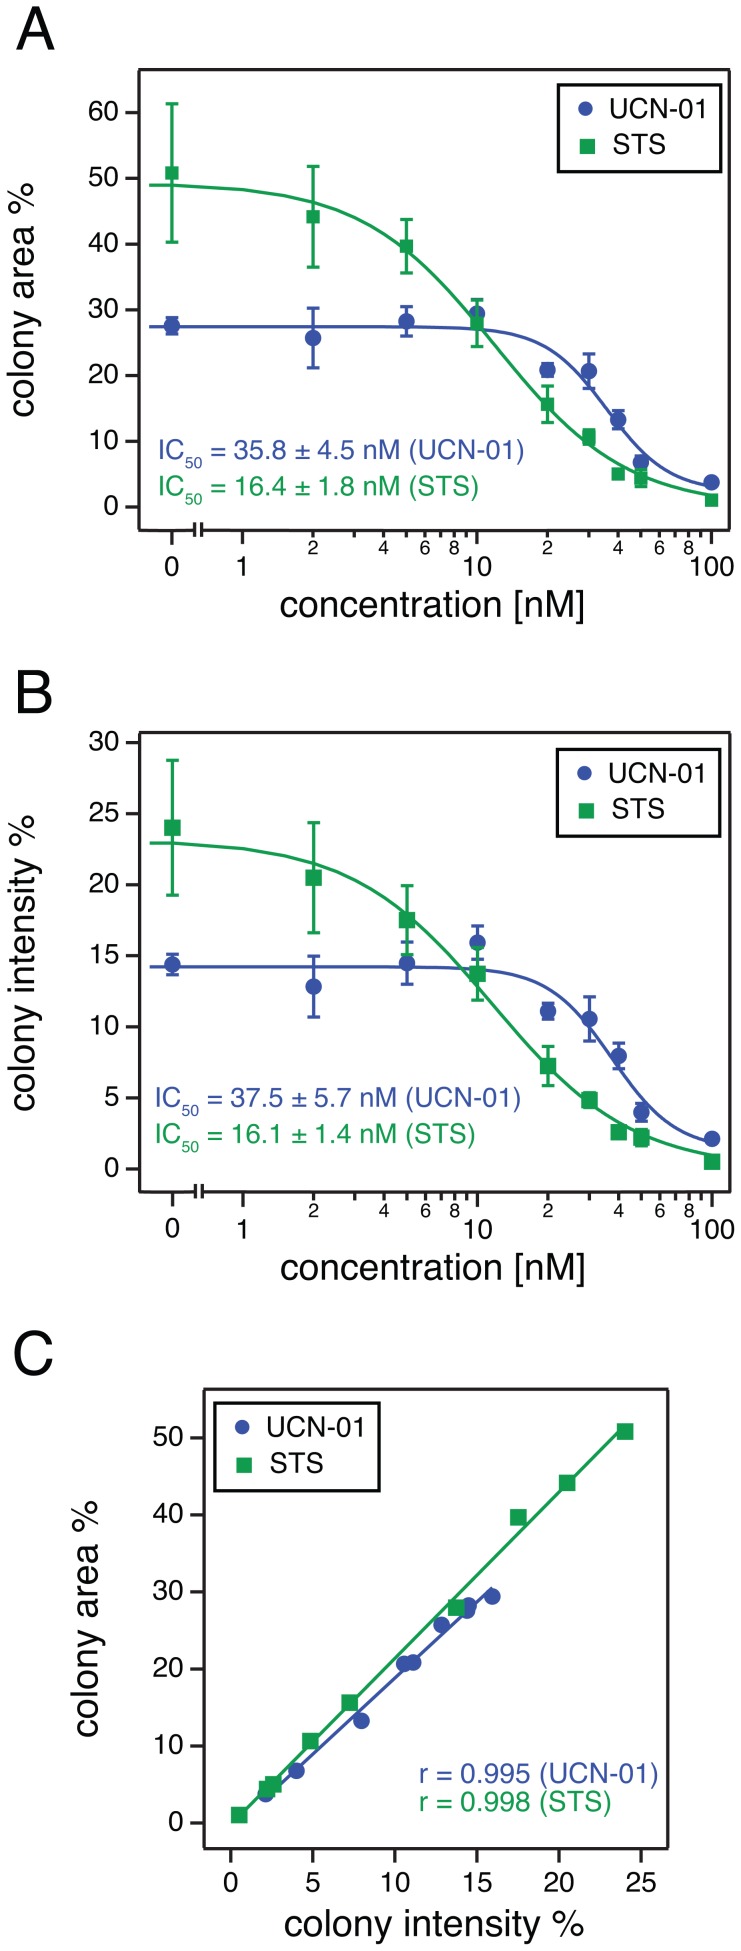
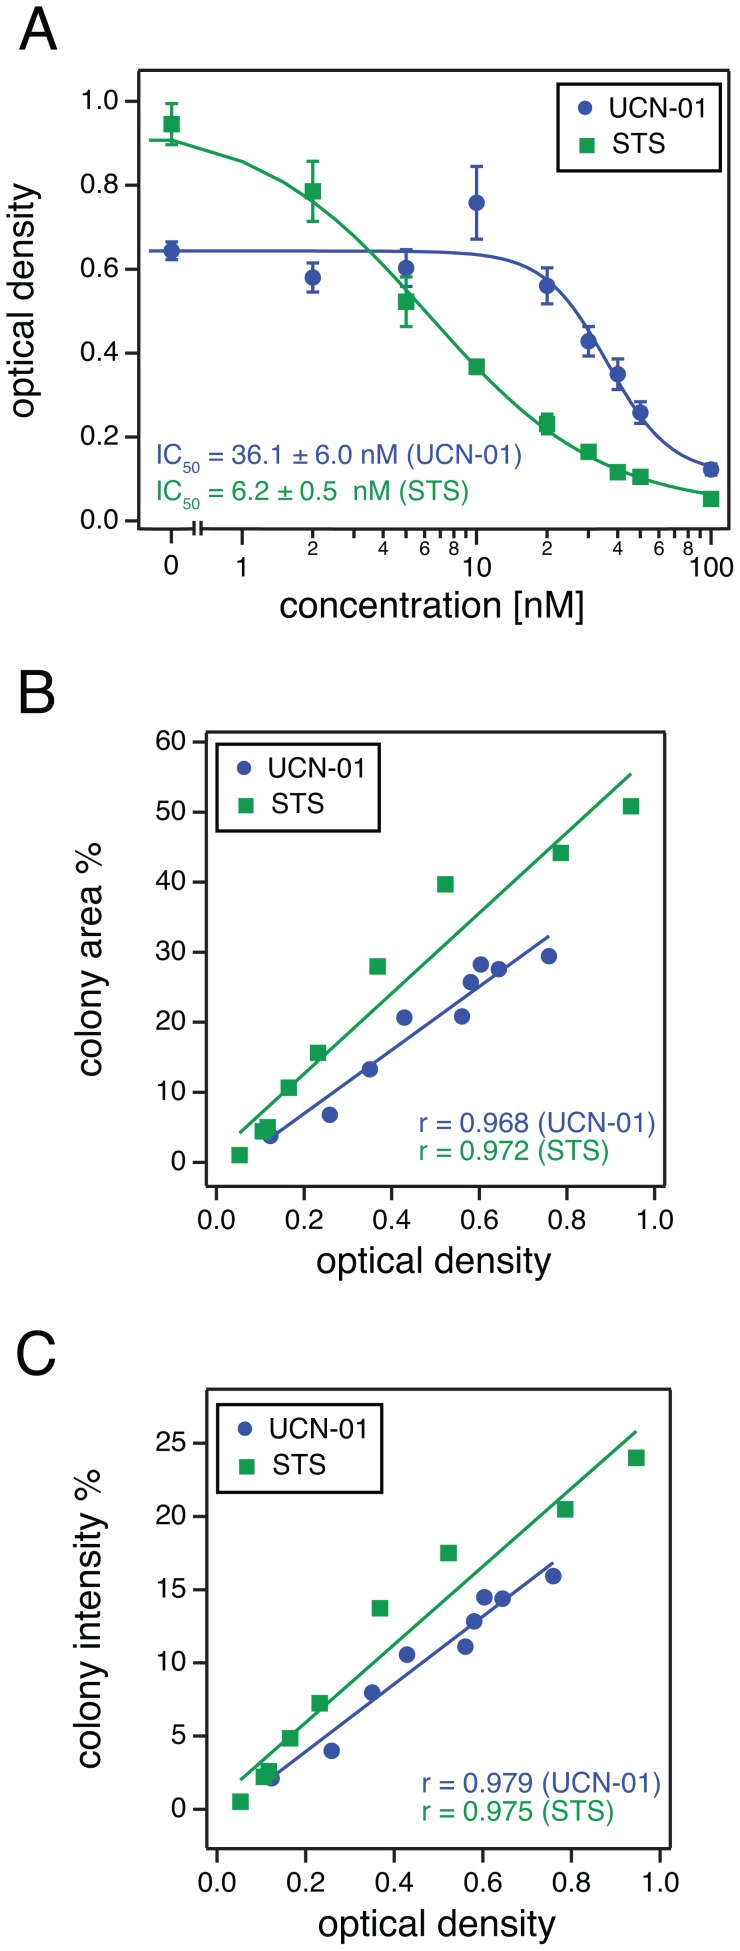
The clonogenic or colony formation assay is a widely used method to study the number and size of cancer cell colonies that remain after irradiation or cytotoxic agent administration and serves as a measure for the anti-proliferative effect of these treatments. Alternatively, this assay is used to quantitate the transforming potential of cancer associated genes and chemical agents. Therefore, there is a need for a simplified and standardized analysis of colony formation assays for both routine laboratory use and for parallelized automated analysis. Here we describe the freely available ImageJ-plugin "ColonyArea", which is optimized for rapid and quantitative analysis of focus formation assays conducted in 6- to 24-well dishes. ColonyArea processes image data of multi-well dishes, by separating, concentrically cropping and background correcting well images individually, before colony formation is quantitated. Instead of counting the number of colonies, ColonyArea determines the percentage of area covered by crystal violet stained cell colonies, also taking the intensity of the staining and therefore cell density into account. We demonstrate that these parameters alone or in combination allow for robust quantification of IC50 values of the cytotoxic effect of two staurosporines, UCN-01 and staurosporine (STS) on human glioblastoma cells (T98G). The relation between the potencies of the two compounds compared very well with that obtained from an absorbance based method to quantify colony growth and to published data. The ColonyArea ImageJ plugin provides a simple and efficient analysis routine to quantitate assay data of one of the most commonly used cellular assays. The bundle is freely available for download as supporting information. We expect that ColonyArea will be of broad utility for cancer biologists, as well as clinical radiation scientists.


Conflict of interest statement

Competing Interests: The authors have declared that no competing interests exist.

Figures

Figure 1
Figure 1. Flow chart of the processing steps in the ColonyArea plugin.
Steps performed by the user are represented by ovals and the grey shapes are those requiring user input. All other shapes represent steps performed by the three macros Colony_area (rounded rectangles), Colony_thresholder (hexagons) and Colony_measurer (stars) that are packaged as one plugin file.
Figure 2
Figure 2. Identification of wells and generation of a well image stack.
(A) Scanned image of a 12-well plate showing different levels of colony formation of drug treated T98G human glioblastoma cells. (B) Same image as in (A) after automatic identification of the wells. The image was converted into an 8-bit greyscale and spaces between wells were removed using a mask. (C) Each well image was then concentrically cropped and added to an image stack to allow for the analysis of each well individually.
Figure 3
Figure 3. Determination of the background threshold.
(A) Two 8-bit greyscale images of wells showing high (left) and lower (right) intensities of cell staining with similar colony density. (B) For each case, the colony area percentage is plotted as a function of the applied intensity threshold. At this point, the colony area percentage corresponds to the percentage of the well area that is selected based on the criterion that each pixel in the area has an intensity value below a given intensity threshold. (C) First and (D) second derivatives of the colony area percentage function shown in (B), which allow identifying the correct intensity threshold. After the correct threshold has been identified, the colony area parameter gives the percentage of the well area that is occupied by cells. In all plots (B–D), the highlighted region represents the intensity range where only cells are selected. Above that intensity threshold the background starts to be included, which identifies this intensity value as the background threshold.
Figure 4
Figure 4. Removal of the background.
(A) 8-bit greyscale images of individual wells showing different levels of colony formation of T98G cells treated with indicated concentrations of staurosporine. (B) Same individual wells after thresholding and background removal by the macro “Colony_thresholder”. Color bar represents the intensity scale displayed in the thresholded wells. Zero intensity (white) corresponds to areas where no cells were identified (background).
Figure 5
Figure 5. Quantification of T98G glioma cell growth after treatment with UCN-01 or staurosporine using the ColonyArea.
Colony formation of T98G human glioma cells was studied after treatment with increasing concentrations of the staurosporine derivative UCN-01 or staurosporine (STS). Image data were analyzed using ColonyArea. Its output parameters were then used to generate dose response curves and determine the half maximal inhibitory concentrations (IC50) of the compounds. (A) Examples of dose response curves using the colony area percentage; IC50 = 35.8±4.5 nM (UCN-01) and IC50 = 16.4±1.8 nM (STS). (B) Examples of dose response curves using the colony intensity percentage; IC50 = 37.5±5.7 nM (UCN-01) and IC50 = 16.1±1.4 nM (STS). Dots correspond to averages and error bars to the standard deviations of measurements from four wells. Curves were fitted using equation (3 ). Additional independent experimental repeats can be found in Figures S1, S2, S3, S4. (C) Correlation analysis of results obtained using the colony area percentage and results obtained using the colony intensity percentage. Regression lines are drawn and the Pearson product moment correlation coefficients ‘r’ is displayed for each data set.
Figure 6
Figure 6. Comparison of the ColonyArea quantification with an absorption method.
The identical wells that were quantified with ColonyArea in Figure 5 were analyzed using a method where the absorption of the crystal violet dye that was washed out from labeled cells is measured. (A) Examples of dose response curves using the optical density from the absorbance measurements of the dye; IC50 = 36.1±6.0 nM (UCN-01) and IC50 = 6.2±0.5 nM (STS). Dots correspond to averages and error bars to the standard deviations of the exact same four wells that were analyzed in Figure 5 . Curves were fitted using equation (3 ). (B) Correlation analysis of data from Figure 5A that were obtained using the colony area percentage and those obtained using the absorbance in (A). (C) Correlation analysis of colony intensity percentage from Figure 5B and the corresponding absorbance data. Regression lines are drawn and the Pearson product moment correlation coefficients ‘r’ is displayed for each set of data. Additional correlative analysis of experimental repeats can be found in Figures S1, S2, S3, S4.

References

    1. Puck TT, Marcus PI (1956) Action of x-rays on mammalian cells. J Exp Med 103: 653–666. - PMC - PubMed
    1. Dahle J, Kakar M, Steen HB, Kaalhus O (2004) Automated counting of mammalian cell colonies by means of a flat bed scanner and image processing. Cytometry A 60: 182–188 10.1002/cyto.a.20038 - DOI - PubMed
    1. Franken NAP, Rodermond HM, Stap J, Haveman J, van Bree C (2006) Clonogenic assay of cells in vitro. Nat Protoc 1: 2315–2319 10.1038/nprot.2006.339 - DOI - PubMed
    1. Cai Z, Chattopadhyay N, Liu WJ, Chan C, Pignol J-P, et al. (2011) Optimized digital counting colonies of clonogenic assays using ImageJ software and customized macros: comparison with manual counting. Int J Radiat Biol 87: 1135–1146 10.3109/09553002.2011.622033 - DOI - PubMed
    1. Booden MA, Ulku AS (2005) Cellular Assays of Oncogene. In: Celis JE, editor. Cell Biology, Four-Volume Set, Third Edition: A Laboratory Handbook. Burlington, MA, USA: Elsevier Academic Press, Vol. 3. pp. 345–352.

Publication types