

Trends in tuberculosis - United States, 2013
Abstract
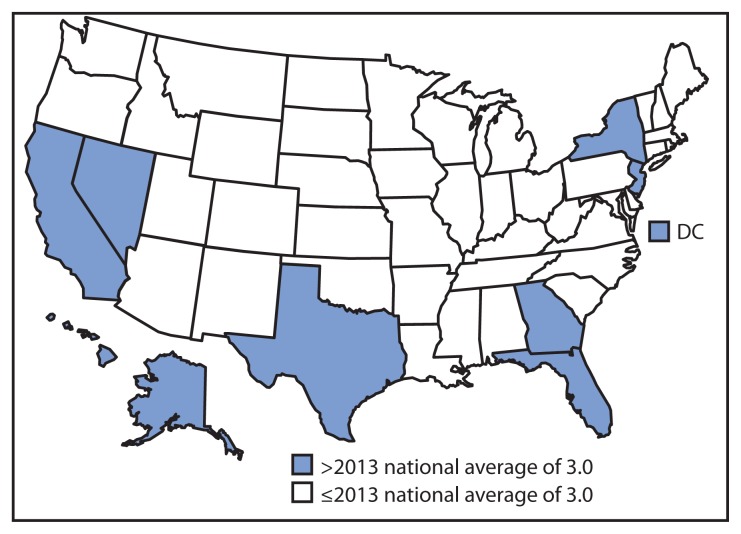
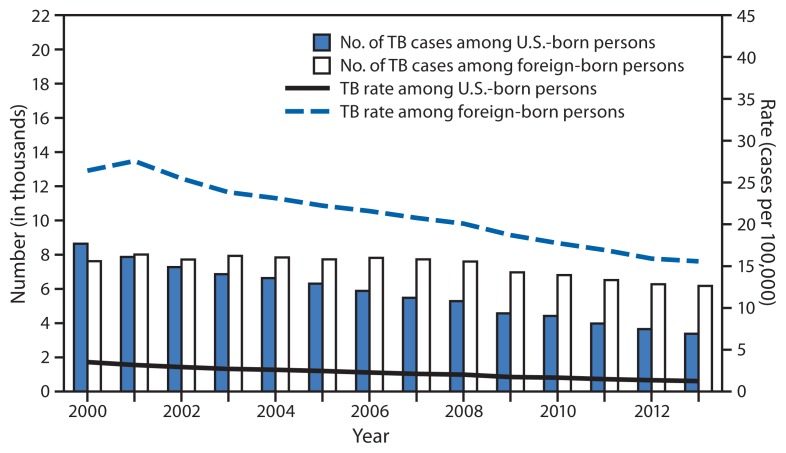
In 2013, a total of 9,588 new tuberculosis (TB) cases were reported in the United States, with an incidence rate of 3.0 cases per 100,000 population, a decrease of 4.2% from 2012. This report summarizes provisional TB surveillance data reported to CDC in 2013. Although case counts and incidence rates continue to decline, certain populations are disproportionately affected. The TB incidence rate among foreign-born persons in 2013 was approximately 13 times greater than the incidence rate among U.S.-born persons, and the proportion of TB cases occurring in foreign-born persons continues to increase, reaching 64.6% in 2013. Racial/ethnic disparities in TB incidence persist, with TB rates among non-Hispanic Asians almost 26 times greater than among non-Hispanic whites. Four states (California, Texas, New York, and Florida), home to approximately one third of the U.S. population, accounted for approximately half the TB cases reported in 2013. The proportion of TB cases occurring in these four states increased from 49.9% in 2012 to 51.3% in 2013. Continued progress toward TB elimination in the United States will require focused TB control efforts among populations and in geographic areas with disproportionate burdens of TB.
Figures
References
-
- CDC. Reported tuberculosis in the United States, 2012. Atlanta, GA: US Department of Health and Human Services, CDC; 2013. Available at http://www.cdc.gov/tb/statistics/reports/2012/pdf/report2012.pdf.
-
- US Census Bureau. Current estimates data. Washington, DC: US Census Bureau; 2014. Available at http://www.census.gov/popest/data/national/totals/2013/index.html.
-
- CDC. A strategic plan for the elimination of tuberculosis in the United States. MMWR. 1989;38(S-3) - PubMed
-
- US Census Bureau. Current estimates data. Washington, DC: US Census Bureau; 2014. Available at http://www.census.gov/popest/data/national/totals/2013/index.html.
-
- US Department of Housing and Urban Development. The 2013 Annual Homeless Assessment Report (AHAR) to Congress. Washington, DC: US Department of Housing and Urban Development; 2013. Available at https://www.onecpd.info/resources/documents/ahar-2013-part1.pdf.
MeSH terms
LinkOut - more resources
Full Text Sources
Medical
