. 2014 May 15;306(10):C931-42.
doi: 10.1152/ajpcell.00021.2013. Epub 2014 Mar 19.

Ischemic factor-induced increases in cerebral microvascular endothelial cell Na/H exchange activity and abundance: evidence for involvement of ERK1/2 MAP kinase

Affiliations

Ischemic factor-induced increases in cerebral microvascular endothelial cell Na/H exchange activity and abundance: evidence for involvement of ERK1/2 MAP kinase

Natalie Yuen et al. Am J Physiol Cell Physiol. .

Abstract

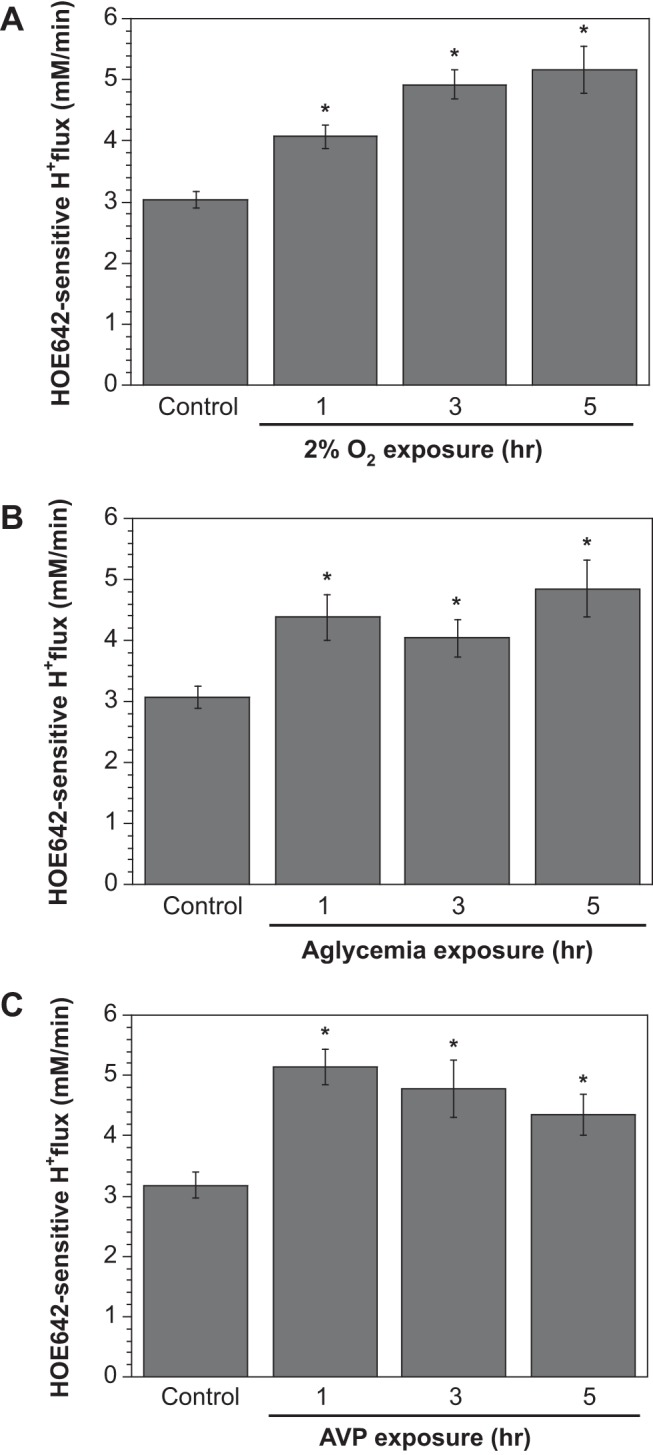
Brain edema forms rapidly in the early hours of ischemic stroke by increased secretion of Na, Cl, and water into the brain across an intact blood-brain barrier (BBB), together with swelling of astrocytes as they take up the ions and water crossing the BBB. Our previous studies provide evidence that luminal BBB Na-K-Cl cotransport (NKCC) and Na/H exchange (NHE) participate in ischemia-induced edema formation. NKCC1 and two NHE isoforms, NHE1 and NHE2, reside predominantly at the luminal BBB membrane. NKCC and NHE activities of cerebral microvascular endothelial cells (CMEC) are rapidly stimulated by the ischemic factors hypoxia, aglycemia, and AVP, and inhibition of NKCC and NHE activities by bumetanide and HOE642, respectively, reduces brain Na uptake and edema in the rat middle cerebral artery occlusion model of stroke. The present study was conducted to further explore BBB NHE responses to ischemia. We examined whether ischemic factor-stimulated NHE activity is sustained over several hours, when the majority of edema forms during stroke. We also examined whether ischemic factors alter NHE1 and/or NHE2 protein abundance. Finally, we conducted initial studies of ERK1/2 MAP kinase involvement in BBB NHE and NKCC responses to ischemic factors. We found that hypoxia, aglycemia, and AVP increase CMEC NHE activity through 5 h and that NHE1, but not NHE2, abundance is increased by 1- to 5-h exposures to these factors. Furthermore, we found that these factors rapidly increase BBB ERK1/2 activity and that ERK1/2 inhibition reduces or abolishes ischemic factor stimulation of NKCC and NHE activities.

Keywords: ERK1/2 MAP kinase; FR180204; HOE642; blood-brain barrier; cerebral edema; stroke.


Figures

Fig. 1.
Fig. 1.
Effects of 1–5 h of exposure to hypoxia, aglycemia, and AVP on cerebral microvascular endothelial cell (CMEC) Na/H exchange (NHE) activity. CMEC monolayers were exposed for 1, 3, or 5 h to 19% O2 (normoxic control) or 2% O2 in HEPES-DMEM (A), aglycemic normoxic media (glucose- and pyruvate-free HEPES-buffered DMEM at 19% O2; B), or normoxic HEPES-DMEM containing 100 nM AVP (C). Values are means ± SE; n = 13, 8, 6, and 6 for control, 1, 3, and 5 h, respectively, in A; 12, 7, 12, and 5 for control, 1, 3, and 5 h, respectively, in B; and 11, 6, 4, and 12 for control, 1, 3, and 5 h, respectively, in C. *P < 0.05 vs. control (by ANOVA with Dunnett's multiple-comparison post hoc test).
Fig. 2.
Fig. 2.
Effects of 1- to 5-h hypoxia exposures on NHE1 and NHE2 abundance in CMEC. CMEC monolayers were exposed to normoxic control conditions (19% O2) or 2% O2 (A and B) or 7% O2 (C and D) for 1, 3, or 5 h. Incubation medium in all cases was HEPES-buffered DMEM. Cell lysates were prepared and subjected to Western blot analysis using primary antibodies that recognize NHE1 protein (mouse monoclonal antibody) or NHE2 protein (rabbit polyclonal antibody). Top: representative Western blots. Bottom: abundance of NHE1 and NHE2. Values (means ± SE) are relative to internal normoxic control for each condition; n = 11, 10, 10, and 9 for control, 1, 3, and 5 h, respectively, in A; 8 for control, 1, 3, and 5 h in B; 7 for control and 5 for 1, 3, and 5 h in C; and 10, 6, 8, and 7 for control, 1, 3, and 5 h, respectively, in D. *P < 0.05 vs. control (by t-test).
Fig. 3.
Fig. 3.
Effects of 1- to 5-h aglycemia and AVP exposures on NHE1 and NHE2 abundance in CMEC. CMEC monolayers were exposed to control normoxic medium (HEPES-DMEM) or aglycemic normoxic medium (glucose- and pyruvate-free HEPES-DMEM at 19% O2; A and B) or AVP (100 nM in normoxic HEPES-DMEM; C and D) for 1, 3, or 5 h, and cell lysates were prepared and subjected to Western blot analysis for NHE1 and NHE2 as described in Fig. 2 legend. Top: representative Western blots. Bottom: abundance of NHE1 and NHE2. Values (means ± SE) are relative to internal normoxic control for each condition; n = 11, 8, 11, and 9 for control, 1, 3, and 5 h, respectively, in A; 12, 10, 12, and 12 for control, 1, 3, and 5 h, respectively, in B; 11 for control, 1, 3, and 5 h in C; and 12, 11, 10, and 10 for control, 1, 3, and 5 h, respectively, in D. *P < 0.05 vs. control (by t-test).
Fig. 4.
Fig. 4.
Hypoxia, aglycemia, and AVP activation of ERK1/2 in CMEC. CMEC monolayers were exposed to normoxic control or hypoxia (19% and 2% O2, respectively, in HEPES-DMEM; A), aglycemic normoxic media or aglycemic hypoxic media (glucose- and pyruvate-free HEPES-buffered DMEM at 19% and 2% O2, respectively; B), or AVP (100 nM in normoxic HEPES-DMEM; C) for 5, 30, 60, or 120 min. Cell lysates were prepared and subjected to Western blot analysis using antibodies that recognize only phosphorylated (activated) ERK (p-ERK) or both p-ERK and nonphosphorylated (total) ERK protein. Top: representative Western blots. Doublet bands shown for both ERK and p-ERK are ∼42 and 44 kDa. Bottom: abundance of p-ERK. Values (means ± SE) are relative to internal normoxic control for each condition; n = 6, 9, 8, 7, and 6 for 7% O2, 2% O2, aglycemia, O2-glucose deprivation (OGD), and AVP, respectively, at all time points. *P < 0.05 vs. control (by t-test).
Fig. 5.
Fig. 5.
Effects of FR180204 on hypoxia-, aglycemia- and AVP-induced stimulation of CMEC NHE activity. CMEC monolayers were pretreated for 30 min with FR180204 (30 μM) or vehicle in normoxic HEPES-DMEM and exposed for 30 min to normoxic control (19% O2) or hypoxia (7% O2) in HEPES-DMEM (A), aglycemia (normoxic glucose- and pyruvate-free HEPES-DMEM; B), or AVP (100 nM in normoxic HEPES-DMEM; C) also containing FR180204 (30 μM) or vehicle, and CMEC NHE activity was assessed. Pretreatment conditions were maintained throughout the assay. Values are means ± SE; n = 5, 6, and 4 for control, hypoxia, and hypoxia + FR180204, respectively, in A and B and 4, 5, and 4 for control, hypoxia, and hypoxia + FR180204, respectively, in C. *P < 0.05 vs. vehicle (by ANOVA with Dunnett's multiple-comparison post hoc test).
Fig. 6.
Fig. 6.
Effects of FR180204 on hypoxia- and aglycemia-induced stimulation of CMEC Na-K-Cl cotransporter (NKCC) activity. CMEC monolayers were pretreated for 30 min with FR180204 (30 μM) or vehicle and then exposed for 30 min to normoxic control (19% O2) or hypoxia (7% O2; A) or aglycemia (B) in media also containing FR180204 (30 μM) or vehicle. CMEC NKCC activity was assessed as ouabain-insensitive, bumetanide-sensitive K+ influx. Pretreatment conditions were maintained throughout the assay. Values are means ± SE for 6 and 5 separate experiments for A and B, respectively. #P < 0.05 vs. control (A and B); *P < 0.05 vs. 7% O2 in vehicle (A) or aglycemia in vehicle (B) (by ANOVA with Tukey's post hoc test).
Fig. 7.
Fig. 7.
Immunofluorescence detection of ERK and p-ERK in the blood-brain barrier (BBB) in situ. Perfusion-fixed normoxic (A and B) and ischemic (C and D) rat brains were cryosectioned (5 μm) and mounted on glass slides, and immunohistochemistry was performed with antibodies for ERK, p-ERK, and either the astrocyte marker glial fibrillary acidic protein (GFAP) or the BBB endothelial cell-specific antibody SMI-71. ERK and p-ERK (green) are detected in BBB endothelial cells and perivascular astrocytes. GFAP (red) appears in perivascular astrocytic end feet surrounding the BBB endothelial cells, and SMI-71 staining (red) appears in BBB endothelial cells. Merged images show ERK and p-ERK in BBB endothelial cells (green in A and C, orange in B and D), as well as astrocytes (orange in A and C). For A and B and for C and D, negative control images (Neg Control Merged) were generated using secondary antibodies only. Scale bars, 10 μm.

Similar articles

Cited by

References

    1. Betz AL. Alterations in cerebral endothelial cell function in ischemia. Adv Neurol 71: 301–313, 1996 - PubMed
    1. Bourke RS, Kimelberg HK, Nelson LR, Barron KD, Auen EL, Popp AJ, Waldman JB. Biology of glial swelling in experimental brain edema. Adv Neurol 28: 99–109, 1980 - PubMed
    1. Boyarsky G, Ganz MB, Sterzel RB, Boron WF. pH regulation in single glomerula mesangial cells. I. Acid extrusion in the absence and presence of HCO3−. Am J Physiol Cell Physiol 255: C844–C856, 1988 - PubMed
    1. Boyarsky G, Ransom B, Schlue WR, Davis MB, Boron WF. Intracellular pH regulation in single cultured astrocytes from rat forebrain. Glia 8: 241–248, 1993 - PubMed
    1. Brillault J, Lam TI, Rutkowsky JM, Foroutan S, O'Donnell ME. Hypoxia effects on cell volume and ion uptake of cerebral microvascular endothelial cells. Am J Physiol Cell Physiol 294: C88–C96, 2008 - PubMed

Publication types

MeSH terms

LinkOut - more resources