. 2014 Jul;63(7):2415-31.
doi: 10.2337/db13-0883. Epub 2014 Mar 19.

Erythropoietin signaling: a novel regulator of white adipose tissue inflammation during diet-induced obesity

Affiliations

Erythropoietin signaling: a novel regulator of white adipose tissue inflammation during diet-induced obesity

Mawadda Alnaeeli et al. Diabetes. 2014 Jul.

Abstract

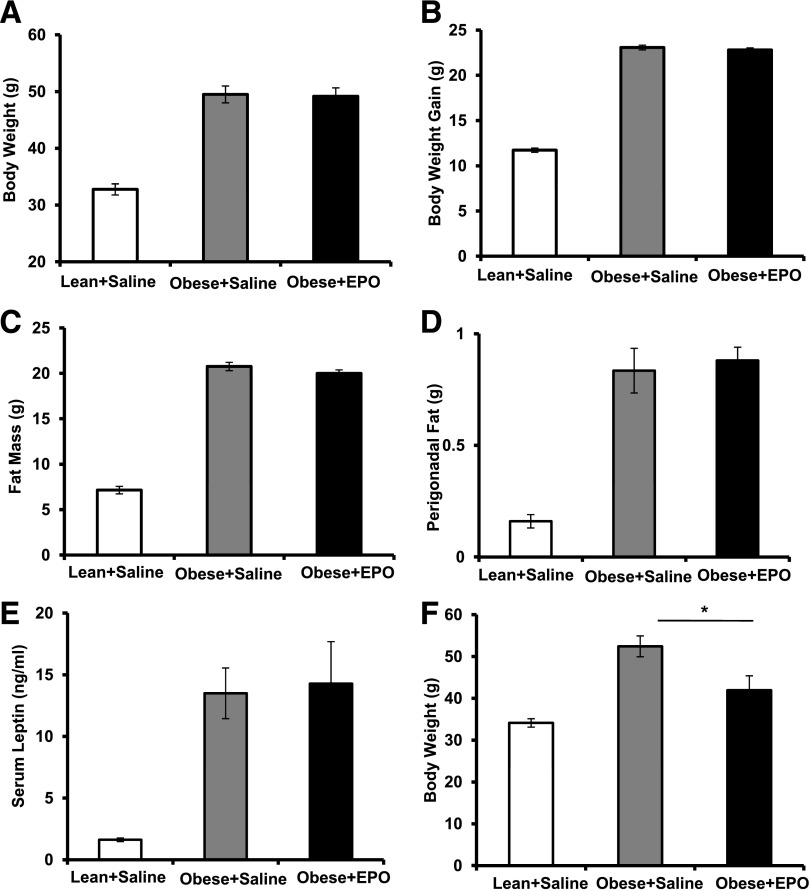
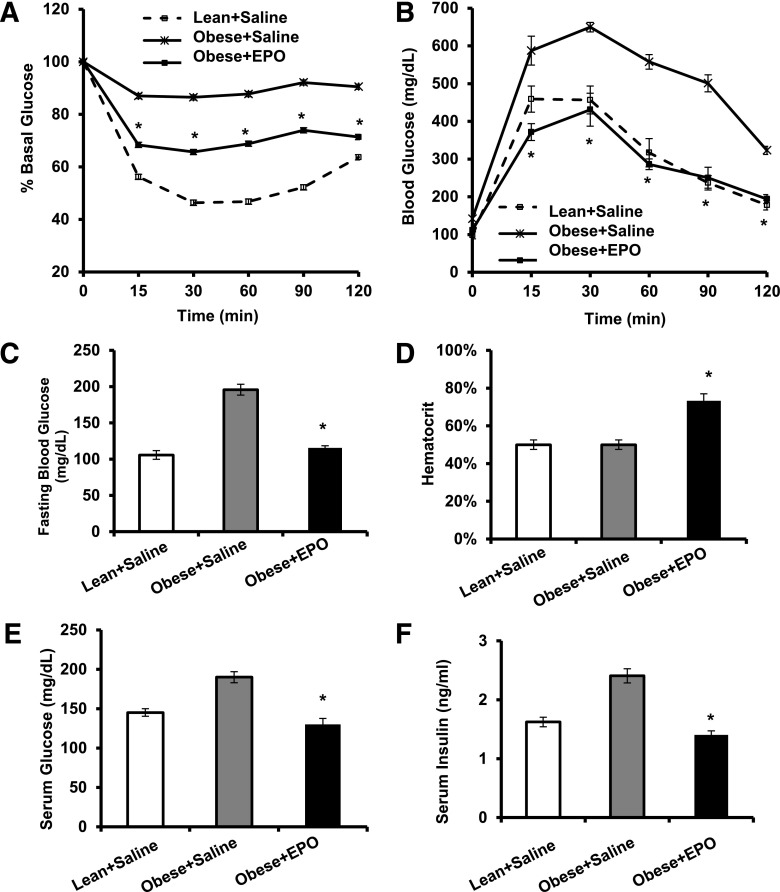
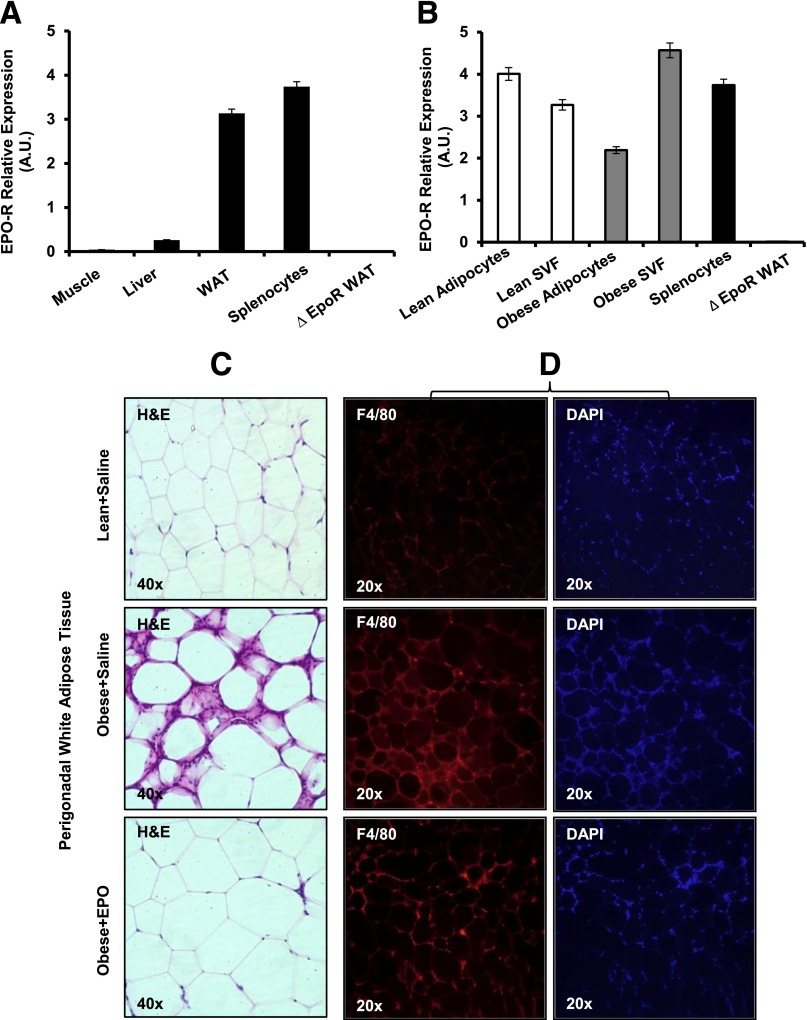
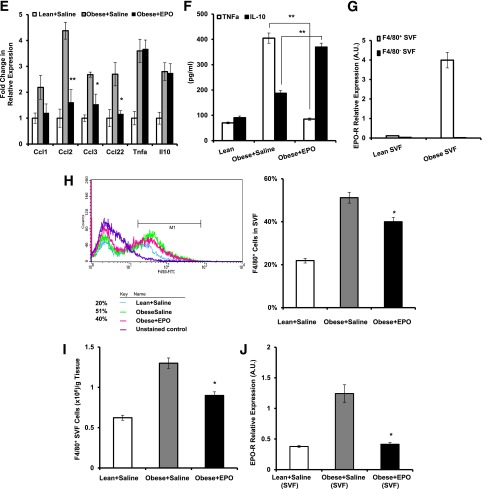
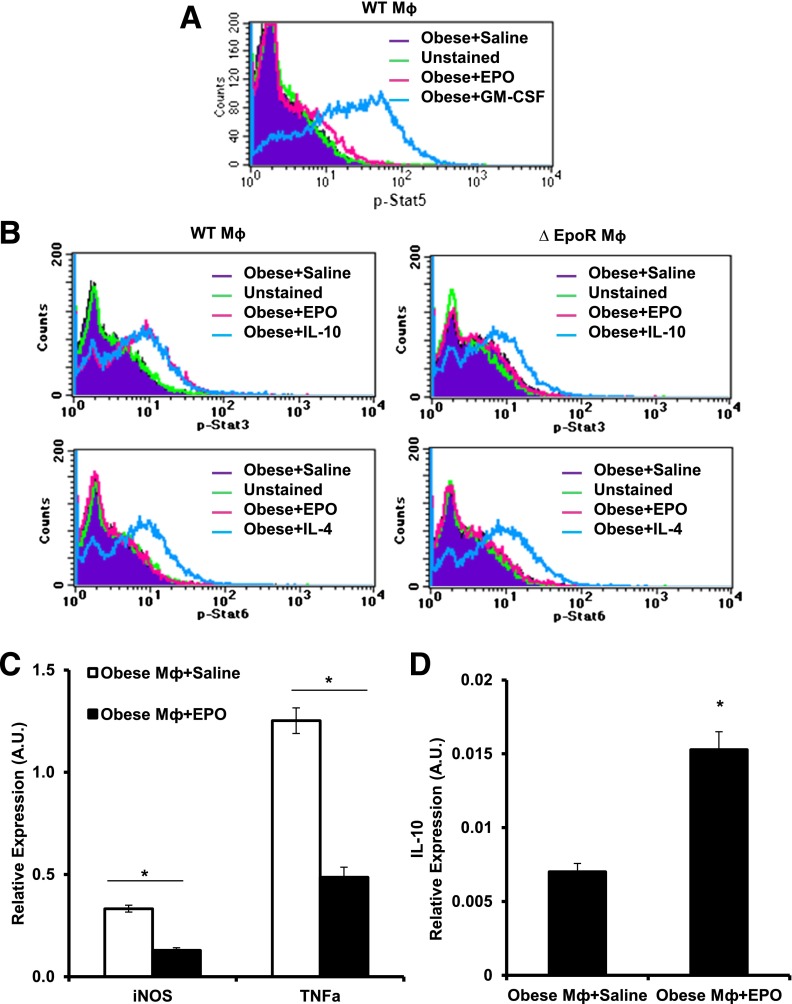
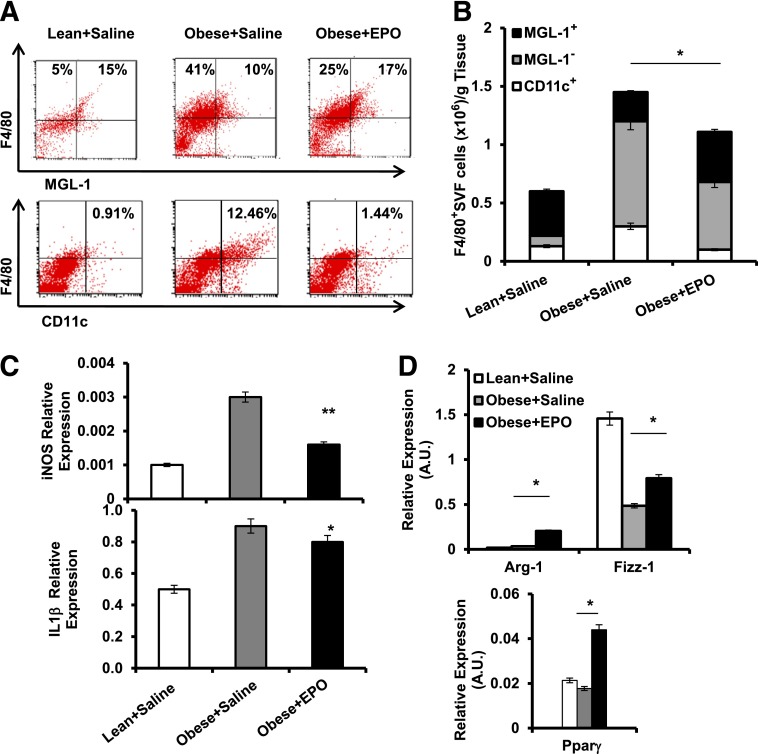
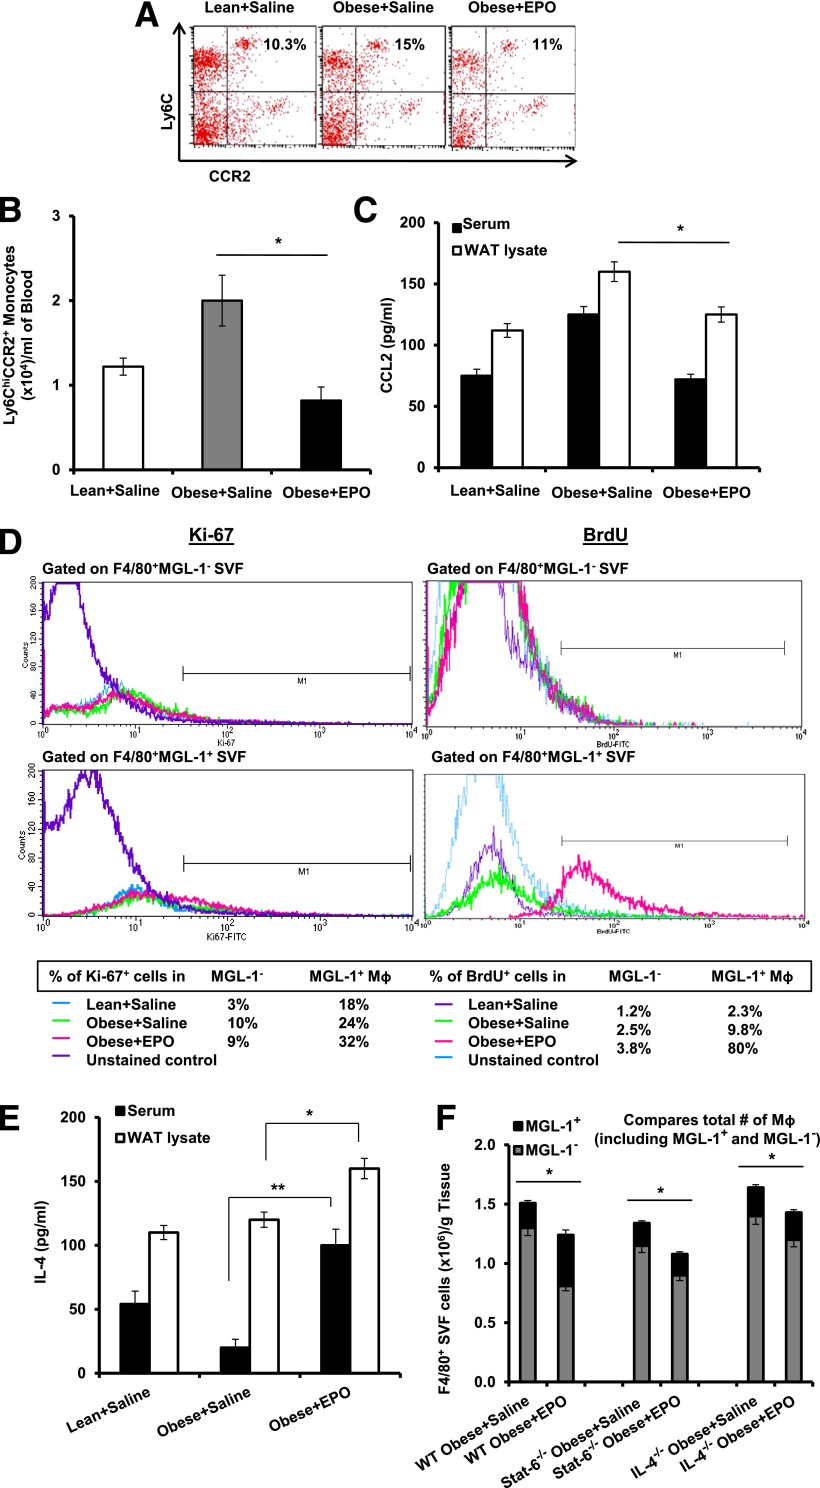
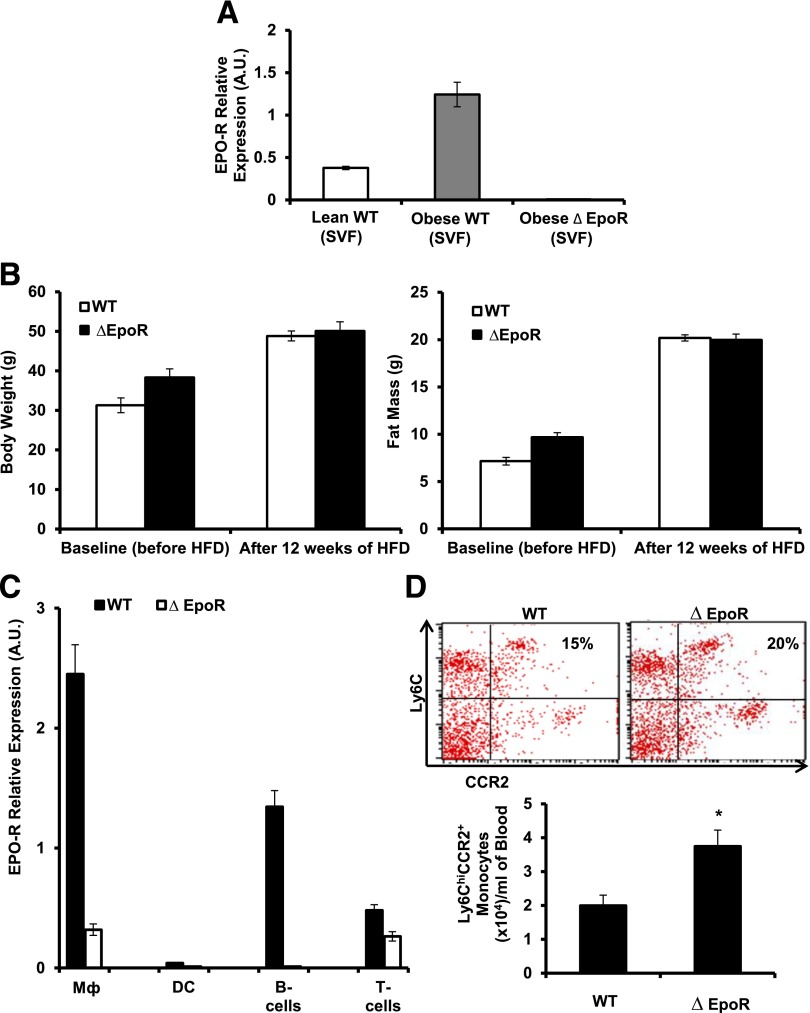
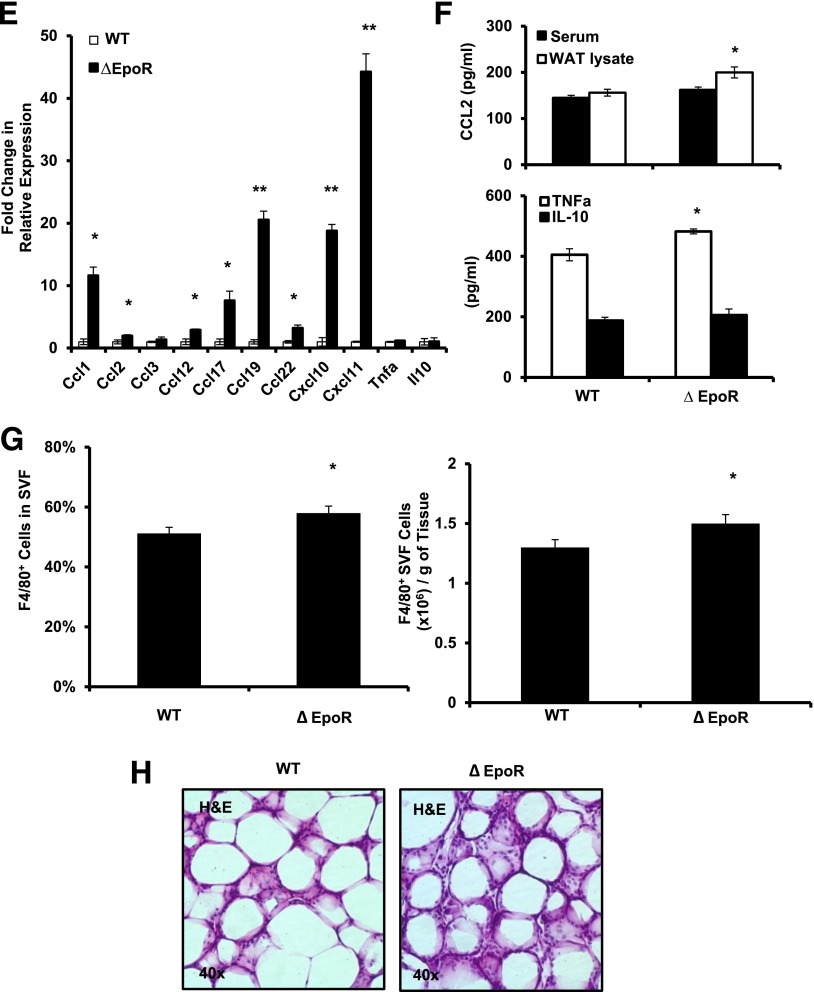
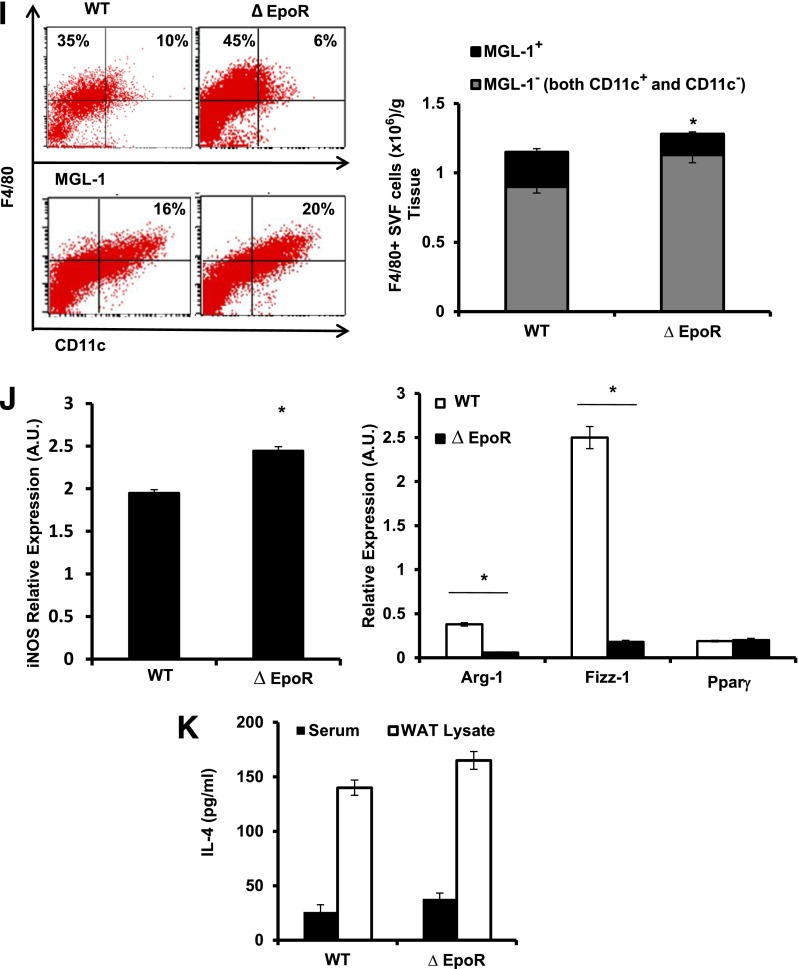
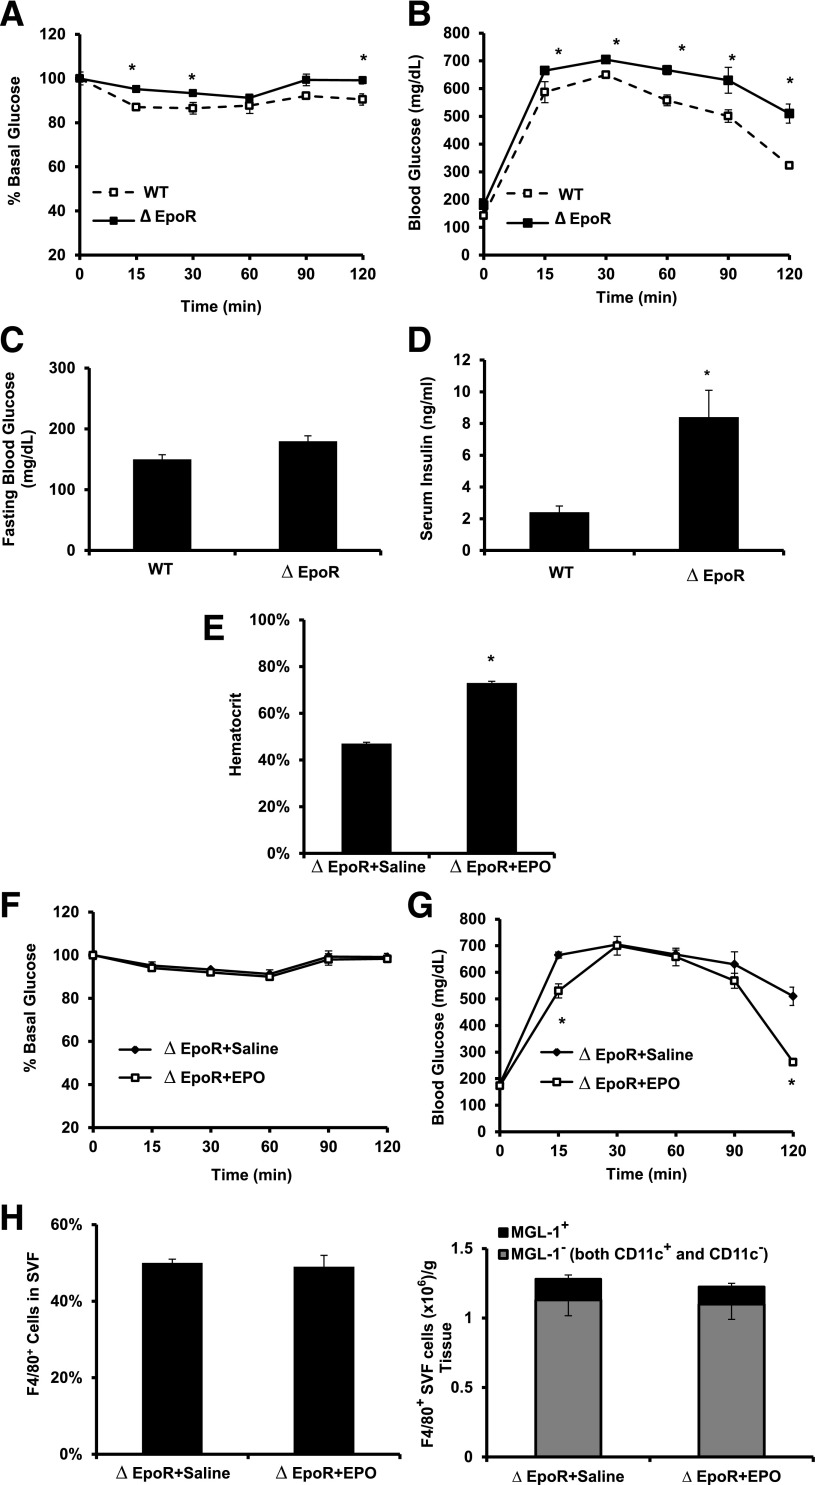
Obesity-induced white adipose tissue (WAT) inflammation and insulin resistance are associated with macrophage (Mф) infiltration and phenotypic shift from "anti-inflammatory" M2-like to predominantly "proinflammatory" M1-like cells. Erythropoietin (EPO), a glycoprotein hormone indispensable for erythropoiesis, has biological activities that extend to nonerythroid tissues, including antiapoptotic and anti-inflammatory effects. Using comprehensive in vivo and in vitro analyses in mice, EPO treatment inhibited WAT inflammation, normalized insulin sensitivity, and reduced glucose intolerance. We investigated EPO receptor (EPO-R) expression in WAT and characterized the role of its signaling during obesity-induced inflammation. Remarkably, and prior to any detectable changes in body weight or composition, EPO treatment reduced M1-like Mф and increased M2-like Mф in WAT, while decreasing inflammatory monocytes. These anti-inflammatory effects were found to be driven, at least in part, by direct EPO-R response in Mф via Stat3 activation, where EPO effects on M2 but not M1 Mф required interleukin-4 receptor/Stat6. Using obese ∆EpoR mice with EPO-R restricted to erythroid cells, we demonstrated an anti-inflammatory role for endogenous EPO. Collectively, our findings identify EPO-R signaling as a novel regulator of WAT inflammation, extending its nonerythroid activity to encompass effects on both Mф infiltration and subset composition in WAT.


Figures

Figure 1
Figure 1
A 2-week EPO treatment regimen does not affect body weight or fat mass. WT C57BL/6 male mice were fed an HFD for 12 weeks and treated with or without EPO (1,000 units/kg) for the final 2 weeks of the study. Lean mice + saline and obese mice + saline were used as negative and vehicle controls, respectively. Final body weight (A), body weight gain (B), fat mass (C), perigonadal fat mass (D), and serum leptin (E) were measured for all three groups at the end of week 12. F: WT C57BL/6 mice with obesity induced by HFD feeding for 13 weeks were treated with or without EPO (1,000 units/kg) every 48 h during the final 3 weeks of the study. Lean mice + saline were used as negative controls. Results are shown as mean ± SEM for n = 8 mice per group, representative of three independent experiments with similar results. *P < 0.05.
Figure 2
Figure 2
EPO treatment attenuates insulin resistance and glucose intolerance during DIO. WT C57BL/6 mice with obesity induced by HFD feeding for 12 weeks were treated with or without EPO (1,000 units/kg) every 48 h during the final 2 weeks of the study. Lean mice + saline were used as negative controls. A: For ITT, glucose levels were measured after intraperitoneal injection of 1 unit/kg insulin. B: For GTT, glucose levels were measured after intraperitoneal injection of 1 g/kg glucose. Fasting glucose levels (C), percentage hematocrit (D), serum glucose levels (E), and serum insulin levels (F) were measured. All measurements were performed at the end of week 12. Euglycemic–hyperinsulinemic clamps were performed in DIO mice fasted overnight after 2 weeks of EPO treatment (n = 5–8/group). G: GIR. H: Whole-body glucose fluxes, GIR, endogenous glucose production, and glucose disposal. I and J: Tissue 2-deoxyglucose update measured during clamp. Clamp plasma glucose levels were 209 + 39 and 157 + 13 mg/dL in saline- and EPO-treated mice, respectively. Clamp plasma insulin levels were 6.6 + 2.3 ng/mL in saline-treated mice and 5.8 + 0.8 ng/mL EPO-treated mice. Results are shown as mean ± SEM for n = 8 mice per group, representative of three independent experiments with similar results. *P < 0.05. BAT, brown adipose tissue; EGP, endogenous glucose production; Epi, epididymal; Ing, inguinal; Rd, glucose disposal.
Figure 2
Figure 2
EPO treatment attenuates insulin resistance and glucose intolerance during DIO. WT C57BL/6 mice with obesity induced by HFD feeding for 12 weeks were treated with or without EPO (1,000 units/kg) every 48 h during the final 2 weeks of the study. Lean mice + saline were used as negative controls. A: For ITT, glucose levels were measured after intraperitoneal injection of 1 unit/kg insulin. B: For GTT, glucose levels were measured after intraperitoneal injection of 1 g/kg glucose. Fasting glucose levels (C), percentage hematocrit (D), serum glucose levels (E), and serum insulin levels (F) were measured. All measurements were performed at the end of week 12. Euglycemic–hyperinsulinemic clamps were performed in DIO mice fasted overnight after 2 weeks of EPO treatment (n = 5–8/group). G: GIR. H: Whole-body glucose fluxes, GIR, endogenous glucose production, and glucose disposal. I and J: Tissue 2-deoxyglucose update measured during clamp. Clamp plasma glucose levels were 209 + 39 and 157 + 13 mg/dL in saline- and EPO-treated mice, respectively. Clamp plasma insulin levels were 6.6 + 2.3 ng/mL in saline-treated mice and 5.8 + 0.8 ng/mL EPO-treated mice. Results are shown as mean ± SEM for n = 8 mice per group, representative of three independent experiments with similar results. *P < 0.05. BAT, brown adipose tissue; EGP, endogenous glucose production; Epi, epididymal; Ing, inguinal; Rd, glucose disposal.
Figure 3
Figure 3
EPO-R expression profiles and the effects of EPO treatment on WAT inflammation and Mф infiltration. A: EPO-R expression in skeletal muscle, liver, and WAT of WT mice on normal chow (lean) was assessed using splenocytes and ∆EpoR WAT as positive and negative controls, respectively. B: EPO-R expression in adipocytes and SVF was assessed in lean versus obese mice. Representative H&E-stained sections from perigonadal adipose tissue (C) and immunofluorescent staining of perigonadal WAT sections for Mф (F4/80-red) and nuclei (DAPI-blue) (D) are shown; similar results are seen in 12 independent samples. E: Expression of inflammatory cytokine and chemokine genes in WAT from perigonadal fat was analyzed by qRT-PCR; expression levels are normalized to β-actin, and fold change in expression are relative to negative control lean + saline. F: Serum TNF-α and IL-10 levels were determined for each group (n = 5 mice per group). G: Comparison of EPO-R levels in Mф (F4/80+) and non-Mф (F4/80) fractions, sorted by FACS, from stromal vascular cells of lean and obese WAT. Flow cytometry analysis of F4/80 expression in SVF cells of perigonadal WAT depicting total Mф percentage (H) and number per gram of perigonadal WAT (I) are shown. J: EPO-R expression levels in SVF of lean and obese mice treated with and without EPO were determined by qRT-PCR. Expression levels were normalized to β-actin. Data are mean ± SEM for n = 5 mice per group, representative of three independent experiments with similar results. *P < 0.05; **P < 0.01.
Figure 3
Figure 3
EPO-R expression profiles and the effects of EPO treatment on WAT inflammation and Mф infiltration. A: EPO-R expression in skeletal muscle, liver, and WAT of WT mice on normal chow (lean) was assessed using splenocytes and ∆EpoR WAT as positive and negative controls, respectively. B: EPO-R expression in adipocytes and SVF was assessed in lean versus obese mice. Representative H&E-stained sections from perigonadal adipose tissue (C) and immunofluorescent staining of perigonadal WAT sections for Mф (F4/80-red) and nuclei (DAPI-blue) (D) are shown; similar results are seen in 12 independent samples. E: Expression of inflammatory cytokine and chemokine genes in WAT from perigonadal fat was analyzed by qRT-PCR; expression levels are normalized to β-actin, and fold change in expression are relative to negative control lean + saline. F: Serum TNF-α and IL-10 levels were determined for each group (n = 5 mice per group). G: Comparison of EPO-R levels in Mф (F4/80+) and non-Mф (F4/80) fractions, sorted by FACS, from stromal vascular cells of lean and obese WAT. Flow cytometry analysis of F4/80 expression in SVF cells of perigonadal WAT depicting total Mф percentage (H) and number per gram of perigonadal WAT (I) are shown. J: EPO-R expression levels in SVF of lean and obese mice treated with and without EPO were determined by qRT-PCR. Expression levels were normalized to β-actin. Data are mean ± SEM for n = 5 mice per group, representative of three independent experiments with similar results. *P < 0.05; **P < 0.01.
Figure 4
Figure 4
EPO/EPO-R signaling induces Stat3 phosphorylation in Mф and inhibits their inflammatory response in vitro. WAT Mф, purified by FACS from obese mice SVF (after 12 weeks of HFD feeding), were cultured with saline or EPO (5 units/mL) for phosphoflow analysis. Histogram plots of Mф phosphoflow results for p-Stat5a/b (A) and p-Stat3 and p-Stat6 in WT (left two panels) and ∆EpoR (right two panels) (B). In some experiments, Mф sorted from SVF of obese WT mice were cultured with EPO (5 units/mL) for 24 h, after which their TNF-α and iNOS (C) and IL-10 (D) mRNA levels were quantified. Data represent observations from three independent experiments with similar results plotted as mean ± SEM for n = 4 per group. *P < 0.05.
Figure 5
Figure 5
EPO treatment regulates Mф subtype composition in WAT. SVF cells from perigonadal fat were used for flow cytometry and analyses. Dot plots depict flow cytometry analysis of MGL-1+, MGL-1, and CD11c+ Mф subsets (A), and their numbers per gram of WAT are shown (B). Expression levels of iNOS and IL-1β (C) and Arg-1, Fizz-1, and Ppar-γ (D) relative to β-actin were assessed. Results are shown as mean ± SEM for n = 5 mice per group, representative of three independent experiments with similar results. *P < 0.05; **P < 0.01.
Figure 6
Figure 6
EPO treatment decreases circulating inflammatory monocytes and promotes WAT M2-like Mф expansion. Dot plots for flow cytometry analysis of circulating blood inflammatory monocytes Ly6ChiCCR2+ (A) and their numbers per milliliter of blood (B) are shown, as well as CCL2 levels in serum and perigonadal WAT lysates (C). D: Flow cytometry results depict the percentage of proliferating MGL-1 versus MGL-1+ Mф in perigonadal SVF, based on Ki-67 staining (left) and BrdU uptake (right). E: Serum and WAT IL-4 levels are shown. F: Numbers of total Mф (bar) and MGL-1+ (top, black) and MGL-1 (bottom, gray) Mф subsets per gram of perigonadal WAT from WT, Stat6−/−, and IL-4−/− mice are shown. Results are presented as mean ± SEM for n = 4–6 mice per group, representative of two or three independent experiments with similar results. *P < 0.05; **P < 0.01.
Figure 7
Figure 7
Endogenous EPO/EPO-R signaling regulates WAT Mф infiltration and subtype shift. WT C57BL/6 and age-matched ∆EpoR male mice with obesity induced by HFD feeding for 12 weeks were used. A: EPO-R expression levels were determined in SVF relative to β-actin. Shown are body weight and fat mass before and after DIO (B) and EPO-R expression analysis by qRT-PCR in different immune cell subsets (C) from spleens in which Mф were FACS-purified based on F4/80 expression and dendritic cells, B-cells, and T-cells that were purified by magnetic activated cell sorting through positive selection of CD11c+ (dendritic cells), CD19+ (B-cells), and CD3+ (T-cells) cells. Shown are percentage and numbers of circulating blood inflammatory monocytes (D); cytokine and chemokine gene expression profile of perigonadal SVF (E); protein levels of TNF-α, IL-10, and CCL2 (F); percentage and numbers of total Mф (G); and representative H&E-stained histology sections of perigonadal WAT (H). MGL-1+, MGL-1, and CD11c+ Mф subset percentages (dot plots) and numbers per gram of perigonadal fat tissue (I), gene expression determined relative to β-actin (J), and serum and WAT IL-4 levels (K) are shown. Results are mean ± SEM for n = 5 mice per group, representative of three independent experiments with similar results. *P < 0.05; **P < 0.01 WT vs. ∆EpoR. DC, dendritic cells.
Figure 7
Figure 7
Endogenous EPO/EPO-R signaling regulates WAT Mф infiltration and subtype shift. WT C57BL/6 and age-matched ∆EpoR male mice with obesity induced by HFD feeding for 12 weeks were used. A: EPO-R expression levels were determined in SVF relative to β-actin. Shown are body weight and fat mass before and after DIO (B) and EPO-R expression analysis by qRT-PCR in different immune cell subsets (C) from spleens in which Mф were FACS-purified based on F4/80 expression and dendritic cells, B-cells, and T-cells that were purified by magnetic activated cell sorting through positive selection of CD11c+ (dendritic cells), CD19+ (B-cells), and CD3+ (T-cells) cells. Shown are percentage and numbers of circulating blood inflammatory monocytes (D); cytokine and chemokine gene expression profile of perigonadal SVF (E); protein levels of TNF-α, IL-10, and CCL2 (F); percentage and numbers of total Mф (G); and representative H&E-stained histology sections of perigonadal WAT (H). MGL-1+, MGL-1, and CD11c+ Mф subset percentages (dot plots) and numbers per gram of perigonadal fat tissue (I), gene expression determined relative to β-actin (J), and serum and WAT IL-4 levels (K) are shown. Results are mean ± SEM for n = 5 mice per group, representative of three independent experiments with similar results. *P < 0.05; **P < 0.01 WT vs. ∆EpoR. DC, dendritic cells.
Figure 8
Figure 8
Endogenous EPO/EPO-R signaling and glucose metabolism during DIO. A: For ITT, glucose levels were measured after intraperitoneal injection of 1 unit/kg insulin. B: For GTT, glucose levels were measured after intraperitoneal injection of 1 g/kg glucose. Fasting glucose (C) and serum insulin (D) levels were determined. ∆EpoR mice with DIO, induced by 12 weeks of HFD feeding, were injected subcutaneously with saline or EPO (1,000 units/kg) every 48 h for the final 2 weeks of HFD feeding, and hematocrit (E), ITT (F), GTT (G), and flow cytometry analysis of perigonadal fat SVF cells (H) were determined. All measurements were performed at the end of week 12. Data presented as mean ± SEM for n = 8 mice per group, representative of three independent experiments with similar results. *P < 0.05.

Comment in

References

    1. Olefsky JM, Glass CK. Macrophages, inflammation, and insulin resistance. Annu Rev Physiol 2010;72:219–246 - PubMed
    1. Zeyda M, Stulnig TM. Obesity, inflammation, and insulin resistance—a mini-review. Gerontology 2009;55:379–386 - PubMed
    1. de Luca C, Olefsky JM. Inflammation and insulin resistance. FEBS Lett 2008;582:97–105 - PMC - PubMed
    1. Lumeng CN, Saltiel AR. Inflammatory links between obesity and metabolic disease. J Clin Invest 2011;121:2111–2117 - PMC - PubMed
    1. Lumeng CN, Bodzin JL, Saltiel AR. Obesity induces a phenotypic switch in adipose tissue macrophage polarization. J Clin Invest 2007;117:175–184 - PMC - PubMed

Publication types