. 2014 Mar 19;34(12):4239-50.
doi: 10.1523/JNEUROSCI.4458-13.2014.

Opioid hedonic hotspot in nucleus accumbens shell: mu, delta, and kappa maps for enhancement of sweetness "liking" and "wanting"

Affiliations

Opioid hedonic hotspot in nucleus accumbens shell: mu, delta, and kappa maps for enhancement of sweetness "liking" and "wanting"

Daniel C Castro et al. J Neurosci. .

Abstract

A specialized cubic-millimeter hotspot in the rostrodorsal quadrant of medial shell in nucleus accumbens (NAc) of rats may mediate opioid enhancement of gustatory hedonic impact or "liking". Here, we selectively stimulated the three major subtypes of opioid receptors via agonist microinjections [mu (DAMGO), delta (DPDPE), or kappa (U50488H)] and constructed anatomical maps for functional localizations of consequent changes in hedonic "liking" (assessed by affective orofacial reactions to sucrose taste) versus "wanting" (assessed by changes in food intake). Results indicated that the NAc rostrodorsal quadrant contains a shared opioid hedonic hotspot that similarly mediates enhancements of sucrose "liking" for mu, delta, and kappa stimulations. Within the rostrodorsal hotspot boundaries each type of stimulation generated at least a doubling or higher enhancement of hedonic reactions, with comparable intensities for all three types of opioid stimulation. By contrast, a negative hedonic coldspot was mapped in the caudal half of medial shell, where all three types of opioid stimulation suppressed "liking" reactions to approximately one-half normal levels. Different anatomical patterns were produced for stimulation of food "wanting", reflected in food intake. Altogether, these results indicate that the rostrodorsal hotspot in medial shell is unique for generating opioid-induced hedonic enhancement, and add delta and kappa signals to mu as hedonic generators within the hotspot. Also, the identification of a separable NAc caudal coldspot for hedonic suppression, and separate NAc opioid mechanisms for controlling food "liking" versus "wanting" further highlights NAc anatomical heterogeneity and localizations of function within subregions of medial shell.

Keywords: nucleus accumbens; opioid.


Figures
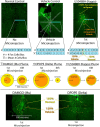
Figure 1.
Figure 1.
Fos plume maps for drug microinjections. Local Fos plumes reflect impact spread of a microinjected drug. Photomicrographs (top) show Fos expression in NAc shell of a normal (unoperated) control brain, a control brain that received a vehicle microinjection, and a brain that received a microinjection of U50488 (kappa κ). Each photo also depicts a sample bar showing Fos-expressing neuron counts at points along a radial axis emanating from center of microinjection (or equivalent bar for normal control brain). Numbers reflect the number of neurons in a box that expressed Fos. For microinjections, the average count for the corresponding box in the entire vehicle-microinjection group (n = 4) or U50488H (n = 6) group is also shown below. Such counts were used to compute elevations of drug-induced Fos compared with normal brains or vehicle brains for the corresponding location. The kappa plume shows the outer limits of where U50488H stimulated Fos expression >150% above vehicle microinjection levels (orange dashed line), and slightly larger region where Fos was stimulated >150% at least above normal control levels (yellow dashed line). Equivalent plumes are shown in photomicrographs at bottom for microinjections of DAMGO (n = 6; mu (μ) agonist) and of DPDPE (n = 6; delta (δ) agonist). The center row show illustrates the magnitude of shrinkage due to serial repetition, from maximal plumes measured after first-time microinjections in the dedicated Fos groups (shown in photomicrographs) to the sixth microinjection in rats that were tested 5 times behaviorally before a final Fos microinjection. Fos-positive labeled cells were individually counted in 50 × 50 μm squares along radial arms extending from the center of the microinjection site at 10× magnification. Such shrinkage implies that dedicated Fos groups may provide more accurate measures of maximal plume diameter than groups previously tested for behavioral effects.
Figure 2.
Figure 2.
Causation maps for localization of “liking” versus “wanting” enhancements. Sagittal maps of NAc medial shell show changes that each type of opioid agonist microinjection induced in hedonic reactions to sucrose taste (left column) and in food intake (right column) within the same individual rat (compared with taste reactions and food intake after vehicle microinjection; n = 21). Rows show mu (DAMGO; A), delta (DPDPE; B), or kappa (U50488H; C) effects. Behavioral changes are displayed as percentage changes from vehicle control levels, and both bilateral microinjection sites are plotted on the single sagittal map. Bars show mean intensity of behavioral changes produced at each stereotaxic level (anterior–posterior and dorsal–ventral levels). Colors also show intensity of behavioral changes (percentage change from within-subject vehicle control levels) induced at each site. Enhancements of “liking” in the left column are depicted in yellow, orange, and red, whereas suppression of “liking” reactions is depicted by blue. In the right column, eating enhancement is displayed by green, and suppression of eating by blue. In both columns, gray indicates no change from vehicle control level. The size of sagittal map symbols is scaled to measured Fos plume diameters for each drug. The dashed circle in rostral accumbens shows the anatomical outline of the mu hotspot originally described by Peciña and Berridge (2005) for comparison to present data, and the caudal dashed circle represents their original mu coldspot.
Figure 3.
Figure 3.
Causation maps for conditioned place preference. Sagittal maps and overall effects for establishment of conditioned place preference or avoidance is shown for mu (n = 13), delta (n = 13), and kappa (n = 13) agonist microinjections. Bars extending above the axis represent an overall conditioned place preference for a NAc region; bars below the axis represent a conditioned place avoidance. Regions are the rostrodorsal hotspot (left bar of each pair) versus the entire remaining three-quarters of medial shell outside the hotspot (rostroventral 1/3 of medial shell plus entire caudal half; right bar of each pair). Sagittal maps are similar to Figure 2. Red and orange indicates establishment of a positive place preference, and blue indicates a negative place avoidance. The dotted outline in the rostrodorsal portion of large slices indicate the original mu hotspot as originally defined by Peciña and Berridge (2005).
Figure 4.
Figure 4.
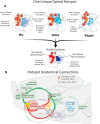
Summary maps for NAc opioid hotspots and coldspots in medial shell and relevant anatomical circuitry. A, Sagittal summary maps of NAc medial shell for mu, delta, or kappa hedonic enhancements (rostral hotspots) and suppressions (caudal coldspots) of sucrose “liking” observed here. Hotspot outlines are defined anatomically by contiguous groups of microinjection sites (sized to match Fos plumes) that caused >250% enhancements of positive orofacial hedonic reactions elicited by sucrose taste, and coldspot boundaries are defined by contiguous sites that caused suppressions to below one-half of control vehicle levels for sucrose “liking” reactions. The mu panel also shows for comparison the original hotspot and coldspot boundaries (Peciña and Berridge, 2005). The shared substrate map below is a subtraction map showing sites that produced equivalent hotspot enhancements for all three opioid stimulations, or equivalent coldspot suppressions for all three agonist microinjections. B, Anatomical circuitry features relevant to the hotspot of rostrodorsal medial shell, as described in text (based on Thompson and Swanson (2010) and on Zahm et al., (2013); TS symbol in orange boxes depicts unique features of rostrocaudal quadrant of medial shell described by Thompson and Swanson; Z symbol in purple hexagons depicts features of rostral half of medial shell described by Zahm et al.). Hedonic hotspots are shown in yellow, GABAergic projections in red, glutamatergic projections in green, and dopaminergic projections in blue. Modified from (Richard et al., 2013).

References

    1. Avena NM, Rada P, Hoebel BG. Evidence for sugar addiction: behavioral and neurochemical effects of intermittent, excessive sugar intake. Neurosci Biobehav Rev. 2008;32:20–39. doi: 10.1016/j.neubiorev.2007.04.019. - DOI - PMC - PubMed
    1. Bakshi VP, Kelley AE. Feeding induced by opioid stimulation of the ventral striatum: role of opiate receptor subtypes. J Pharmacol Exp Ther. 1993;265:1253–1260. - PubMed
    1. Baldo BA, Daniel RA, Berridge CW, Kelley AE. Overlapping distributions of orexin/hypocretin- and dopamine-beta-hydroxylase immunoreactive fibers in rat brain regions mediating arousal, motivation, and stress. J Comp Neurol. 2003;464:220–237. doi: 10.1002/cne.10783. - DOI - PubMed
    1. Bals-Kubik R, Herz A, Shippenberg TS. Evidence that the aversive effects of opioid antagonists and kappa-agonists are centrally mediated. Psychopharmacology (Berl) 1989;98:203–206. doi: 10.1007/BF00444692. - DOI - PubMed
    1. Bals-Kubik R, Ableitner A, Herz A, Shippenberg TS. Neuroanatomical sites mediating the motivational effects of opioids as mapped by the conditioned place preference paradigm in rats. J Pharmacol Exp Ther. 1993;264:489–495. - PubMed

Publication types

Substances