. 2014 Mar 19;34(12):4260-72.
doi: 10.1523/JNEUROSCI.3192-13.2014.

Passive immunization with Tau oligomer monoclonal antibody reverses tauopathy phenotypes without affecting hyperphosphorylated neurofibrillary tangles

Affiliations

Passive immunization with Tau oligomer monoclonal antibody reverses tauopathy phenotypes without affecting hyperphosphorylated neurofibrillary tangles

Diana L Castillo-Carranza et al. J Neurosci. .

Abstract

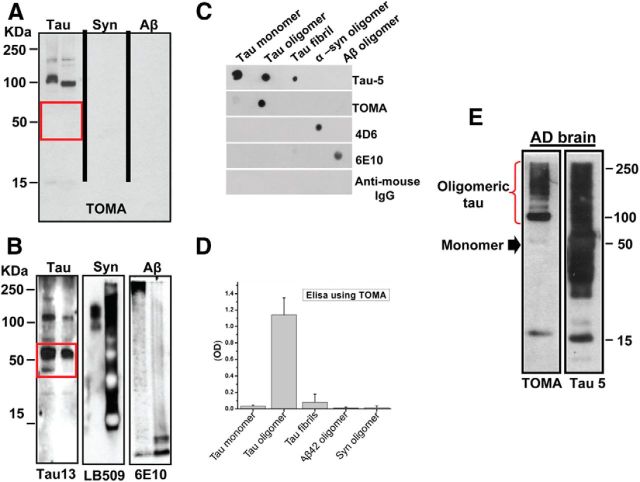
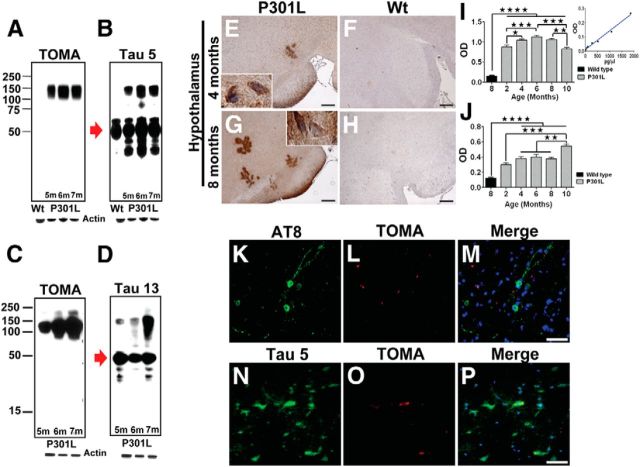
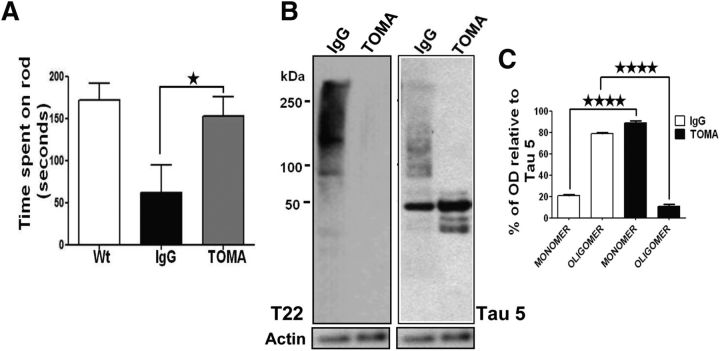
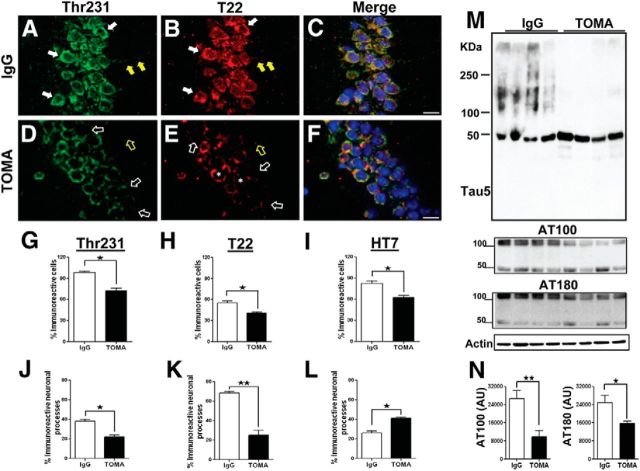
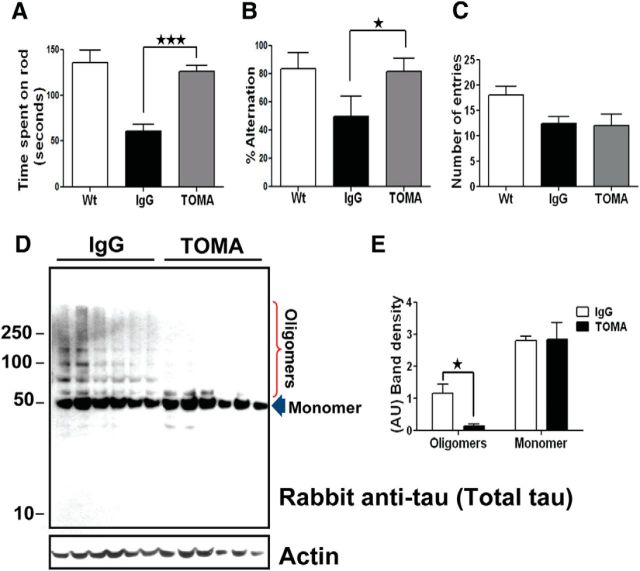
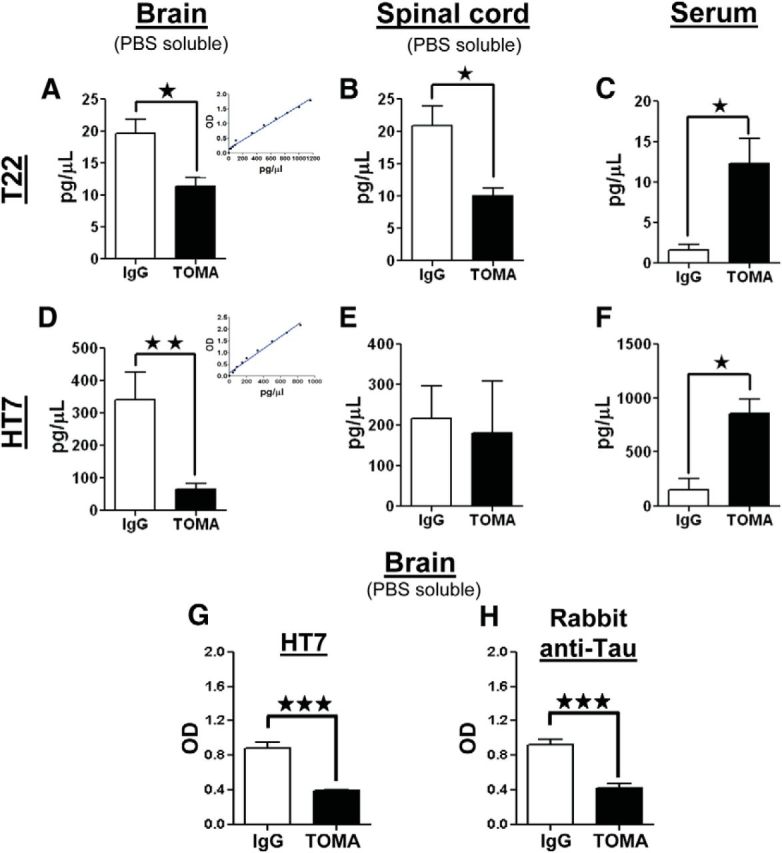
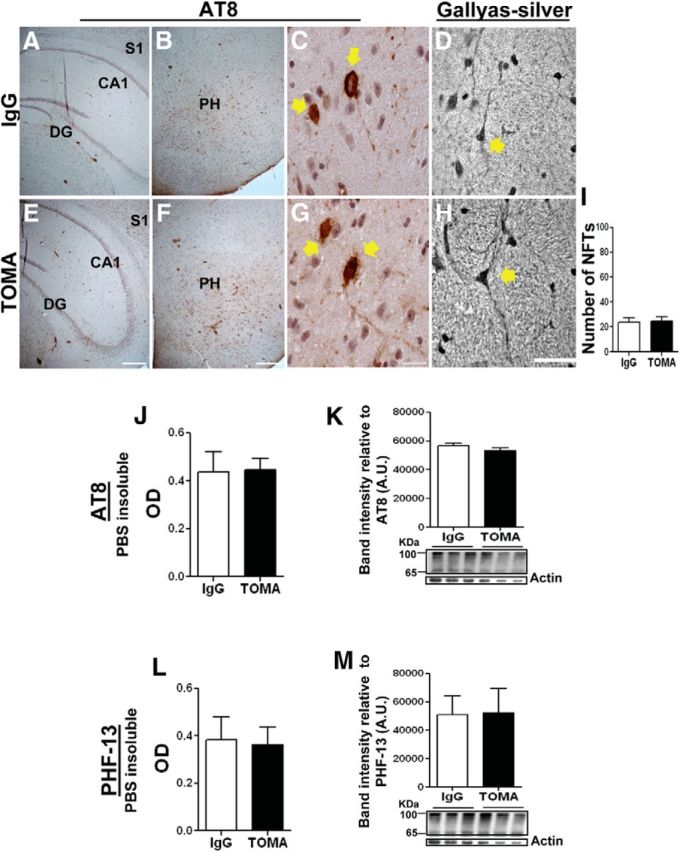
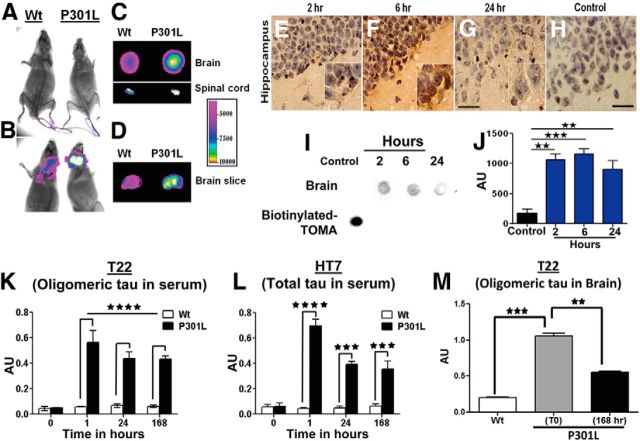
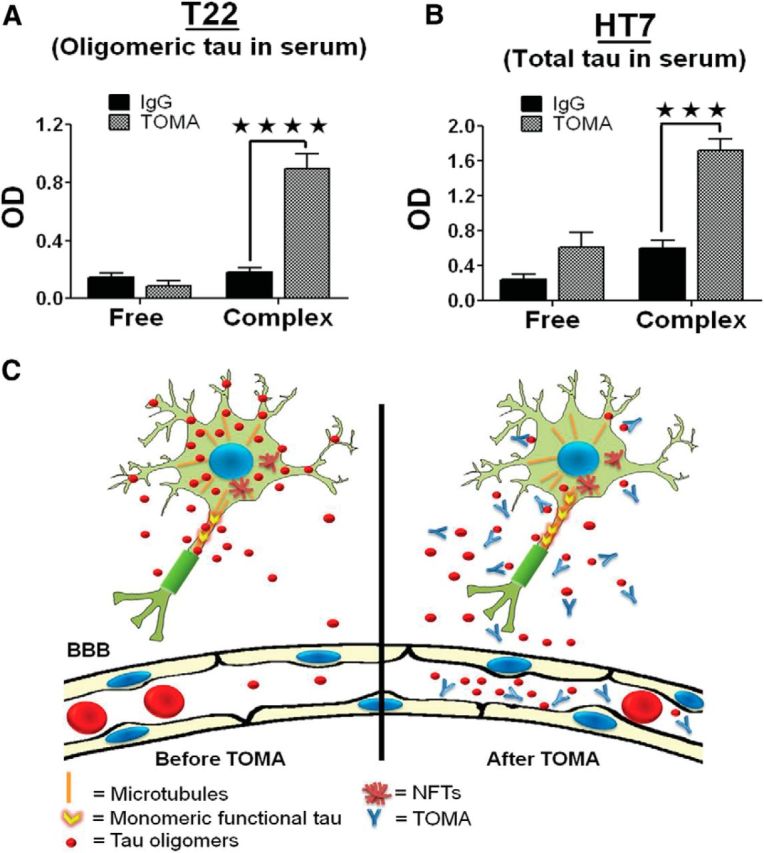
Recent findings suggest that tau oligomers, which form before neurofibrillary tangles (NFTs), are the true neurotoxic tau entities in neurodegenerative tauopathies, including Alzheimer's disease (AD). Studies in animal models of tauopathy suggest that tau oligomers play a key role in eliciting behavioral and cognitive impairments. Here, we used a novel tau oligomer-specific monoclonal antibody (TOMA) for passive immunization in mice expressing mutant human tau. A single dose of TOMA administered either intravenously or intracerebroventricularly was sufficient to reverse both locomotor and memory deficits in a mouse model of tauopathy for 60 d, coincident with rapid reduction of tau oligomers but not phosphorylated NFTs or monomeric tau. Our data demonstrate that antibody protection is mediated by extracellular and rapid peripheral clearance. These findings provide the first direct evidence in support of a critical role for tau oligomers in disease progression and validate tau oligomers as a target for the treatment of AD and other neurodegenerative tauopathies.

Keywords: Alzheimer's disease; immunotherapy; tau oligomers; tauopathies.


Figures

Figure 1.
Figure 1.
Specificity of TOMA antibody. A, Western blot analysis of tau, α-synuclein, and Aβ aggregates formed in vitro (2 μg of protein/lane) probed with TOMA antibody. B, Same membranes used in A reprobed with sequence-specific antibodies. TOMA specifically recognized tau oligomers, but did not recognize oligomers from other amyloidogenic proteins or monomeric tau (red rectangle). C, Representative dot blot analysis from recombinant tau monomer, oligomers, and fibrils; recombinant α-synuclein; and Aβ42 oligomers probed with Tau-5, TOMA, 4D6, 6E10, and anti-mouse IgG, respectively. D, ELISA analysis confirms that TOMA does not show reactivity for monomeric tau or any significant reactivity with tau fibrils prepared in vitro (50 ng/well). TOMA does not recognize oligomers from other amyloidogenic proteins such as Aβ or α-synuclein even in the sensitive ELISA analysis. E, Western blot of the PBS soluble fraction from AD brain using TOMA, which is tau-oligomer-specific, and Tau-5, which recognizes all forms of tau. TOMA specifically detected bands corresponding to tau oligomers (red brace), but did not recognize the monomeric tau (black arrow) that is abundant in AD brain as shown by immunoreactivity with Tau-5 (25 μg of protein/lane).
Figure 2.
Figure 2.
Tau oligomers in the P301L tau (JNPL3) mouse model. AD, Western blot analysis of P301L brains at different ages using TOMA (A,C) and generic tau antibodies Tau-5 and Tau-13 (B, D). TOMA detected tau oligomers, but did not recognize tau monomers (red arrow), whereas both species were detected using Tau-5 and Tau-13. EH, Photomicrographs of TOMA staining in paraffin sections using avidin-biotin complex and hematoxylin counterstaining (E, G) tau oligomers were detected by IHC in the hypothalamus of 4- and 8-month-old P301L brains using TOMA compared with wild-type C57 mice (F, H). Scale bar, 50 μm. I, J, Quantitative results of tau oligomers were determined in PBS-soluble fraction of brain homogenates from P301L mice by ELISA using TOMA. Oligomers were significantly higher at 6 months compared with 8-month-old wild-type mice and 2-month-old and 10-month-old P301L, respectively. ★★★★p < 0.0001; ★★★p < 0.0003, one-way ANOVA, Bonferroni post hoc comparison. J, Increased immunoreactivity against AT8 in 10-month-old P301L compared with wild-type mice and 2-month-old P301L and 4- to 8-month-old P301L, respectively. ★★★★p < 0.0001; ★★★p < 0.0003; ★★p < 0.001, one-way ANOVA, Bonferroni post hoc comparison. Bars represent the means and error bars the SEM. KP, Epifluorescence images of frontal cortex from 8-month-old P301L stained using AT8 (KM) and Tau-5 (NP) (green), TOMA (red), and DAPI (blue). Scale bar, 25 μm.
Figure 3.
Figure 3.
A single intracerebroventricular injection of TOMA reverses phenotypes and removes tau oligomers in 8-month-old P301L mice. A, Behavioral improvement of P301L mice immunized with TOMA (1 μg/animal) intracerebroventricular. Rotarod test was performed on three groups of mice (n = 10/group): (1) Wt: 8-month-old wild-type mice that received saline injection, (2) Control IgG: 8-month-old P301L mice immunized with anti-rhodamine IgG antibody (1 μg/animal), and (3) TOMA: 8-month-old P301L mice immunized with TOMA (1 μg/animal). Six days after injection, we evaluated mice by placing them onto the rod four times, increasing the speed each round. One day before the test, all mice were trained for four trial sessions. The rotarod test showed statistically significant behavioral improvement in mice immunized with TOMA (gray bar) compared with the control group (black bar). ★p < 0.04, one-way ANOVA, Bonferroni post hoc comparison. No statistically significant differences were found when the TOMA-immunized group was compared with the wild-type group. BC, Reduction of tau oligomers in P301L mice immunized with TOMA. The levels of tau oligomers and monomer in mouse brain homogenates were assessed by Western blot using T22 and Tau-5, which recognizes all forms of tau. B, Representative Western blot of PBS homogenates from mouse immunized with the nonspecific IgG (lane 1) and a mouse immunized with TOMA (lane 2). C, The bar graph represents the percentage of band density relative to Tau-5 that corresponds to tau oligomers and monomers in mice injected with TOMA (black bars) and controls injected with nonspecific IgG (white bars). Quantitation (n = 10/group) shows a reduction of tau oligomers compared with the control group. ★★★★p < 0.0001, one-way ANOVA, Bonferroni post hoc comparison.
Figure 4.
Figure 4.
Intracerebroventricular TOMA effects on tau pathology in P301L. Representative epifluorescence images of the CA1 region of 8-month-old P301L mice intracerebroventricularly immunized with TOMA or nonspecific IgG antibody (anti-rhodamine), immunostained with Thr231-green (A, D), T22-red (B, E), and merged + DAPI (C, F). A, Strong immunoreactivity with Thr231 in the perikaryon (solid white arrows) and neuronal processes (solid yellow arrows) of control IgG-treated mice compared with TOMA-treated mice (open white and yellow arrows; D). B, Tau oligomers as detected by T22 in somata (solid white arrows) and neuronal processes (solid yellow arrows) of IgG-treated mice. E, TOMA reduced tau oligomers in the perikaryon (open white arrows), neuronal processes (open yellow arrows), and the perinuclear area (asterisks). Scale bar, 15 μm. GL, Quantification of changes observed in brain sections of frontal cortex from 8-month-old P301L mice immunized with TOMA and P301L mice injected with control IgG and immunostained with Thr231, T22, and HT7. GI, Percentage of total immunoreactivity in cell bodies in the dentate gyrus. Shown is the reduction of Thr231 (G), T22 (H), and HT7 (I) immunoreactivity in cell bodies of mice immunized with TOMA compared with control mice. ★p < 0.02; ★p < 0.05; ★p < 0.02, respectively; Student's t test. JL, Percentage of the immunoreactivity in neuronal processes in CA1 from P301L mice treated with TOMA and control mice. Reduction of Thr231 (J) and T22 (K) immunoreactivity in the TOMA group compared with the control group. ★p < 0.01; ★★p < 0.003. L, Significant increase in HT7 (specific for human tau) immunoreactivity in the TOMA-treated mice compared with control mice. ★p < 0.04. Bars represent the means and error bars the SEM, unpaired Student's t test. The levels of tau oligomers and monomers in mouse brain homogenates were assessed by Western blot using Tau-5, AT100, and AT180. M, Western blot of PBS soluble fraction from brain homogenate of mice immunized with the nonspecific IgG antibody (lanes 1–4) and mice immunized with TOMA (lanes 5–8) detected with Tau-5 antibody and reprobed with AT100 and AT180. Internal control is shown at the bottom. N, Graphs represent the relative band intensity for AT100 and AT180 (arbitrary units, AU). The differences were statistically significant. ★★p < 0.005; ★p < 0.02, Student's t test, respectively. Bars represent means and error bars SEM.
Figure 5.
Figure 5.
A single intravenous injection of TOMA reverses phenotypes and clears tau oligomers in 8-month-old P301L mice. Three groups of mice (n = 10 /group): (1) Wt: wild-type mice that received saline injection, (2) Control IgG: P301L immunized with nonspecific IgG antibody (anti-rhodamine, 30 μg/animal), (3) TOMA: P301L immunized with TOMA (30 μg/animal). Animals were evaluated using the rotarod task for locomotor deficits and the Y-maze task for memory deficits. A, The rotarod test showed improvement of motor performance in mice immunized with TOMA (gray bar) compared with the control group (black bar). ★★★ p < 0.0003, one-way ANOVA, Bonferroni post hoc comparison. No statistically significant differences were found between the TOMA group and wild-type mice (white bar). B, The Y-maze memory test showed improved retention in TOMA-treated animals as depicted by the number of completed alternations in the Y-maze, defined as successive entry into each of the three arms of the maze without reentry into a previously visited arm. The differences were statistically significant. ★p < 0.02, one-way ANOVA, Bonferroni post hoc comparison. C, Total number of entries into all arms of the maze. D, Representative Western blot of PBS soluble fraction from brain homogenate of mice intravenous immunized with the nonspecific IgG antibody (lanes 1–6) and mice immunized with TOMA (lanes 7–12) detected with rabbit anti-tau antibody, which recognizes all tau aggregates. Internal control is shown at the bottom. E, Graphs represent the band intensity relative to rabbit anti-tau antibody (arbitrary units, AU). The differences were statistically significant. ★p < 0.005, two-way ANOVA, Bonferroni post hoc comparison. Bars represent means and error bars SEM.
Figure 6.
Figure 6.
Quantitative analyses of oligomeric and total tau in brain, spinal cord, and serum. Analyses were performed by both direct and sandwich ELISA. T22 was used for tau oligomers; HT7 and polyclonal-Tau antibodies were used for total tau. Measurements were performed using brain and spinal cord homogenates and serum from 8-month-old P301L mice immunized with either TOMA or nonspecific IgG (anti-rhodamine). AF, The graphs represent the amount (pg/μl) of oligomeric tau and total tau derived from brain (A, D) and spinal cord homogenates (B, E) and serum (C, F). Quantity of protein was calculated using standard curves (inserts in A and D). P301L animals treated with TOMA have significantly reduced oligomeric tau levels in both the brain and spinal cord and increased levels in the serum compared with the animals treated with nonspecific IgG. ★p < 0.01, Student's t test. DF, Quantification of total tau shows significantly reduced levels in the brain and significantly increased levels in the serum of the TOMA-treated group compared with the control group. ★★p < 0.009; ★p < 0.01, Student's t test. Changes in levels of total tau in the spinal cord are not statistically significant. The reduction of total tau in the brain homogenates from mice immunized with TOMA compared with mice immunized with nonspecific IgG was confirmed by sandwich ELISA (G) using Tau-5 as capture antibody and HT7 as detection antibody (H) using Tau-5 as capture antibody and polyclonal-Tau as detection antibody. The decrease in total tau in TOMA-treated mice was statistically significant. ★★★p < 0.0002, Student's t test. Bars represent means and error bars SEM.
Figure 7.
Figure 7.
TOMA does not affect NFTs in posterior hypothalamus or cortex. Coronal sections of 8-month-old P301L brain immunized with nonspecific IgG antibody (anti-rhodamine) (AD) and TOMA (EH) were immunostained with AT8 (AC and EG) and stained with the Gallyas-silver method (D, H). A and E are hippocampus; BD and FH are posterior hypothalamus (PH). CD and GH are images at higher-magnification showing NFTs (arrows) in PH. Scale bars: A, B, E, F, 100 μm; C, G, 15 μm. Graph represents the number of NFT-positive cells per field in the PH stained with AT8. JM, PBS-insoluble tau fraction from P301L mice immunized with nonspecific IgG and TOMA was analyzed by ELISA (J, L) and Western blot (K, M) using AT8 (J, K) and PHF-13 (L, M). The gel band intensity immunoreactive to AT8 and PHF-13 (∼56–100 kDa) was quantified and normalized using actin as an internal control. The differences were not statistically significant using Student's t test.
Figure 8.
Figure 8.
Extracellular and peripheral clearance of tau oligomers by TOMA. AD, In vivo imaging demonstrates that a fraction of TOMA injected into the tail vein crosses the BBB and binds to tau oligomers in the 8-month-old P301L brain and spinal cord. A, TOMA at the injection site in 8-month-old wild-type-C57 and P301L mice at time 0; animals were imaged immediately after the injection. B, Animals imaged 4 h after injection showed retention of TOMA only in the brains of P301L animals, whereas TOMA was cleared from the wild-type animals. CD, To confirm that TOMA entered the CNS, we imaged brain and spinal cord sections derived from cryotome cross-sectioning of P301L and wild-type brains and spinal cords extracted from animals killed 4 h after TOMA injection. EJ, Biotinylated TOMA antibody (30 μg/animal) was injected into the tail veins of 8-month-old P301L mice. EH, Representative images of brain sections stained with streptavidin-peroxidase demonstrate that biotinylated TOMA antibody crosses the BBB and remains in hippocampus 2, 6, and 24 h after injection. Scale bar, 30 μm. I, Dot blot analyses of PBS soluble fractions from brain homogenates of mice injected with biotinylated TOMA confirmed the presence of the biotinylated antibody in the brain compared with the control (brain homogenate from P301L mouse injected with unlabeled TOMA). A 0.5 μl aliquot of biotinylated-TOMA was used as a positive control. J, Quantification of the dot intensities. ★★★p < 0.0005; ★★p < 0.001, one-way ANOVA, Bonferroni post hoc comparison. KM, Detailed quantitative analysis of the short-term effects of intravenous TOMA injection on the levels of both oligomeric and total tau in the serum. K, Tau oligomers were quantified by direct ELISA using T22 before and at different time points shortly after TOMA injections in 8-month-old P301L and wild-type mice. The effects of TOMA were rapid and a significant increase in tau oligomer levels occurred in the serum, peaking at 1 h. By 24 h, levels began to decline. L, Levels of total tau measured by direct ELISA using HT7 confirmed TOMA effects and correlated with the changes observed for tau oligomers. ★★★★p < 0.0001; ★★★p < 0.001, two-way ANOVA, Bonferroni post hoc comparison. M, Tau oligomer reduction in brain homogenates measured 168 h after TOMA injection. ★★★p < 0.0003; ★★p < 0.001, one-way ANOVA, Bonferroni post hoc comparison. Bars represent means and error bars SEM.
Figure 9.
Figure 9.
TOMA forms complexes with tau oligomers. A, B, Quantitative analyses of tau oligomers as free or in complex with TOMA assessed using ELISA. Serum samples from P301L mice immunized either with TOMA or nonspecific IgG antibody were passed through a protein-A column. Tau oligomers and total tau in flow-through (“free” tau oligomers that did not form complex with the antibody) and the eluted fraction (antibodies and TOMA-oligomer complexes) were measured by ELISA. Quantitation of tau oligomers (A) and total tau (B) in the eluted fraction were higher compared with flow-through “free oligomers” as measured by T22 and HT7, respectively. ★★★★p < 0.0001; ★★★p < 0.001, two-way ANOVA, Bonferroni post hoc comparison. Most of the tau oligomers are complexed with TOMA. C, Schematic representation of the proposed mechanism of action for intravenously injected TOMA, which specifically modulates tau oligomers. A fraction of the injected TOMA crosses the BBB and binds extracellular oligomeric tau and tau oligomer levels in the serum peak at 1 h after injection.

References

    1. Asuni AA, Boutajangout A, Quartermain D, Sigurdsson EM. Immunotherapy targeting pathological tau conformers in a tangle mouse model reduces brain pathology with associated functional improvements. J Neurosci. 2007;27:9115–9129. doi: 10.1523/JNEUROSCI.2361-07.2007. - DOI - PMC - PubMed
    1. Augustinack JC, Schneider A, Mandelkow EM, Hyman BT. Specific tau phosphorylation sites correlate with severity of neuronal cytopathology in Alzheimer's disease. Acta Neuropathol. 2002;103:26–35. doi: 10.1007/s004010100423. - DOI - PubMed
    1. Bae EJ, Lee HJ, Rockenstein E, Ho DH, Park EB, Yang NY, Desplats P, Masliah E, Lee SJ. Antibody-aided clearance of extracellular alpha-synuclein prevents cell-to-cell aggregate transmission. J Neurosci. 2012;32:13454–13469. doi: 10.1523/JNEUROSCI.1292-12.2012. - DOI - PMC - PubMed
    1. Ballatore C, Lee VM, Trojanowski JQ. Tau-mediated neurodegeneration in Alzheimer's disease and related disorders. Nat Rev Neurosci. 2007;8:663–672. doi: 10.1038/nrn2194. - DOI - PubMed
    1. Bard F, Cannon C, Barbour R, Burke RL, Games D, Grajeda H, Guido T, Hu K, Huang J, Johnson-Wood K, Khan K, Kholodenko D, Lee M, Lieberburg I, Motter R, Nguyen M, Soriano F, Vasquez N, Weiss K, Welch B, Seubert P, Schenk D, Yednock T. Peripherally administered antibodies against amyloid beta-peptide enter the central nervous system and reduce pathology in a mouse model of Alzheimer disease. Nat Med. 2000;6:916–919. doi: 10.1038/78682. - DOI - PubMed

Publication types

MeSH terms