. 2014 Mar 19;34(12):4293-302.
doi: 10.1523/JNEUROSCI.4580-13.2014.

Parametric alpha- and beta-band signatures of supramodal numerosity information in human working memory

Affiliations

Parametric alpha- and beta-band signatures of supramodal numerosity information in human working memory

Bernhard Spitzer et al. J Neurosci. .

Abstract

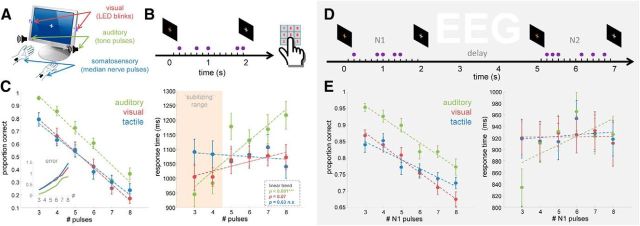
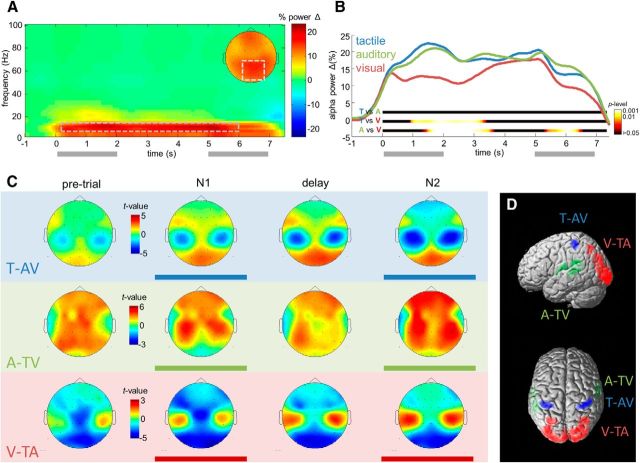
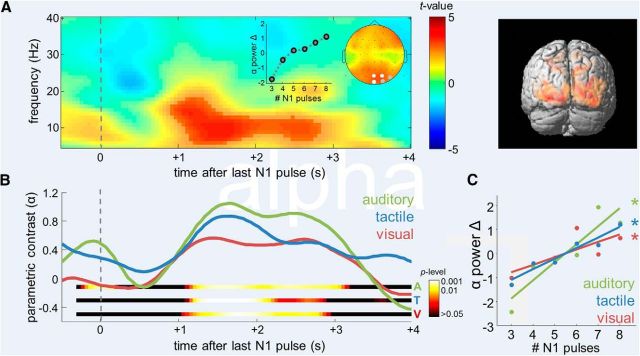
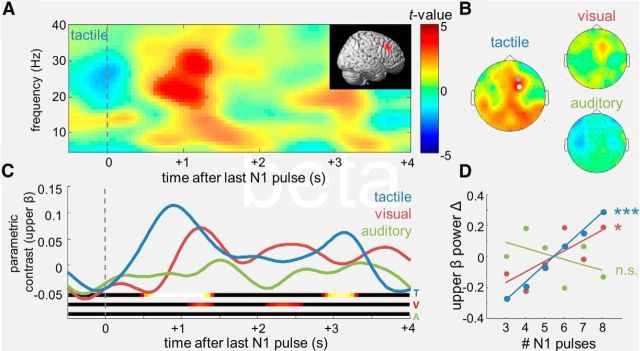
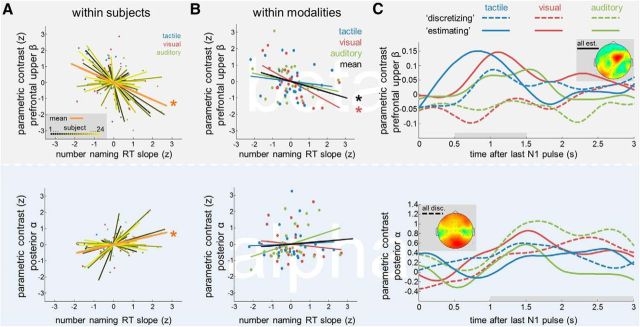
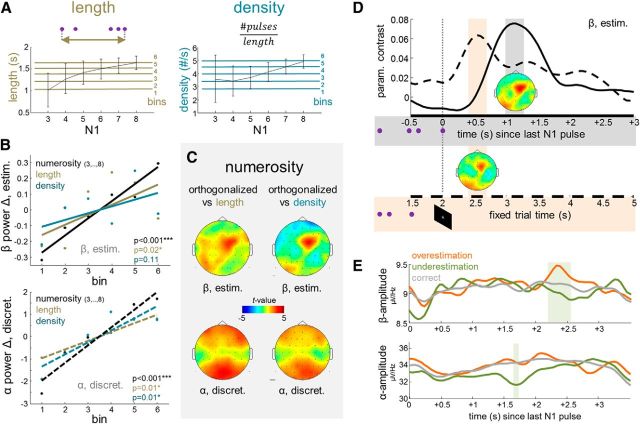
Numerosity can be assessed by analog estimation, similar to a continuous magnitude, or by discrete quantification of the individual items in a set. While the extent to which these two processes rely on common neural mechanisms remains debated, recent studies of sensory working memory (WM) have identified an oscillatory signature of continuous magnitude information, in terms of quantitative modulations of prefrontal upper beta activity (20-30 Hz). Here, we examined how such parametric oscillatory WM activity may also reflect the abstract assessment of the numerosity of discrete items. We recorded EEG while participants (n = 24) processed the number of stimulus pulses presented in the visual, auditory, or tactile modality, under otherwise identical experimental conditions. Behavioral response profiles showed varying degrees of analog estimation and of discretized quantification in the different modalities. During sustained processing in WM, the amplitude of posterior alpha oscillations (8-13 Hz) reflected the increased memory load associated with maintaining larger sets of discrete items. In contrast, earlier numerosity-dependent modulations of right prefrontal upper beta (20-30 Hz) specifically reflected the extent to which numerosity was assessed by analog estimation, both between and within presentation modalities. Together, the analog approximation-but not the discretized representation-of numerosity information exhibited a parametric oscillatory signature akin to a continuous sensory magnitude. The results suggest dissociable oscillatory mechanisms of abstract numerosity integration, at a supramodal processing stage in human WM.

Keywords: EEG; neural coding; numerical cognition; oscillations; prefrontal cortex.


Figures

Figure 1.
Figure 1.
Experimental setup, tasks, and behavioral results. A, Pulsed stimulus sequences were presented either visually, auditorily, or by electrical stimulation of the median nerve. All stimuli were presented bilaterally. B, In a separate behavioral test, subjects were asked to explicitly name the number of pulses in each sequence. C, Left, Mean proportion of correct number judgments. Error bars show SEM. Dashed lines show linear fit. Inset plot shows the average deviation (error) from the true pulse count. Right, RTs indicate serial (i.e., discretized) processing in the auditory condition, and more direct analog estimation in the remaining modalities. Red shading indicates the subitizing range (#≤4, see text for details). D, Delayed numerosity comparison task for EEG analysis. On each trial, a pulse sequence (N1, 3–8 pulses) was presented for WM maintenance and subsequent comparison against a second sequence (N2, ±1 pulse) in the same modality. E, Behavioral results. Left, Mean proportion correct N1–N2 comparisons. Right, Mean RTs, see text for details.
Figure 2.
Figure 2.
Alpha-band oscillations (8–13 Hz) during WM processing reflect overall task demands and presentation modality. A, B, Task-induced changes of alpha power. A, TF map of power changes relative to pretrial baseline, collapsed across modality conditions. Inset shows posterior scalp topography of the power changes in the TF window outlined by dashed rectangle. B, Throughout the WM delay, alpha power over parieto-occipital channels increases in each modality condition. Colored ribbons indicate the significance of pairwise comparisons between modalities. The alpha increase in the visual condition is significantly reduced only during early retention. C, D, Modality-dependent alpha topographies. C, Statistical topographical maps of modality-specific alpha activity during the different task periods, without baseline correction. For each map, alpha activity in one modality (blue, tactile; green, auditory; red, visual) was contrasted against the two remaining modalities. D, 3D source reconstructions of the modality-specific alpha decreases during WM processing, see text for details.
Figure 3.
Figure 3.
Supramodal numerosity-dependent modulation of posterior alpha. A, Left, Statistical parametric TF map indicating the significance of the linear modulation of oscillatory activity by the number of pulses in N1, collapsed across modality conditions. Epochs were time locked to presentation of the last pulse in each N1 sequence. Saturated colors delineate significant TF cluster. Channels exhibiting a significant effect are marked white in inset scalp topographical map (p < 0.001, FWE; gray, p < 0.005, FWE). Inset graph shows grand average changes in normalized alpha power as a function of numerosity. Right, 3D source reconstruction of the parametric modulation identified in left (apricot color rendering, p < 0.001) and overlap of sources in the three modalities (red rendering, pconjunction < 0.05). B, Time courses of the posterior alpha-power modulation by numerosity in the different modality conditions. Colored ribbons indicate the significance of modulation in each modality. C, Grand average changes in normalized alpha power as a function of numerosity, in the different modality conditions. Asterisks indicate the significance of linear modulation.
Figure 4.
Figure 4.
Numerosity-dependent modulations of prefrontal upper beta (20–30 Hz). A, Statistical parametric TF map of the numerosity-dependent modulation in the tactile condition, for right-prefrontal channel FC2. Saturated colors delineate significant TF cluster. Inset shows the reconstructed source in right lateral PFC. B, Statistical topographical maps of the upper-beta modulation identified in A, for the different modality conditions. Dots indicate channels showing significant effects (white, p < 0.001, FWE; gray, p < 0.05, FWE). C, D, Same layout as Figure 3, B and C, for the modulation of prefrontal upper beta.
Figure 5.
Figure 5.
Relation between numerosity-dependent EEG modulations in the WM delay and analog versus discretized quantification in the number naming task. A, Top, Within-subjects normalized correlation between the linear slope of the RT increase in the number naming task (compare Fig. 1C, right) and the parametric modulation of prefrontal upper beta (compare Fig. 4). Shallower RT slopes (indicative of analog estimation) are associated with stronger prefrontal beta-band modulations. Bottom, Same as top, for the parametric modulation of posterior alpha (compare Fig. 3). Steeper RT slopes (indicative of discretized quantification) are associated with stronger posterior alpha modulations. B, Within-modalities normalized correlation between the same variables as in A. Also within modalities, in particular in the visual condition, analog estimation is associated with enhanced parametric modulations of prefrontal upper beta. See text for details. C, Median split illustration of the delayed EEG modulation patterns according to quantification strategy. For each modality, subjects were separated into discretizing (dashed lines) or estimating (solid lines) groups, according to their individual RT slopes in the number naming task. Top, Prefrontal upper beta modulation. Bottom, Posterior alpha modulation. Topographical maps show the aggregate parametric modulations after median splitting, collapsed over all estimating (top) and discretizing (bottom) subjects and conditions.
Figure 6.
Figure 6.
A–C, Control analyses of modulations by task-irrelevant stimulus properties. A, Left, Sequence length, measured as the time interval between the first and the last pulse in each N1. Right, Temporal density, measured as the frequency of pulses within each N1 sequence. Line plots illustrate the relation to N1 numerosity; error bars indicate SD. Horizontal colored lines show the binning raster used for comparative analyses in B. B, Changes in normalized EEG power as functions of numerosity, length, or density. Top, Prefrontal upper beta, collapsed over all estimating subjects and conditions. Lower, Posterior alpha, collapsed over all discretizing subjects and conditions. C, Statistical topographical maps of parametric modulations by numerosity computed from single-trial GLM regressors that were orthogonalized against length (left) or density (right). D, Time course of prefrontal upper beta modulation, collapsed over all estimating subjects and conditions, computed from epochs time locked to the last pulse in N1 (solid line, gray shading; as in main analysis) or time locked invariantly to the end of the cued 2 s interval (dashed line, red shading; see time axis in Fig. 1D). Same color scale of statistical topographical maps as in C. E, Top, Time course of prefrontal upper beta amplitude on error trials in which N1 was overestimated (orange) or underestimated (green) in subsequent comparison against N2. The shaded area indicates the time window of significant differences. Gray line shows time course for correct comparison trials; see text for details. Bottom, Same as top, for posterior alpha amplitude.

References

    1. Allefeld C, Pütz P, Kastner K, Wackermann J. Flicker-light induced visual phenomena: frequency dependence and specificity of whole percepts and percept features. Conscious Cogn. 2011;20:1344–1362. doi: 10.1016/j.concog.2010.10.026. - DOI - PubMed
    1. Barak O, Tsodyks M, Romo R. Neuronal population coding of parametric working memory. J Neurosci. 2010;30:9424–9430. doi: 10.1523/JNEUROSCI.1875-10.2010. - DOI - PMC - PubMed
    1. Cohen Kadosh R, Walsh V. Numerical representation in the parietal lobes: abstract or not abstract? Behav Brain Sci. 2009;32:313–328. doi: 10.1017/S0140525X09990938. - DOI - PubMed
    1. Dakin SC, Tibber MS, Greenwood JA, Kingdom FA, Morgan MJ. A common visual metric for approximate number and density. Proc Natl Acad Sci U S A. 2011;108:19552–19557. doi: 10.1073/pnas.1113195108. - DOI - PMC - PubMed
    1. Dehaene S. The number sense how the mind creates mathematics. New York: Oxford UP; 1997.

Publication types

LinkOut - more resources